玩转TShark(Wireshark的命令行版) 在我感叹Wireshark图形界面的强大时候,有时候也抱怨有点慢,或者感叹下要是有命令行界面版该多好啊,实际上TShark就是WireShark的命令行版,WireShark的功能基本都有,还能组合grep/awk等编程处理分析抓包文件。
下面让我们通过一些例子来学习TShark的常用功能,所有用到的*.cap/*.pcap等都是通过tcpdump抓到的包。请收藏好,下次碰到类似问题直接用文章中的命令跑一下。
wireshark问题 配置文件路径 macOS 下
查看有哪些plugins 以及路径
不再展示协议内容 比如,info列不再显示mysql 的request、response,但是下方的二进制解析能看到select等语句,这种一般是配置文件中 disable 了mysql协议。
配置文件名:C:\Users\admin\AppData\Roaming\Wireshark\disabled_protos
如果抓包缺失很大(比如进出走两个网卡,实际只抓了一个网卡),那么协议解析后也不会正确显示。
IO graph图表无法展示数据 一般是缺数据,先把IO graph关掉再重新打开就可以了,注意图表title显示
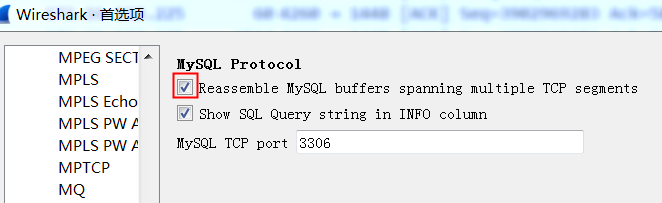
tcp segment of a reassembled pdu 这个提示是指,wireshark需要将多个tcp协议包重新组合成特定协议内容(比如MySQL,HTTP),但是因为包缺失(或者每个包大小截断了)导致reassembled失败。实际上wireshark已经成功检测到该协议,只是在解析这个协议的时候缺失包导致解析不好。
这个时候可以试试将指定协议的reassembled属性关掉
PDU:Protocol Data Unit
If the reassembly is successful, the TCP segment containing the last part of the packet will show the packet.
TCP segment of a reassembled PDU means that:
Wireshark/TShark thinks it knows what protocol is running atop TCP in that TCP segment;
that TCP segment doesn’t contain all of a “protocol data unit” (PDU) for that higher-level protocol, i.e. a packet or protocol message for that higher-level protocol, and doesn’t contain the last part of that PDU, so it’s trying to reassemble the multiple TCP segments containing that higher-level PDU.
常用命令 1 2 3 4 5 6 7 8 9 10 11 12 13 14 15 16 17 18 19 20 21 22 23 24 25 26 27 28 29 #parse 8507/4444 as mysql protocol, default only parse 3306 as mysql. sudo tshark -i eth0 -d tcp.port==8507,mysql -T fields -e mysql.query 'port 8507' sudo tshark -i any -c 50 -d tcp.port==4444,mysql -Y " ((tcp.port eq 4444 ) )" -o tcp.calculate_timestamps:true -T fields -e frame.number -e frame.time_epoch -e frame.time_delta_displayed -e ip.src -e tcp.srcport -e tcp.dstport -e ip.dst -e tcp.time_delta -e tcp.stream -e tcp.len -e mysql.query #query time sudo tshark -i eth0 -Y " ((tcp.port eq 3306 ) and tcp.len>0 )" -o tcp.calculate_timestamps:true -T fields -e frame.number -e frame.time_epoch -e frame.time_delta_displayed -e ip.src -e tcp.srcport -e tcp.dstport -e ip.dst -e tcp.time_delta -e tcp.stream -e tcp.len -e mysql.query #每隔3秒钟生成一个新文件,总共生成5个文件后(15秒后)终止抓包,然后包名也按时间规范好了 sudo tcpdump -t -s 0 tcp port 3306 -w 'dump_%Y-%m-%d_%H:%M:%S.pcap' -G 3 -W 5 -Z root #每隔30分钟生成一个包并压缩 nohup sudo tcpdump -i eth0 -t -s 0 tcp and port 3306 -w 'dump_%Y-%m-%d_%H:%M:%S.pcap' -G 1800 -W 48 -Z root -z gzip & #file size 1000M nohup sudo tcpdump -i eth0 -t -s 0 tcp and port 3306 -w 'dump_' -C 1000 -W 300 -Z root -z gzip & #抓取详细SQL语句, 快速确认client发过来的具体SQL内容: sudo tshark -i any -f 'port 8527' -s 0 -l -w - |strings sudo tshark -i eth0 -d tcp.port==3306,mysql -T fields -e mysql.query 'port 3306' sudo tshark -i eth0 -R "ip.addr==11.163.182.137" -d tcp.port==3306,mysql -T fields -e mysql.query 'port 3306' sudo tshark -i eth0 -R "tcp.srcport==62877" -d tcp.port==3001,mysql -T fields -e tcp.srcport -e mysql.query 'port 3001' #直接展示,省掉wireshark $tshark -i bond0 port 3306 -T fields -e frame.number -e frame.time_delta -e col.Source -e col.Destination -e col.Protocol -e ip.len -e col.Info -e mysql.query $tshark -i bond0 port 3306 -T fields -e frame.number -e frame.time_delta -e tcp.srcport -e tcp.dstport -e col.Info -e mysql.query $tshark -i bond0 port 3306 -T fields -E separator=, -E quote=d -e frame.number -e frame.time_delta -e tcp.srcport -e tcp.dstport -e col.Info "1","0.000000000","1620","3306","faxportwinport > mysql [SYN] Seq=0 Win=42340 Len=0 MSS=1460 SACK_PERM=1 WS=512" "2","0.000026993","3306","1620","mysql > faxportwinport [SYN, ACK] Seq=0 Ack=1 Win=29200 Len=0 MSS=1460 SACK_PERM=1 WS=128"
分析mysql的每个SQL响应时间 应用有输出的日志显示DB慢,DB监控到的日志显示自己很快,经常扯皮,如果直接在应用机器的网卡抓包,然后分析到每个SQL的响应时间,那么DB、网络都可以甩锅了(有时候应用统计的时间包含了应用自身的时间、取连接的时间等)
tshark -r 213_php.cap -Y "mysql.query or ( tcp.srcport==3306)" -o tcp.calculate_timestamps:true -T fields -e frame.number -e frame.time_epoch -e frame.time_delta_displayed -e ip.src -e tcp.srcport -e tcp.dstport -e ip.dst -e tcp.time_delta -e tcp.stream -e tcp.len -e mysql.query |sort -nk9 -nk1
1 2 3 4 5 6 7 8 9 10 11 12 13 14 15 16 17 18 19 20 21 22 23 24 25 26 27 28 29 30 31 32 33 34 35 36 37 34143 1475902394.645073000 0.000342000 10.100.53.17 3306 40383 10.100.10.213 0.000153000 2273 0 34145 1475902394.645333000 0.000260000 10.100.53.17 3306 40383 10.100.10.213 0.000253000 2273 77 34150 1475902394.645537000 0.000204000 10.100.53.17 3306 40383 10.100.10.213 0.000146000 2273 0 34151 1475902394.645706000 0.000169000 10.100.53.17 3306 40383 10.100.10.213 0.000169000 2273 11 34153 1475902394.645737000 0.000031000 10.100.10.213 40383 3306 10.100.53.17 0.000031000 2273 21 SET NAMES 'utf8' 34161 1475902394.646390000 0.000158000 10.100.53.17 3306 40383 10.100.10.213 0.000653000 2273 11 34162 1475902394.646418000 0.000028000 10.100.10.213 40383 3306 10.100.53.17 0.000028000 2273 22 START TRANSACTION 34164 1475902394.646713000 0.000295000 10.100.53.17 3306 40383 10.100.10.213 0.000295000 2273 11 34166 1475902394.646776000 0.000063000 10.100.10.213 40383 3306 10.100.53.17 0.000063000 2273 46 select AUTO_SEQ_t_order.nextval from dual 34194 1475902394.651468000 0.000909000 10.100.53.17 3306 40383 10.100.10.213 0.004692000 2273 100 34195 1475902394.651782000 0.000314000 10.100.10.213 40383 3306 10.100.53.17 0.000314000 2273 576 insert into t_order (`out_order_no`,`pk_order`,`uid`,`ytid`,`platform`,`origin_price`,`price`,`partner_id`,`ip`,`sources`,`pay_state`,`type`,`product_type`,`device`,`extension`,`spm`,`ext2`,`createtime`,`pay_channel`,`use_ytid`,`updatetime`) values ('2016100822003361672230261573284','261573284','336167223','336167223','1','500','500','100000','42.49.141.142','2','1','1','2','3','{\"showid\":\"286083\",\"play_url\":\"http:\\/\\/v.youku.com\\/v_show\\/id_XMTczOTM5NjU1Mg==.html\",\"permit_duration\":172800}','','','2016-10-08 12:53:14','201','0','2016-10-08 12:53:14') 34196 1475902394.653275000 0.001493000 10.100.53.17 3306 40383 10.100.10.213 0.001493000 2273 19 34197 1475902394.653410000 0.000135000 10.100.10.213 40383 3306 10.100.53.17 0.000135000 2273 370 insert into t_order_product (`fk_order`,`product_id`,`origin_price`,`price`,`discount`,`deliver_state`,`product_url`,`product_name`,`amount`,`ytid`,`sub_product_id`,`createtime`) values ('2016100822003361672230261573284','4000010000','500','500','0','1','http://vip.youku.com','���������������������2:���������������','1','336167223','286083','2016-10-08 12:53:14') 34198 1475902394.658326000 0.004916000 10.100.53.17 3306 40383 10.100.10.213 0.004916000 2273 19 34199 1475902394.658407000 0.000081000 10.100.10.213 40383 3306 10.100.53.17 0.000081000 2273 11 commit 34200 1475902394.659626000 0.001219000 10.100.53.17 3306 40383 10.100.10.213 0.001219000 2273 11 34201 1475902394.659811000 0.000185000 10.100.10.213 40383 3306 10.100.53.17 0.000185000 2273 22 START TRANSACTION 34202 1475902394.660054000 0.000243000 10.100.53.17 3306 40383 10.100.10.213 0.000243000 2273 11 34203 1475902394.660126000 0.000072000 10.100.10.213 40383 3306 10.100.53.17 0.000072000 2273 125 SELECT * FROM t_order where ( out_order_no = '2016100822003361672230261573284' ) AND ( ytid = '336167223' ) FOR UPDATE 34209 1475902394.661970000 0.001844000 10.100.53.17 3306 40383 10.100.10.213 0.001844000 2273 2214 34211 1475902394.662069000 0.000099000 10.100.10.213 40383 3306 10.100.53.17 0.000089000 2273 122 update t_order set `pay_state`='2',`updatetime`='2016-10-08 12:53:14' where pk_order='261573284' and ytid='336167223' 34213 1475902394.662917000 0.000848000 10.100.53.17 3306 40383 10.100.10.213 0.000848000 2273 19 34216 1475902394.663049000 0.000088000 10.100.10.213 40383 3306 10.100.53.17 0.000132000 2273 11 commit 34225 1475902394.664204000 0.000264000 10.100.53.17 3306 40383 10.100.10.213 0.001155000 2273 11 34226 1475902394.664269000 0.000065000 10.100.10.213 40383 3306 10.100.53.17 0.000065000 2273 115 SELECT * FROM t_order where ( out_order_no = '2016100822003361672230261573284' ) AND ( ytid = '336167223' ) 34235 1475902394.665694000 0.000061000 10.100.53.17 3306 40383 10.100.10.213 0.001425000 2273 2214 34354 1475902394.681464000 0.000157000 10.100.53.17 3306 40383 10.100.10.213 0.000187000 2273 0 34174 1475902394.648046000 0.001123000 10.100.53.19 3306 33471 10.100.10.213 0.000151000 2275 0 34176 1475902394.648331000 0.000285000 10.100.53.19 3306 33471 10.100.10.213 0.000278000 2275 77 34179 1475902394.648482000 0.000151000 10.100.53.19 3306 33471 10.100.10.213 0.000127000 2275 0 34180 1475902394.648598000 0.000116000 10.100.53.19 3306 33471 10.100.10.213 0.000116000 2275 11 34181 1475902394.648606000 0.000008000 10.100.10.213 33471 3306 10.100.53.19 0.000008000 2275 21 SET NAMES 'utf8' 34182 1475902394.648846000 0.000240000 10.100.53.19 3306 33471 10.100.10.213 0.000240000 2275 11 34183 1475902394.648885000 0.000039000 10.100.10.213 33471 3306 10.100.53.19 0.000039000 2275 380 select pk_auto_renew_account as account_id,fk_user as uid,platform,ytid,fk_member_conf_id as member_id,fk_product_id as product_id,price,fk_pay_channel as pay_channel,renew_type,fk_order,fk_auto_renew_subscribe_log as fk_subscribe_log,state,memo,nexttime,createtime,updatetime from t_auto_renew_account where ( ytid = '354295193' ) AND ( platform = '1' ) AND ( state <> '3' ) 34184 1475902394.650040000 0.001155000 10.100.53.19 3306 33471 10.100.10.213 0.001155000 2275 1727 34189 1475902394.650559000 0.000519000 10.100.53.19 3306 33471 10.100.10.213 0.000198000 2275 0
或者:
这个命令跑出来,倒数第四列基本就是rt
967 1548148159.346612000 0.000442000 192.168.4.18 3306 44026 192.168.100.30 0.005255000 17 1576 0.005255000
969 1548148159.346826000 0.000214000 192.168.4.18 3306 44090 192.168.100.30 0.005425000 15 1576 0.005425000
973 1548148159.347428000 0.000602000 192.168.4.18 3306 44070 192.168.100.30 0.005517000 8 2500 0.005517000
979 1548148159.348640000 0.001212000 192.168.4.18 3306 44048 192.168.100.30 0.005517000 22 2462 0.005517000
981 1548148159.348751000 0.000111000 192.168.4.18 3306 44066 192.168.100.30 0.005855000 21 2692 0.005855000
983 1548148159.348844000 0.000093000 192.168.4.18 3306 44046 192.168.100.30 0.004589000 3 2692 0.004589000
985 1548148159.348981000 0.000137000 192.168.4.18 3306 44012 192.168.100.30 0.004885000 19 2443 0.004885000
990 1548148159.349293000 0.000312000 192.168.4.18 3306 44074 192.168.100.30 0.005923000 5 2692 0.005923000
994 1548148159.349671000 0.000378000 192.168.4.18 3306 44080 192.168.100.30 0.004889000 4 2730 0.004889000
1009 1548148159.350591000 0.000920000 192.168.4.18 3306 44022 192.168.100.30 0.004187000 14 1448 0.004187000
1010 1548148159.350592000 0.000001000 192.168.4.18 3306 44022 192.168.100.30 0.000001000 14 1052
1013 1548148159.350790000 0.000198000 192.168.4.18 3306 44002 192.168.100.30 0.005998000 0 1576 0.005998000
1026 1548148159.352207000 0.001417000 192.168.4.18 3306 44026 192.168.100.30 0.005348000 17 1448 0.005348000
1027 1548148159.352217000 0.000010000 192.168.4.18 3306 44026 192.168.100.30 0.000010000 17 1052
1036 1548148159.352973000 0.000756000 192.168.4.18 3306 44090 192.168.100.30 0.005940000 15 2500 0.005940000
1041 1548148159.353683000 0.000710000 192.168.4.18 3306 44070 192.168.100.30 0.005190000 8 2692 0.005190000
1043 1548148159.353737000 0.000054000 192.168.4.18 3306 44066 192.168.100.30 0.004635000 21 1448 0.004635000
1044 1548148159.353749000 0.000012000 192.168.4.18 3306 44066 192.168.100.30 0.000012000 21 128
1051 1548148159.354289000 0.000540000 192.168.4.18 3306 44046 192.168.100.30 0.004911000 3 1576 0.004911000
1054 1548148159.354511000 0.000222000 192.168.4.18 3306 44080 192.168.100.30 0.004515000 4 1576 0.004515000
1055 1548148159.354530000 0.000019000 192.168.4.18 3306 44074 192.168.100.30 0.004909000 5 1576 0.004909000
1065 1548148159.355412000 0.000882000 192.168.4.18 3306 44012 192.168.100.30 0.005217000 19 2692 0.005217000
1067 1548148159.355496000 0.000084000 192.168.4.18 3306 44048 192.168.100.30 0.005231000 22 2610 0.005231000
1072 1548148159.356111000 0.000615000 192.168.4.18 3306 44052 192.168.100.30 0.005830000 24 2730 0.005830000
1076 1548148159.356545000 0.000434000 192.168.4.18 3306 44022 192.168.100.30 0.005615000 14 2692 0.005615000
1079 1548148159.357012000 0.000467000 192.168.4.18 3306 44002 192.168.100.30 0.005966000 0 2462 0.005966000
1082 1548148159.357235000 0.000223000 192.168.4.18 3306 44072 192.168.100.30 0.004817000 23 2692 0.004817000
1093 1548148159.359244000 0.002009000 192.168.4.18 3306 44070 192.168.100.30 0.005188000 8 1576 0.005188000
MySQL响应时间直方图【第八列的含义– Time since previous frame in this TCP stream: seconds】 tshark -r gege_drds.pcap -Y "mysql.query or (tcp.srcport==3306 and tcp.len>60)" -o tcp.calculate_timestamps:true -T fields -e frame.number -e frame.time_epoch -e frame.time_delta_displayed -e ip.src -e tcp.srcport -e tcp.dstport -e ip.dst -e tcp.time_delta -e tcp.stream -e tcp.len | awk 'BEGIN {sum0=0;sum3=0;sum10=0;sum30=0;sum50=0;sum100=0;sum300=0;sum500=0;sum1000=0;sumo=0;count=0;sum=0} {rt=$8; if(rt>=0.000) sum=sum+rt; count=count+1; if(rt<=0.000) sum0=sum0+1; else if(rt<0.003) sum3=sum3+1 ; else if(rt<0.01) sum10=sum10+1; else if(rt<0.03) sum30=sum30+1; else if(rt<0.05) sum50=sum50+1; else if(rt < 0.1) sum100=sum100+1; else if(rt < 0.3) sum300=sum300+1; else if(rt < 0.5) sum500=sum500+1; else if(rt < 1) sum1000=sum1000+1; else sum=sum+1 ;} END{printf "-------------\n3ms:\t%s \n10ms:\t%s \n30ms:\t%s \n50ms:\t%s \n100ms:\t%s \n300ms:\t%s \n500ms:\t%s \n1000ms:\t%s \n>1s:\t %s\n-------------\navg: %.6f \n" , sum3,sum10,sum30,sum50,sum100,sum300,sum500,sum1000,sumo,sum/count;}'
-------------
3ms: 145037
10ms: 78811
30ms: 7032
50ms: 2172
100ms: 1219
300ms: 856
500ms: 449
1000ms:118
>1s: 0
-------------
avg: 0.005937
对于rt分析,要注意一个query多个response情况(response结果多,分包了),分析这种rt的时候只看query之后的第一个response,其它连续response需要忽略掉。
有时候应用说修改库存的代码都加了事务,但是数据库里库存对不上,这锅压力好大,抓个包看看应用发过来的SQL是啥 开发测试环境上通过如下命令也可以直接用tshark抓包分析SQL语句:
sudo tshark -i eth0 -d tcp.port==3306,mysql -T fields -e mysql.query 'port 3306'
这样就直接看到发出的SQL是否是autocommit=1了
HTTP响应时间分析 1 2 3 4 5 //按秒汇总每个http response 耗时 tshark -r dump.pcap -Y 'http.time>0 ' -T fields -e frame.number -e frame.time_epoch -e frame.time_delta_displayed -e ip.src -e ip.dst -e tcp.stream -e http.request.full_uri -e http.response.code -e http.time | awk '{ print int($2), $8 }' | awk '{ sum[$1]+=$2; count[$1]+=1 ;} END { for (key in count) { printf "time= %s \t count=%s \t avg=%.6f \n", key, count[key], sum[key]/count[key] } }' | sort -k2n | awk '{ print strftime("%c",$2), $0 }' //on macOS tshark -r dump.pcap -Y 'http.response_for.uri contains "health" ' -T fields -e frame.number -e frame.time_epoch -e frame.time_delta_displayed -e ip.src -e ip.dst -e tcp.stream -e http.request.full_uri -e http.response_for.uri -e http.time | awk '{ print int($2/10), $8 }' | awk '{ sum[$1]+=$2; count[$1]+=1 ;} END { for (key in count) { printf "time= %s \t count=%s \t avg=%.6f \n", key, count[key], sum[key]/count[key] } }' | sort -k2n | gawk '{ print strftime("%c",$2), $0 }'
按http response分析响应时间 第三列是RT,倒数第二列是stream,同一个stream是一个连接。对应http response 200的是请求响应结果的RT
1 2 3 4 5 6 7 8 9 10 11 12 13 14 15 16 17 18 19 20 21 22 23 24 25 26 27 28 29 30 31 32 33 34 35 36 37 38 39 # tshark -nr 10.cap -o tcp.calculate_timestamps:true -Y "http.request or http.response" -T fields -e frame.number -e frame.time_epoch -e tcp.time_delta -e ip.src -e ip.dst -e tcp.stream -e http.request.full_uri -e http.response.code -e http.response.phrase | sort -nk6 -nk1 82579 1631791992.105383000 0.000113000 172.26.2.13 172.26.13.107 1198 http://plantegg/ajax.sword 83167 1631791992.261663000 0.156042000 172.26.13.107 172.26.2.13 1198 200 84917 1631791992.775011000 0.513106000 172.26.2.13 172.26.13.107 1198 http://plantegg/ajax.sword 86388 1631791993.188458000 0.413018000 172.26.13.107 172.26.2.13 1198 200 87391 1631791993.465156000 0.276608000 172.26.2.13 172.26.13.107 1198 http://plantegg/ajax.sword 88067 1631791993.645780000 0.179832000 172.26.13.107 172.26.2.13 1198 200 89364 1631791993.994322000 0.348324000 172.26.2.13 172.26.13.107 1198 http://plantegg/ajax.sword 89843 1631791994.140131000 0.145169000 172.26.13.107 172.26.2.13 1198 200 91387 1631791994.605527000 0.465245000 172.26.2.13 172.26.13.107 1198 http://plantegg/ajax.sword 92271 1631791994.920607000 0.314639000 172.26.13.107 172.26.2.13 1198 200 93491 1631791995.323424000 0.402724000 172.26.2.13 172.26.13.107 1198 http://plantegg/ajax.sword 93860 1631791995.403614000 0.079834000 172.26.13.107 172.26.2.13 1198 200 97221 1631791996.347307000 0.943423000 172.26.2.13 172.26.13.107 1198 http://plantegg/ajax.sword 97862 1631791996.544563000 0.196448000 172.26.13.107 172.26.2.13 1198 200 99613 1631791997.065735000 0.521095000 172.26.2.13 172.26.13.107 1198 http://plantegg/ajax.sword 82714 1631791992.141943000 0.000122000 172.26.2.13 172.26.12.147 1199 http://plantegg/ajax.sword 83055 1631791992.235637000 0.093471000 172.26.12.147 172.26.2.13 1199 200 84789 1631791992.739133000 0.503423000 172.26.2.13 172.26.12.147 1199 http://plantegg/ajax.sword 85525 1631791992.946220000 0.206860000 172.26.12.147 172.26.2.13 1199 200 88208 1631791993.677995000 0.731490000 172.26.2.13 172.26.12.147 1199 http://plantegg/ajax.sword 88638 1631791993.800956000 0.122637000 172.26.12.147 172.26.2.13 1199 200 91010 1631791994.476918000 0.675911000 172.26.2.13 172.26.12.147 1199 http://plantegg/ajax.sword 92079 1631791994.874566000 0.397357000 172.26.12.147 172.26.2.13 1199 200 94480 1631791995.581990000 0.707200000 172.26.2.13 172.26.12.147 1199 http://plantegg/ajax.sword 94764 1631791995.665365000 0.082906000 172.26.12.147 172.26.2.13 1199 200 96241 1631791996.090803000 0.425378000 172.26.2.13 172.26.12.147 1199 http://plantegg/ajax.sword 96731 1631791996.215406000 0.124276000 172.26.12.147 172.26.2.13 1199 200 98832 1631791996.818172000 0.602695000 172.26.2.13 172.26.12.147 1199 http://plantegg/ajax.sword 99735 1631791997.105453000 0.286845000 172.26.12.147 172.26.2.13 1199 200 83462 1631791992.351494000 0.000042000 172.26.2.13 172.26.9.77 1200 http://plantegg/ajax.sword 84309 1631791992.558541000 0.206305000 172.26.9.77 172.26.2.13 1200 200 86253 1631791993.152426000 0.593767000 172.26.2.13 172.26.9.77 1200 http://plantegg/ajax.sword 86740 1631791993.270402000 0.117311000 172.26.9.77 172.26.2.13 1200 200 89775 1631791994.112908000 0.842414000 172.26.2.13 172.26.9.77 1200 http://plantegg/ajax.sword 90429 1631791994.312254000 0.199015000 172.26.9.77 172.26.2.13 1200 200 92840 1631791995.086191000 0.773857000 172.26.2.13 172.26.9.77 1200 http://plantegg/ajax.sword 93262 1631791995.257123000 0.170488000 172.26.9.77 172.26.2.13 1200 200
改进版本,每10秒钟统计http response耗时,最后按时间排序输出:
1 2 3 4 5 6 7 8 9 10 11 12 13 14 15 16 17 18 19 20 21 tshark -r 0623.pcap -Y 'http.time>0 ' -T fields -e frame.number -e frame.time_epoch -e frame.time_delta_displayed -e ip.src -e ip.dst -e tcp.stream -e http.request.full_uri -e http.response_for.uri -e http.time | awk '{ print int($2/10), $8 }' | awk '{ sum[$1]+=$2; count[$1]+=1 ;} END { for (key in count) { printf "time= %s \t count=%s \t avg=%.6f \n", key, count[key], sum[key]/count[key] } }' | sort -k2n | gawk '{ print strftime("%c",$2*10), $0 }' 四 6/23 14:17:30 2022 time= 165596505 count=15289 avg=0.012168 四 6/23 14:17:40 2022 time= 165596506 count=38725 avg=0.013669 四 6/23 14:17:50 2022 time= 165596507 count=42545 avg=0.014140 四 6/23 14:18:00 2022 time= 165596508 count=45613 avg=0.016915 四 6/23 14:18:10 2022 time= 165596509 count=49033 avg=0.018768 四 6/23 14:18:20 2022 time= 165596510 count=49797 avg=0.025015 四 6/23 14:18:30 2022 time= 165596511 count=49670 avg=0.034057 四 6/23 14:18:40 2022 time= 165596512 count=49524 avg=0.040647 四 6/23 14:18:50 2022 time= 165596513 count=49204 avg=0.034251 四 6/23 14:19:00 2022 time= 165596514 count=48024 avg=0.037120 四 6/23 14:19:10 2022 time= 165596515 count=49301 avg=0.041453 四 6/23 14:19:20 2022 time= 165596516 count=42174 avg=0.049191 四 6/23 14:19:30 2022 time= 165596517 count=49437 avg=0.050924 四 6/23 14:19:40 2022 time= 165596518 count=49563 avg=0.050709 四 6/23 14:19:50 2022 time= 165596519 count=49517 avg=0.047916 四 6/23 14:20:00 2022 time= 165596520 count=48256 avg=0.057453 四 6/23 14:20:10 2022 time= 165596521 count=49412 avg=0.053587 四 6/23 14:20:20 2022 time= 165596522 count=51361 avg=0.053422 四 6/23 14:20:30 2022 time= 165596523 count=45610 avg=0.067171 四 6/23 14:20:40 2022 time= 165596524 count=54 avg=2.886536
解析已知协议与IP域名映射 以下技巧抄自:https://www.ilikejobs.com/posts/wireshark/
查询当前已经解析了哪些域名
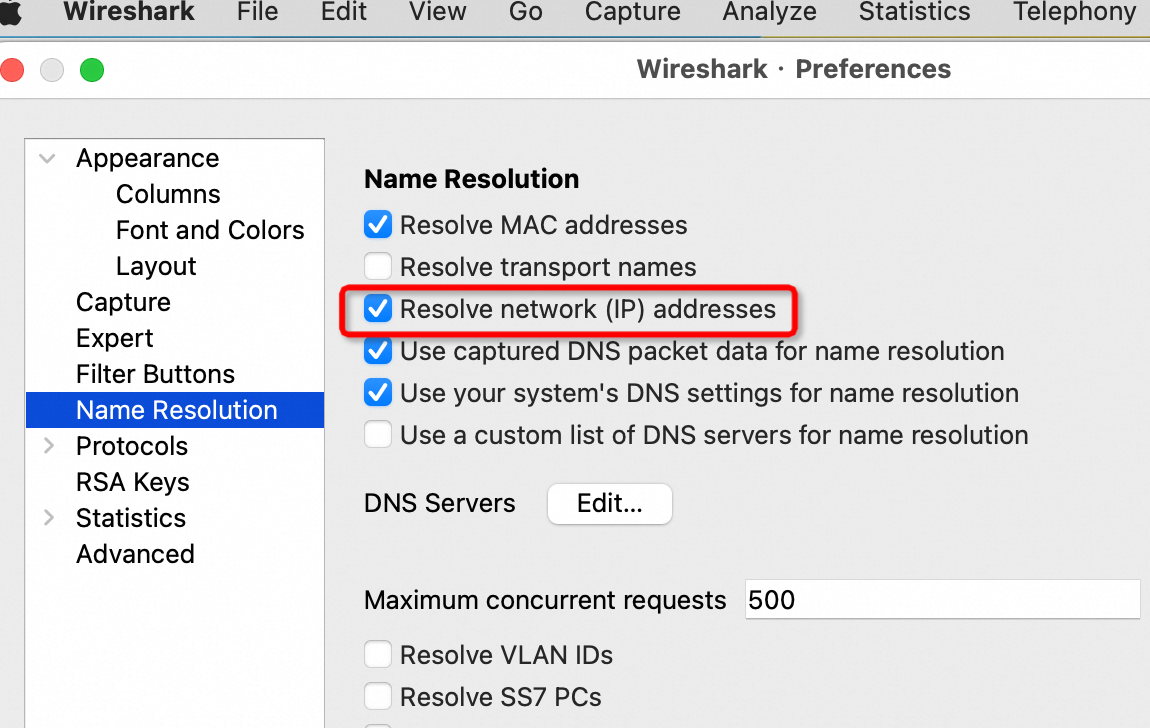
设置私有IP名称 先确认下图红框选项是选上的:
查看刚设置自定义的名称:
保存文件(含host对应名称)
分析包的总概览 1 2 3 4 5 6 7 8 9 10 11 12 13 14 15 16 17 18 19 20 $ capinfos rsb2.cap File name: rsb2.cap File type: Wireshark/tcpdump/... - pcap File encapsulation: Ethernet Packet size limit: file hdr: 65535 bytes Number of packets: 510 k File size: 143 MB Data size: 135 MB Capture duration: 34 seconds Start time: Tue Jun 7 11:15:31 2016 End time: Tue Jun 7 11:16:05 2016 Data byte rate: 3997 kBps Data bit rate: 31 Mbps Average packet size: 265.62 bytes Average packet rate: 15 kpackets/sec SHA1: a8367d0d291eab6ba78732d092ae72a5305756a2 RIPEMD160: ec991772819f316d2f629745d4b58fb861e41fc6 MD5: 53975139fa49581eacdb42bd967cbd58 Strict time order: False
分析每两个IP之间的流量 1 2 3 4 5 6 7 8 9 10 11 12 13 14 15 16 17 $ tshark -r retrans.cap -q -z 'conv,ip' ================================================================================ IPv4 Conversations Filter:<No Filter> | <- | | -> | | Total | Relative | Duration | | Frames Bytes | | Frames Bytes | | Frames Bytes | Start | | 100.98.50.214 <-> 10.117.41.213 425 60647 544 350182 969 410829 0.856983000 88.7073 10.252.138.13 <-> 10.117.41.213 381 131639 451 45706 832 177345 3.649894000 79.5370 10.168.127.178 <-> 10.117.41.213 335 118164 390 39069 725 157233 3.456698000 81.2639 10.168.246.105 <-> 10.117.41.213 435 23490 271 14634 706 38124 0.000000000 89.7614 10.117.49.244 <-> 10.117.41.213 452 24408 221 11934 673 36342 0.289990000 89.6024 100.97.197.0 <-> 10.117.41.213 45 4226 107 7310 152 11536 0.538867000 88.0736 100.97.196.0 <-> 10.117.41.213 48 4576 102 6960 150 11536 0.524268000 89.0840 100.97.196.128 <-> 10.117.41.213 39 3462 90 6116 129 9578 0.573839000 88.0728 100.97.197.128 <-> 10.117.41.213 27 1998 81 5562 108 7560 1.071232000 87.0382 100.98.148.129 <-> 10.117.41.213 55 3630 37 2442 92 6072 0.571963000 86.7362 ================================================================================
分析每个会话的流量 1 2 3 4 5 6 7 8 9 10 11 12 13 14 15 16 17 18 19 20 21 22 23 24 25 26 27 28 29 30 31 32 33 34 $ tshark -r retrans.cap -q -z 'conv,tcp' ================================================================================ TCP Conversations Filter:<No Filter> | <- | | -> | | Total | Relative | Duration | | Frames Bytes | | Frames Bytes | | Frames Bytes | Start | | 10.117.41.213:33362 <-> 100.98.50.214:3306 143 107183 108 17345 251 124528 9.556973000 79.9993 10.117.41.213:32695 <-> 100.98.50.214:3306 131 95816 118 17843 249 113659 3.464596000 54.7814 10.117.41.213:33737 <-> 100.98.50.214:3306 107 67199 82 11842 189 79041 69.539519000 13.0781 10.117.41.213:33736 <-> 100.98.50.214:3306 58 37851 31 4895 89 42746 69.539133000 8.2015 10.117.41.213:33735 <-> 100.98.50.214:3306 51 37654 27 3338 78 40992 69.538573000 20.0257 10.117.41.213:33681 <-> 100.98.50.214:3306 22 2367 15 2480 37 4847 58.237482000 0.0082 10.252.138.13:17926 <-> 10.117.41.213:3306 13 3454 17 1917 30 5371 77.462089000 0.2816 10.168.127.178:21250 <-> 10.117.41.213:3306 13 4926 17 2267 30 7193 77.442197000 0.6282 10.252.138.13:17682 <-> 10.117.41.213:3306 13 5421 17 2267 30 7688 34.945805000 0.7274 10.168.127.178:21001 <-> 10.117.41.213:3306 18 9872 11 1627 29 11499 21.220800000 35.0242 10.252.138.13:17843 <-> 10.117.41.213:3306 13 4453 15 1510 28 5963 59.176447000 10.8169 10.168.127.178:20927 <-> 10.117.41.213:3306 12 4414 15 1510 27 5924 13.686763000 0.1860 10.252.138.13:17481 <-> 10.117.41.213:3306 11 4360 16 1564 27 5924 3.649894000 0.1810 10.252.138.13:17928 <-> 10.117.41.213:3306 11 3077 15 1461 26 4538 77.467248000 0.6720 10.168.127.178:21241 <-> 10.117.41.213:3306 11 3077 15 1461 26 4538 77.376858000 0.4669 10.168.127.178:21201 <-> 10.117.41.213:3306 12 3971 14 2571 26 6542 64.890147000 5.4010 10.168.127.178:21184 <-> 10.117.41.213:3306 12 6775 14 1794 26 8569 64.073021000 5.6804 10.252.138.13:17545 <-> 10.117.41.213:3306 11 4379 15 1510 26 5889 13.940379000 0.1845 10.168.127.178:20815 <-> 10.117.41.213:3306 11 4360 15 1510 26 5870 3.456698000 0.1901 10.252.138.13:17864 <-> 10.117.41.213:3306 12 2985 12 1129 24 4114 59.855131000 9.7005 10.252.138.13:17820 <-> 10.117.41.213:3306 11 5529 13 1740 24 7269 49.537379000 0.1669 10.252.138.13:17757 <-> 10.117.41.213:3306 11 6006 13 1740 24 7746 45.507148000 0.7587 10.252.138.13:17677 <-> 10.117.41.213:3306 11 5529 13 1740 24 7269 34.806484000 0.5017 10.168.127.178:21063 <-> 10.117.41.213:3306 11 3848 13 1390 24 5238 29.902032000 0.0133 10.252.138.13:17516 <-> 10.117.41.213:3306 11 5985 13 1740 24 7725 11.505585000 0.1494 10.252.138.13:17507 <-> 10.117.41.213:3306 11 3570 13 1424 24 4994 9.652955000 0.0151 10.252.138.13:17490 <-> 10.117.41.213:3306 11 5985 13 1740 24 7725 4.865639000 0.1275
分析每个包的response time
$ tshark -r rsb2.cap -o tcp.calculate_timestamps:true -T fields -e frame.number -e frame.time_epoch -e ip.src -e ip.dst -e tcp.stream -e tcp.len -e tcp.analysis.initial_rtt -e tcp.time_delta
1 2 3 4 5 6 7 8 9 10 11 12 13 14 15 16 17 18 19 20 21 1481 1465269331.308138000 100.98.199.36 10.25.92.13 302 0 0.002276000 1482 1465269331.308186000 10.25.92.13 100.98.199.36 361 11 0.000063000 1483 1465269331.308209000 100.98.199.36 10.25.92.13 496 0 0.004950000 1484 1465269331.308223000 100.98.199.36 10.25.92.13 513 0 0.000000000 1485 1465269331.308238000 100.98.199.36 10.25.92.13 326 0 0.055424000 1486 1465269331.308246000 100.98.199.36 10.25.92.13 514 0 0.000000000 1487 1465269331.308261000 10.25.92.71 10.25.92.13 48 0 0.000229000 1488 1465269331.308277000 100.98.199.36 10.25.92.13 254 0 0.055514000 1489 1465269331.308307000 100.98.199.36 10.25.92.13 292 0 0.002096000 1490 1465269331.308383000 100.98.199.36 10.25.92.13 308 0 0.055406000 1491 1465269331.308403000 100.98.199.36 10.25.92.13 75 0 0.041664000 1492 1465269331.308421000 100.98.199.36 10.25.92.13 291 0 0.001973000 1493 1465269331.308532000 100.98.199.36 10.25.92.13 509 0 0.002100000 1494 1465269331.308567000 100.98.199.36 10.25.92.13 123 0 0.041560000 1495 1465269331.308576000 100.98.199.36 10.25.92.13 232 11 0.063317000 1496 1465269331.308584000 100.98.199.36 10.25.92.13 465 655 0.018121000 1497 1465269331.308626000 100.98.199.36 10.25.92.13 61 655 0.042409000 1498 1465269331.308637000 100.98.199.36 10.25.92.13 146 0 0.001520000 1499 1465269331.308639000 100.98.199.36 10.25.92.13 510 0 0.001460000 1500 1465269331.308645000 100.98.199.36 10.25.92.13 237 11 0.063273000
分析有问题的包、概览 1 2 3 4 5 6 7 8 9 10 11 12 13 14 15 16 17 18 19 20 21 22 23 24 25 26 27 28 29 $ tshark -r retrans.cap -q -z 'expert,note' Errors (22) ============= Frequency Group Protocol Summary 22 Malformed MySQL Malformed Packet (Exception occurred) Warns (749) ============= Frequency Group Protocol Summary 538 Sequence TCP ACKed segment that wasn't captured (common at capture start) 192 Sequence TCP Connection reset (RST) 19 Sequence TCP Previous segment not captured (common at capture start) Notes (1162) ============= Frequency Group Protocol Summary 84 Sequence TCP TCP keep-alive segment 274 Sequence TCP Duplicate ACK (#1) 37 Sequence TCP ACK to a TCP keep-alive segment 23 Sequence TCP This frame is a (suspected) retransmission 262 Sequence TCP Duplicate ACK (#2) 259 Sequence TCP Duplicate ACK (#3) 141 Sequence TCP Duplicate ACK (#4) 69 Sequence TCP Duplicate ACK (#5) 7 Sequence TCP Duplicate ACK (#6) 5 Sequence TCP This frame is a (suspected) spurious retransmission 1 Sequence TCP Duplicate ACK (#7)
分析rtt、丢包、deplicate等等
$ tshark -r retrans.cap -q -z io,stat,1,”AVG(tcp.analysis.ack_rtt)tcp.analysis.ack_rtt”,”COUNT(tcp.analysis.retransmission) tcp.analysis.retransmission”,”COUNT(tcp.analysis.fast_retransmission) tcp.analysis.fast_retransmission”,”COUNT(tcp.analysis.duplicate_ack) tcp.analysis.duplicate_ack”,”COUNT(tcp.analysis.lost_segment) tcp.analysis.lost_segment”,”MIN(tcp.window_size)tcp.window_size”
1 2 3 4 5 6 7 8 9 10 11 12 13 14 15 16 17 18 19 20 21 22 23 24 25 26 27 28 29 30 31 32 33 34 =================================================================================== | IO Statistics | | | | Duration: 89.892365 secs | | Interval: 2 secs | | | | Col 1: AVG(tcp.analysis.ack_rtt)tcp.analysis.ack_rtt | | 2: COUNT(tcp.analysis.retransmission) tcp.analysis.retransmission | | 3: COUNT(tcp.analysis.fast_retransmission) tcp.analysis.fast_retransmission | | 4: COUNT(tcp.analysis.duplicate_ack) tcp.analysis.duplicate_ack | | 5: COUNT(tcp.analysis.lost_segment) tcp.analysis.lost_segment | | 6: AVG(tcp.window_size)tcp.window_size | |---------------------------------------------------------------------------------| | |1 |2 |3 |4 |5 |6 | | | Interval | AVG | COUNT | COUNT | COUNT | COUNT | AVG | | |-------------------------------------------------------------| | | 0 <> 2 | 0.001152 | 0 | 0 | 0 | 0 | 4206 | | | 2 <> 4 | 0.002088 | 0 | 0 | 0 | 1 | 6931 | | | 4 <> 6 | 0.001512 | 0 | 0 | 0 | 0 | 7099 | | | 6 <> 8 | 0.002859 | 0 | 0 | 0 | 0 | 7171 | | | 8 <> 10 | 0.001716 | 0 | 0 | 0 | 0 | 6472 | | | 10 <> 12 | 0.000319 | 0 | 0 | 0 | 2 | 5575 | | | 12 <> 14 | 0.002030 | 0 | 0 | 0 | 0 | 6922 | | | 14 <> 16 | 0.003371 | 0 | 0 | 0 | 2 | 5884 | | | 16 <> 18 | 0.000138 | 0 | 0 | 0 | 1 | 3480 | | | 18 <> 20 | 0.000999 | 0 | 0 | 0 | 4 | 6665 | | | 20 <> 22 | 0.000682 | 0 | 0 | 41 | 2 | 5484 | | | 22 <> 24 | 0.002302 | 2 | 0 | 19 | 0 | 7127 | | | 24 <> 26 | 0.000156 | 1 | 0 | 22 | 0 | 3042 | | | 26 <> 28 | 0.000000 | 1 | 0 | 19 | 1 | 152 | | | 28 <> 30 | 0.001498 | 1 | 0 | 24 | 0 | 5615 | | | 30 <> 32 | 0.000235 | 0 | 0 | 44 | 0 | 1880 | |
分析丢包、duplicate ack
$ tshark -r retrans.cap -q -z io,stat,5,”COUNT(tcp.analysis.retransmission) tcp.analysis.retransmission”,”COUNT(tcp.analysis.fast_retransmission) tcp.analysis.fast_retransmission”,”COUNT(tcp.analysis.duplicate_ack) tcp.analysis.duplicate_ack”,”COUNT(tcp.analysis.lost_segment) tcp.analysis.lost_segment”
1 2 3 4 5 6 7 8 9 10 11 12 13 14 15 16 17 18 19 20 21 22 23 24 25 26 27 28 29 30 31 32 33 =================================================================================== | IO Statistics | | | | Duration: 89.892365 secs | | Interval: 5 secs | | | | Col 1: COUNT(tcp.analysis.retransmission) tcp.analysis.retransmission | | 2: COUNT(tcp.analysis.fast_retransmission) tcp.analysis.fast_retransmission | | 3: COUNT(tcp.analysis.duplicate_ack) tcp.analysis.duplicate_ack | | 4: COUNT(tcp.analysis.lost_segment) tcp.analysis.lost_segment | |---------------------------------------------------------------------------------| | |1 |2 |3 |4 | | | Interval | COUNT | COUNT | COUNT | COUNT | | |------------------------------------------| | | 0 <> 5 | 0 | 0 | 0 | 1 | | | 5 <> 10 | 0 | 0 | 0 | 0 | | | 10 <> 15 | 0 | 0 | 0 | 4 | | | 15 <> 20 | 0 | 0 | 0 | 5 | | | 20 <> 25 | 3 | 0 | 67 | 2 | | | 25 <> 30 | 2 | 0 | 58 | 1 | | | 30 <> 35 | 0 | 0 | 112 | 0 | | | 35 <> 40 | 1 | 0 | 156 | 0 | | | 40 <> 45 | 0 | 0 | 127 | 2 | | | 45 <> 50 | 1 | 0 | 91 | 0 | | | 50 <> 55 | 0 | 0 | 63 | 0 | | | 55 <> 60 | 0 | 0 | 65 | 2 | | | 60 <> 65 | 2 | 0 | 41 | 0 | | | 65 <> 70 | 3 | 0 | 34 | 2 | | | 70 <> 75 | 7 | 0 | 55 | 0 | | | 75 <> 80 | 3 | 0 | 68 | 0 | | | 80 <> 85 | 1 | 0 | 46 | 0 | | | 85 <> Dur| 0 | 0 | 30 | 0 | | ===================================================================================
分析rtt 时间
$ tshark -r ~/ali/metrics/tcpdump/rsb2.cap -q -z io,stat,1,”MIN(tcp.analysis.ack_rtt)tcp.analysis.ack_rtt”,”MAX(tcp.analysis.ack_rtt)tcp.analysis.ack_rtt”,”AVG(tcp.analysis.ack_rtt)tcp.analysis.ack_rtt”
1 2 3 4 5 6 7 8 9 10 11 12 13 14 15 16 17 18 19 20 21 22 23 24 25 26 27 28 29 30 31 32 33 34 35 36 37 38 39 40 41 42 43 44 45 46 47 48 ======================================================== | IO Statistics | | | | Duration: 33.914454 secs | | Interval: 1 secs | | | | Col 1: MIN(tcp.analysis.ack_rtt)tcp.analysis.ack_rtt | | 2: MAX(tcp.analysis.ack_rtt)tcp.analysis.ack_rtt | | 3: AVG(tcp.analysis.ack_rtt)tcp.analysis.ack_rtt | |------------------------------------------------------| | |1 |2 |3 | | | Interval | MIN | MAX | AVG | | |-------------------------------------------| | | 0 <> 1 | 0.000005 | 0.248840 | 0.009615 | | | 1 <> 2 | 0.000004 | 0.458952 | 0.009601 | | | 2 <> 3 | 0.000002 | 0.251274 | 0.009340 | | | 3 <> 4 | 0.000006 | 0.290993 | 0.010843 | | | 4 <> 5 | 0.000004 | 0.390800 | 0.008995 | | | 5 <> 6 | 0.000008 | 0.407525 | 0.011133 | | | 6 <> 7 | 0.000004 | 0.239225 | 0.008763 | | | 7 <> 8 | 0.000003 | 0.177203 | 0.009211 | | | 8 <> 9 | 0.000007 | 0.265505 | 0.010294 | | | 9 <> 10 | 0.000007 | 0.354278 | 0.008475 | | | 10 <> 11 | 0.000005 | 5.337388 | 0.011211 | | | 11 <> 12 | 0.000004 | 0.320651 | 0.008231 | | | 12 <> 13 | 0.000008 | 0.272029 | 0.008526 | | | 13 <> 14 | 0.000005 | 0.663421 | 0.014589 | | | 14 <> 15 | 0.000005 | 0.277754 | 0.009128 | | | 15 <> 16 | 0.000002 | 0.260320 | 0.010388 | | | 16 <> 17 | 0.000006 | 0.429298 | 0.009155 | | | 17 <> 18 | 0.000005 | 0.668089 | 0.010008 | | | 18 <> 19 | 0.000005 | 0.452897 | 0.009574 | | | 19 <> 20 | 0.000006 | 0.850698 | 0.010345 | | | 20 <> 21 | 0.000007 | 0.270671 | 0.012368 | | | 21 <> 22 | 0.000005 | 0.295439 | 0.008660 | | | 22 <> 23 | 0.000008 | 0.710938 | 0.010321 | | | 23 <> 24 | 0.000003 | 0.269014 | 0.010238 | | | 24 <> 25 | 0.000005 | 0.287966 | 0.009604 | | | 25 <> 26 | 0.000009 | 0.661160 | 0.010807 | | | 26 <> 27 | 0.000006 | 0.310515 | 0.009439 | | | 27 <> 28 | 0.000003 | 0.346298 | 0.011302 | | | 28 <> 29 | 0.000004 | 0.375117 | 0.008333 | | | 29 <> 30 | 0.000006 | 1.323647 | 0.008799 | | | 30 <> 31 | 0.000006 | 0.283616 | 0.010187 | | | 31 <> 32 | 0.000007 | 0.649273 | 0.008613 | | | 32 <> 33 | 0.000004 | 0.440265 | 0.010663 | | | 33 <> Dur| 0.000004 | 0.337023 | 0.011477 | | ========================================================
计算window size
$ tshark -r rsb-single2.cap -q -z io,stat,5,”COUNT(tcp.analysis.retransmission) tcp.analysis.retransmission”,”AVG(tcp.window_size) tcp.window_size”,”MAX(tcp.window_size) tcp.window_size”,”MIN(tcp.window_size) tcp.window_size”
1 2 3 4 5 6 7 8 9 10 11 12 13 14 15 16 17 18 19 20 21 22 ========================================================================= | IO Statistics | | | | Duration: 30.776061 secs | | Interval: 5 secs | | | | Col 1: COUNT(tcp.analysis.retransmission) tcp.analysis.retransmission | | 2: AVG(tcp.window_size) tcp.window_size | | 3: MAX(tcp.window_size) tcp.window_size | | 4: MIN(tcp.window_size) tcp.window_size | |-----------------------------------------------------------------------| | |1 |2 |3 |4 | | | Interval | COUNT | AVG | MAX | MIN | | |------------------------------------------| | | 0 <> 5 | 0 | 4753 | 15744 | 96 | | | 5 <> 10 | 0 | 8067 | 431616 | 96 | | | 10 <> 15 | 0 | 5144 | 18688 | 96 | | | 15 <> 20 | 0 | 11225 | 611072 | 81 | | | 20 <> 25 | 0 | 5104 | 24448 | 96 | | | 25 <> 30 | 0 | 10103 | 506880 | 96 | | | 30 <> Dur| 0 | 5716 | 12423 | 96 | | =========================================================================
有用的命令(这些命令也都是安装WireShark就装好了的):
capinfos rsb2.cap
tshark -q -n -r rsb2.cap -z “conv,ip” 分析流量总况
tshark -q -n -r rsb2.cap -z “conv,tcp” 分析每一个连接的流量、rtt、响应时间、丢包率、重传率等等
editcap -c 100000 ./rsb2.cap rsb00.cap //把大文件rsb2.cap按每个文件100000个package切成小文件
常用排错过滤条件: 对于排查网络延时/应用问题有一些过滤条件是非常有用的:
tcp.analysis.lost_segment:表明已经在抓包中看到不连续的序列号。报文丢失会造成重复的ACK,这会导致重传。
tcp.analysis.duplicate_ack:显示被确认过不止一次的报文。大量的重复ACK是TCP端点之间高延时的迹象。
tcp.analysis.retransmission:显示抓包中的所有重传。如果重传次数不多的话还是正常的,过多重传可能有问题。这通常意味着应用性能缓慢和/或用户报文丢失。
tcp.analysis.window_update:将传输过程中的TCP window大小图形化。如果看到窗口大小下降为零,这意味着发送方已经退出了,并等待接收方确认所有已传送数据。这可能表明接收端已经不堪重负了。
tcp.analysis.bytes_in_flight:某一时间点网络上未确认字节数。未确认字节数不能超过你的TCP窗口大小(定义于最初3此TCP握手),为了最大化吞吐量你想要获得尽可能接近TCP窗口大小。如果看到连续低于TCP窗口大小,可能意味着报文丢失或路径上其他影响吞吐量的问题。
tcp.analysis.ack_rtt:衡量抓取的TCP报文与相应的ACK。如果这一时间间隔比较长那可能表示某种类型的网络延时(报文丢失,拥塞,等等)。
抓包常用命令 1 2 3 4 5 6 7 8 9 10 11 12 13 14 15 16 17 18 19 20 21 22 23 24 25 26 27 28 29 30 #tshark 解析MySQL协议 tshark -r ./mysql-compress.cap -o tcp.calculate_timestamps:true -T fields -e mysql.caps.cp -e frame.number -e frame.time_epoch -e frame.time_delta_displayed -e ip.src -e tcp.srcport -e tcp.dstport -e ip.dst -e tcp.time_delta -e frame.time_delta_displayed -e tcp.stream -e tcp.len -e mysql.query #用tcpdump抓取并保存包: sudo tcpdump -i eth0 port 3306 -w drds.cap #每隔3秒钟生成一个新文件,总共生成5个文件后(15秒后)终止抓包,然后包名也按时间规范好了 sudo tcpdump -t -s 0 tcp port 3306 -w 'dump_%Y-%m-%d_%H:%M:%S.pcap' -G 3 -W 5 -Z root #每隔30分钟��成一个包并压缩 nohup sudo tcpdump -i eth0 -t -s 0 tcp and port 3306 -w 'dump_%Y-%m-%d_%H:%M:%S.pcap' -G 1800 -W 48 -Zroot -z gzip & #file size 1000M nohup sudo tcpdump -i eth0 -t -s 0 tcp and port 3306 -w 'dump_' -C 1000 -W 300 -Z root -z gzip & #抓取详细SQL语句, 快速确认client发过来的具体SQL内容: sudo tshark -i any -f 'port 8527' -s 0 -l -w - |strings sudo tshark -i eth0 -d tcp.port==3306,mysql -T fields -e mysql.query 'port 3306' sudo tshark -i eth0 -R "ip.addr==11.163.182.137" -d tcp.port==3306,mysql -T fields -e mysql.query 'port 3306' sudo tshark -i eth0 -R "tcp.srcport==62877" -d tcp.port==3001,mysql -T fields -e tcp.srcport -e mysql.query 'port 3001' #如果RDS开启了SSL,那么抓包后的内容tshark/wireshark分析不到MySQL的具体内容,可以强制关闭:connectionProperties里加上useSSL=false tshark -r ./manager.cap -o tcp.calculate_timestamps:true -Y " tcp.analysis.retransmission " -T fields-e tcp.stream -e frame.number -e frame.time -e ip.src -e tcp.srcport -e tcp.dstport -e ip.dst | sort #分析MySQL rt,倒数第四列基本就是rt tshark -r gege_drds.pcap -Y " ((tcp.srcport eq 3306 ) and tcp.len>0 )" -o tcp.calculate_timestamps:true -T fields -e frame.number -e frame.time_epoch -e frame.time_delta_displayed -e ip.src -e tcp.srcport -e tcp.dstport -e ip.dst -e tcp.time_delta -e tcp.stream -e tcp.len -e tcp.analysis.ack_rtt #或者排序一下 tshark -r 213_php.cap -Y "mysql.query or ( tcp.srcport==3306)" -o tcp.calculate_timestamps:true -T fields -e frame.number -e frame.time_epoch -e frame.time_delta_displayed -e ip.src -e tcp.srcport -e tcp.dstport -e ip.dst -e tcp.time_delta -e tcp.stream -e tcp.len -e mysql.query |sort -nk9 -nk1
Wireshark 插件安装 1 2 3 4 5 6 7 8 9 插件是使用lua开发的,安装比较简单,以OS X平台为例: 1. 将协议解析脚本copy到/Applications/Wireshark.app/Contents/Resources/share/wireshark/ 目录 2. 编辑init.lua文件,设置disable_lua = false,确保lua支持打开 3. 在init.lua文件末尾增加 dofile("hsf2.lua") 再次启动Wireshark,会对12200端口的数据流使用脚本解析,已经可以识别HSF协议了。 补充下Windows平台下的安装,步骤类似,将hsf2.lua拷贝到wireshark的根目录,例如c:\Program Files\Wireshark\,在这个目录下也有init.lua,然后参照上面的步骤2和3。
一个案例
问题:客户现场不管怎么样增加应用机器,tps就是上不去,同时增加机器后,增加的机器CPU还都能被用完,但是tps没有变化(这点比较奇怪) 整体服务调用慢,数据库没有慢查询,不知道到具体时间花在哪里,各个环节都尝试过增加服务器(或提升配置),但是问题一直得不到解决
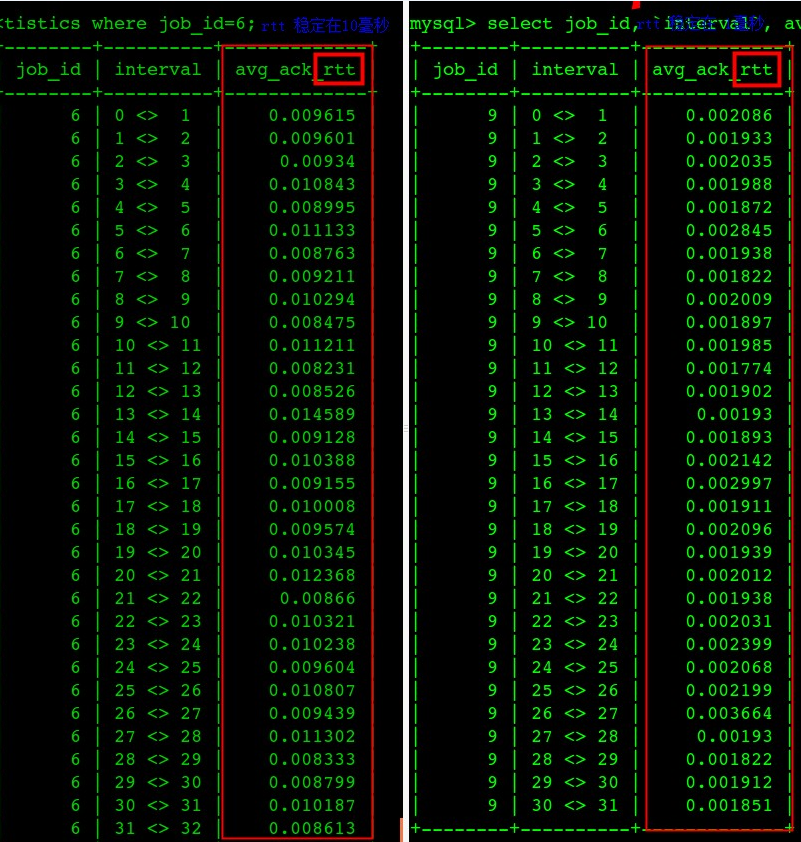
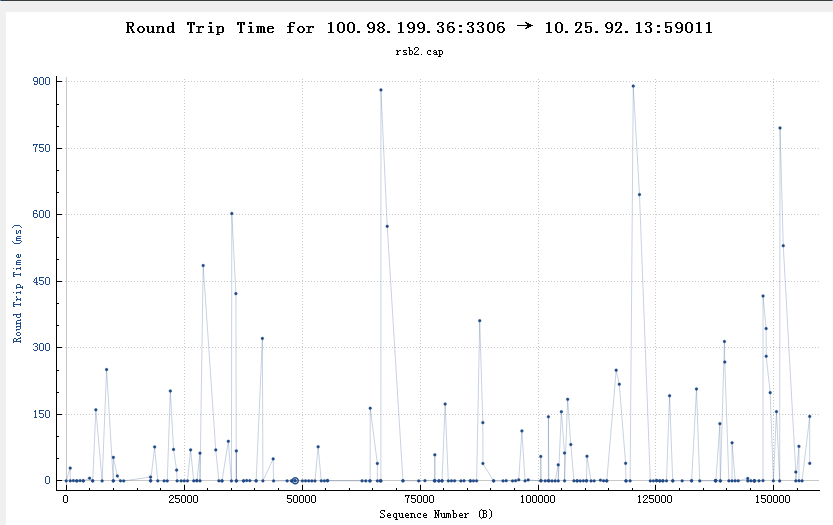
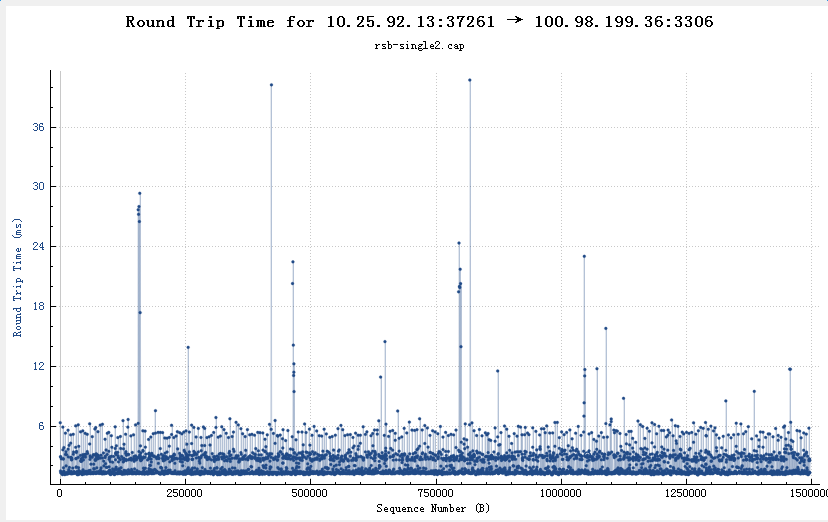
tshark分析抓包文件数据库服务器网卡中断瓶颈导致rtt非常高,进一步导致每个Query的ResponseTime非常高(图中左边都是出问题、右边都是问题解决后的响应时间)
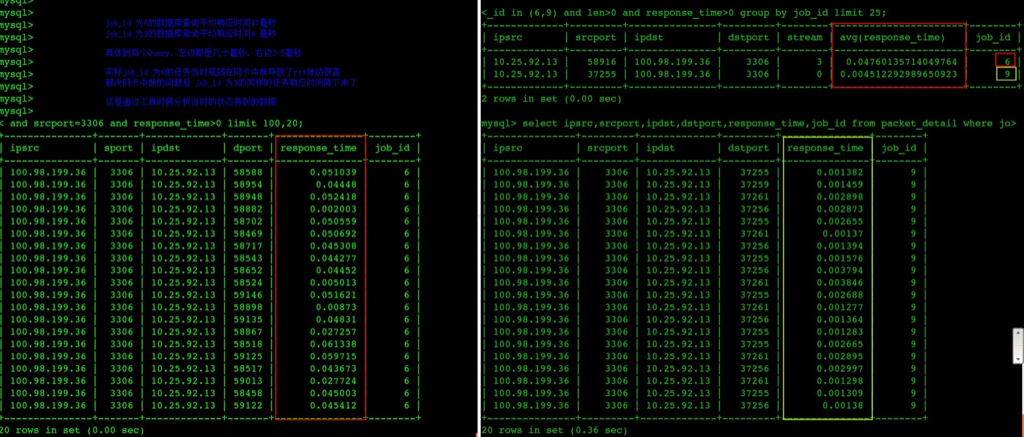
下面两个图是吧tshark解析结果丢到了数据库中好用SQL可以进一步分析
** 问题修复后数据库每个查询的平均响应时间从47毫秒下降到了4.5毫秒 **
从wireshark中也可以看到类似的rtt不正常(超过150ms的比较多)
从wireshark中也可以看到类似的rtt正常(99%都在10ms以内)
tcprstat 推荐一个快速统计rt的工具tcprstat ,实测在CPU打满的高压力情况下会丢失大量请求数据,但是作为统计平均值这问题不大。支持http、mysql协议等。实际测试在每秒2万个SQL的时候,对于一台4C的机器,只能采集到70%的请求。
或者看这个支持设置RT阈值的统计改进版
tcprstat 统计抓包离线文件
1
2
3
4
5
# -l 166.100.128.148 向目标端口80发起请求的地址 # -p 80 发出response端口 # -t 10 间隔10s一次汇总统计 # -f 后面的分位置可以随便指定(90%、95%、99%等) tcprstat -r pts.pcap -p 80 -l 166.100.128.148 -t 10 -f "%T\t%n\t%M\t%m\t%a\t%h\t%S\t%95M\t%90a\t%95S\t%99M\t%99a\t%90S\n"
其它工具 packetdrill https://github.com/google/packetdrill
https://mp.weixin.qq.com/s/CcM3rINPn54Oean144kvMw
http://beta.computer-networking.info/syllabus/default/exercises/tcp-2.html
https://segmentfault.com/a/1190000019193928