ssd/san/sas/磁盘/光纤性能比较
ssd/san/sas/磁盘/光纤/RAID性能比较
本文汇总HDD、SSD、SAN、LVM、软RAID等一些性能数据
性能比较
正好有机会用到一个san存储设备,跑了一把性能数据,记录一下
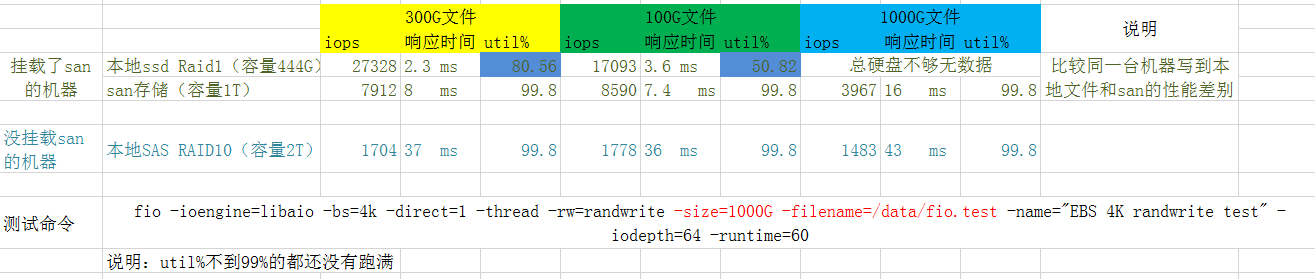
所使用的测试命令:
1 | fio -ioengine=libaio -bs=4k -direct=1 -thread -rw=randwrite -size=1000G -filename=/data/fio.test -name="EBS 4K randwrite test" -iodepth=64 -runtime=60 |
ssd(Solid State Drive)和san的比较是在同一台物理机上,所以排除了其他因素的干扰。
简要的结论:
本地ssd性能最好、sas机械盘(RAID10)性能最差
san存储走特定的光纤网络,不是走tcp的san(至少从网卡看不到san的流量),性能居中
从rt来看 ssd:san:sas 大概是 1:3:15
san比本地sas机械盘性能要好,这也许取决于san的网络传输性能和san存储中的设备(比如用的ssd而不是机械盘)
NVMe SSD 和 HDD的性能比较
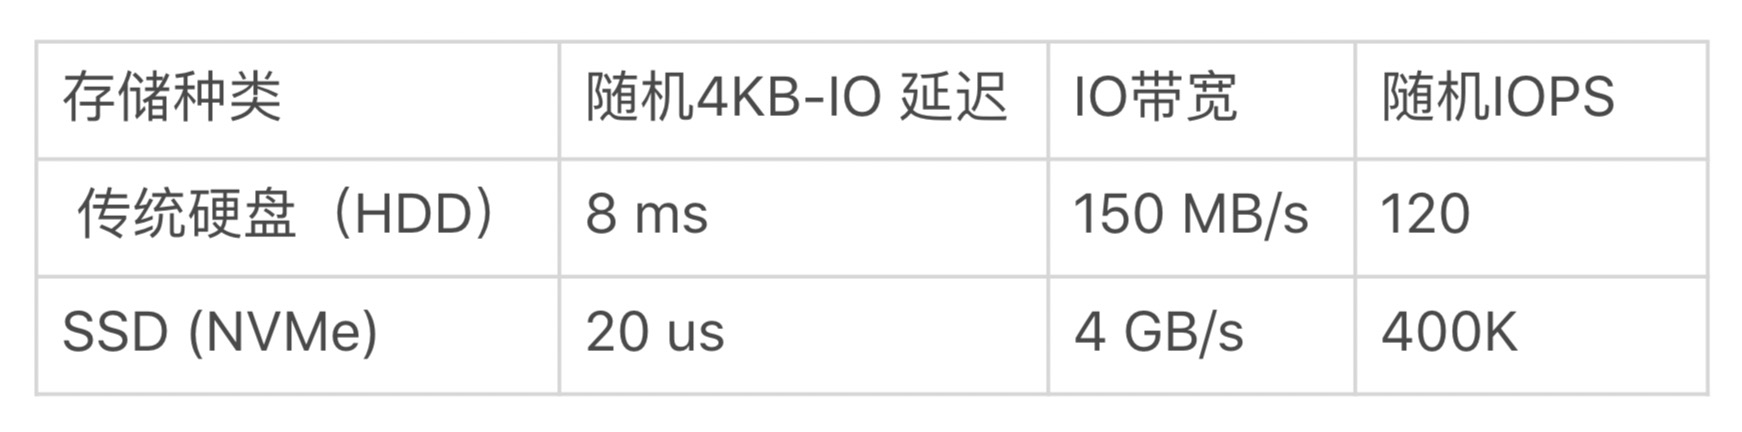
表中性能差异比上面测试还要大,SSD 的随机 IO 延迟比传统硬盘快百倍以上,一般在微妙级别;IO 带宽也高很多倍,可以达到每秒几个 GB;随机 IOPS 更是快了上千倍,可以达到几十万。
HDD只有一个磁头,并发没有意义,但是SSD支持高并发写入读取。SSD没有磁头、不需要旋转,所以随机读取和顺序读取基本没有差别。
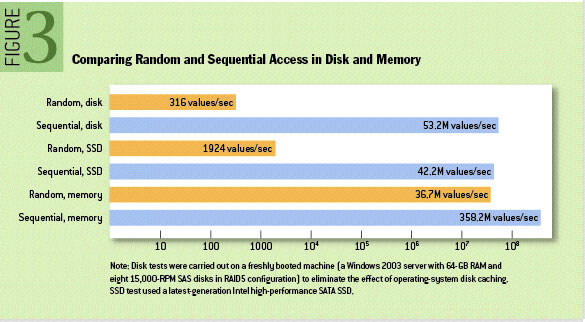
从上图可以看出如果是随机读写HDD性能极差,但是如果是顺序读写HDD和SDD、内存差异就不那么大了。
磁盘类型查看
1 | $cat /sys/block/vda/queue/rotational //但是对于虚拟机就不一定对 |
fio测试
以下是两块测试的SSD磁盘测试前的基本情况
1 | /dev/sda 240.06G SSD_SATA //sata |
NVMe SSD测试数据
对一块ssd进行如下测试(挂载在 /data 目录 libaio 会导致测数据好几倍,可以去掉对比一下,去掉后更像 MySQL innodb 的场景 )
1 | fio -ioengine=libaio -bs=4k -direct=1 -thread -rw=randwrite -rwmixread=70 -size=16G -filename=./fio.test -name="EBS 4K randwrite test" -iodepth=64 -runtime=60 |
如上测试iops为:18944,测试期间的iostat,测试中一直有mysql在导入数据,所以测试开始前util就已经100%了,并且w/s到了13K左右
1 | # iostat -d sfdv0n1 3 -x |
从iostat看出,测试开始前util已经100%(因为ssd,util失去参考意义),w/s 13K左右,压力跑起来后w/s能到30K,svctm、await均保持稳定
如下测试中direct=1和direct=0的write avg iops分别为42K、16K
1 | # fio -ioengine=libaio -bs=4k -direct=1 -buffered=0 -thread -rw=randrw -rwmixread=70 -size=16G -filename=/data/fio.test -name="EBS 4K randwrite test" -iodepth=64 -runtime=60 |
SATA SSD测试数据
1 | # cat /sys/block/sda/queue/rotational |
-direct=0 -buffered=0读写iops分别为15.8K、6.8K 比ssd差了不少(都是direct=0),如果direct、buffered都是1的话,ESSD性能很差,读写iops分别为4312、1852
1 | # fio -ioengine=libaio -bs=4k -direct=0 -buffered=0 -thread -rw=randrw -rwmixread=70 -size=2G -filename=/var/lib/docker/fio.test -name="EBS 4K randwrite test" -iodepth=64 -runtime=60 |
ESSD磁盘测试数据
这是一块虚拟的阿里云网络盘,不能算完整意义的SSD(承诺IOPS 4200),数据仅供参考,磁盘概况:
1 | $df -lh |
测试数据:
1 | $fio -ioengine=libaio -bs=4k -direct=1 -buffered=1 -thread -rw=randrw -size=4G -filename=/home/admin/fio.test -name="EBS 4K randwrite test" -iodepth=64 -runtime=60 |
各类型云盘的性能比较如下表所示。
| 性能类别 | ESSD AutoPL云盘(邀测) | ESSD PL-X云盘(邀测) | ESSD云盘 PL3 | ESSD云盘 PL0 | ESSD云盘 PL1 | ESSD云盘 PL0 | SSD云盘 | 高效云盘 | 普通云盘 |
|---|---|---|---|---|---|---|---|---|---|
| 单盘容量范围(GiB) | 40~32,768 | 40~32,768 | 1261~32,768 | 461~32,768 | 20~32,768 | 40~32,768 | 20~32,768 | 20~32,768 | 5~2,000 |
| 最大IOPS | 100,000 | 3,000,000 | 1,000,000 | 100,000 | 50,000 | 10,000 | 25,000 | 5,000 | 数百 |
| 最大吞吐量(MB/s) | 1,131 | 12,288 | 4,000 | 750 | 350 | 180 | 300 | 140 | 30~40 |
| 单盘IOPS性能计算公式 | min{1,800+50*容量, 50,000} | 预配置IOPS | min{1,800+50*容量, 1,000,000} | min{1,800+50*容量, 100,000} | min{1,800+50*容量, 50,000} | min{ 1,800+12*容量, 10,000 } | min{1,800+30*容量, 25,000} | min{1,800+8*容量, 5,000} | 无 |
| 单盘吞吐量性能计算公式(MB/s) | min{120+0.5*容量, 350} | 4 KB*预配置IOPS/1024 | min{120+0.5*容量, 4,000} | min{120+0.5*容量, 750} | min{120+0.5*容量, 350} | min{100+0.25*容量, 180} | min{120+0.5*容量, 300} | min{100+0.15*容量, 140} | 无 |
| 单路随机写平均时延(ms),Block Size=4K | 0.2 | 0.03 | 0.2 | 0.2 | 0.2 | 0.3~0.5 | 0.5~2 | 1~3 | 5~10 |
| API参数取值 | cloud_auto | cloud_plx | cloud_essd | cloud_essd | cloud_essd | cloud_essd | cloud_ssd | cloud_efficiency | cloud |
ESSD(PL3) 测试
阿里云ESSD(Enhanced SSD)云盘结合25 GE网络和RDMA技术,为您提供单盘高达100万的随机读写能力和单路低时延性能。本文介绍了ESSD云盘的性能级别、适用场景及性能上限,提供了选择不同ESSD云盘性能级别时的参考信息。
测试结论:读能力非常差(不到写的10%),写能力能符合官方标称的IOPS,但是写IOPS抖动极大,会长时间IOPS 跌0,但最终IOPS还是会达到目标IOPS。
测试命令
1 | fio -ioengine=libaio -bs=4k -buffered=1 -thread -rw=randwrite -rwmixread=70 -size=160G -filename=./fio.test -name="EBS 4K randwrite test" -iodepth=64 -runtime=60 |
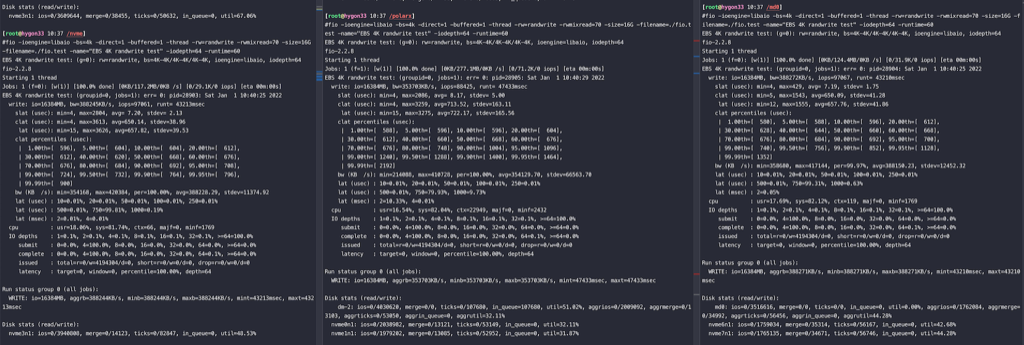
ESSD 是aliyun 购买的 ESSD PL3,LVM是海光物理机下两块本地NVMe SSD做的LVM,测试基于ext4文件系统,阿里云官方提供ESSD的 IOPS 性能数据是裸盘(不含文件系统的)
| 本地LVM | ESSD PL3 | PL2+倚天 | |
|---|---|---|---|
| fio -ioengine=libaio -bs=4k -buffered=1 read | bw=36636KB/s, iops=9159 nvme0n1:util=42.31% nvme1n1: util=41.63% |
IOPS=3647, BW=14.2MiB/s util=88.08% |
IOPS=458k, BW=1789MiB/s util=96.69% |
| fio -ioengine=libaio -bs=4k -buffered=1 randwrite | bw=383626KB/s, iops=95906 nvme0n1:util=37.16% nvme1n1: util=33.58% |
IOPS=104k, BW=406MiB/s util=39.06% |
IOPS=37.4k, BW=146MiB/s util=94.03% |
| fio -ioengine=libaio -bs=4k -buffered=1 randrw rwmixread=70 | write: bw=12765KB/s, iops=3191 read : bw=29766KB/s, iops=7441 nvme0n1:util=35.18% nvme1n1: util=35.04% |
write:IOPS=1701, BW=6808KiB/s read: IOPS=3962, BW=15.5MiB/s nvme7n1: util=99.35% |
write:IOPS=1826, BW=7306KiB/s read:IOPS=4254, BW=16.6MiB/s util=98.99% |
| fio -ioengine=libaio -bs=4k -direct=1 -buffered=0 read | bw=67938KB/s, iops=16984 nvme0n1:util=43.17% nvme1n1: util=39.18% |
IOPS=4687, BW=18.3MiB/s util=99.75% |
read: IOPS=145k, BW=565MiB/s util=98.88% |
| fio -ioengine=libaio -bs=4k -direct=1 -buffered=0 write | bw=160775KB/s, iops=40193 nvme0n1:util=28.66% nvme1n1: util=21.67% |
IOPS=7153, BW=27.9MiB/s util=99.85% |
write: IOPS=98.0k, BW=387MiB/s util=99.88% |
| fio -ioengine=libaio -bs=4k -direct=1 -buffered=0 randrw rwmixread=70 | write: bw=23087KB/s, iops=5771 read : bw=53849KB/s, iops=13462 |
write:IOPS=1511, BW=6045KiB/s read: IOPS=3534, BW=13.8MiB/s |
write: IOPS=29.4k, BW=115MiB/s read: IOPS=68.6k, BW=268MiB/s util=99.88% |
结论:
- ESSD只要有随机读性能就很差,纯读是本地盘(LVM)的40%,纯写和本地盘差不多
- direct 读是本地盘的四分之一
- direct 写是本地盘的六分之一,写16K Page差距缩小到五分之一(5749/25817)
- intel direct 写本地intel SSDPE2KX040T8 iops=55826(比海光好40%,海光是memblaze)
- ESSD 带 buffer 读写抖动很大
- ESSD 出现过多次卡死,表现就是磁盘不响应任何操作,大概N分钟后恢复,原因未知
PL3单盘IOPS性能计算公式 min{1800+50*容量, 1000000}
1 | [essd_pl3]# fio -ioengine=libaio -bs=4k -direct=1 -buffered=1 -thread -rw=randwrite -rwmixread=70 -size=160G -filename=./fio.test -name="EBS 4K randwrite test" -iodepth=64 -runtime=60 |
倚天 PL3 VS SSD
测试环境倚天裸金属,4.18 CentOS fio-3.7
| 类型 | 参数 | nvme SSD单盘 | PL3+倚天裸金属 |
|---|---|---|---|
| randread | fio -bs=4k -buffered=1 | IOPS=17.7K | IOPS=2533 |
| randread | fio -ioengine=libaio -bs=4k -direct=1 -buffered=0 | IOPS=269k | IOPS=24k |
| randwrite | fio -bs=4k -direct=1 -buffered=0 | IOPS=68.5k | IOPS=3275 |
| randwrite | fio -ioengine=libaio -bs=4k -buffered=1 | IOPS=253k | IOPS=250k |
| randrw | fio -ioengine=libaio -bs=4k -buffered=1 rwmixread=70 | write:IOPS=8815, read:IOPS=20.5K | write:IOPS=1059,read:IOPS=2482 |
| randrw | fio -ioengine=libaio -bs=4k -direct=1 -buffered=0 rwmixread=70 | write:IOPS=8754, read: IOPS=20.4K | write: IOPS=940, read: IOPS=2212 |
测试命令
1 | fio -ioengine=libaio -bs=4k -buffered=1 -thread -rw=randrw -rwmixread=70 -size=16G -filename=./fio.test -name="essd-pl3" -iodepth=64 -runtime=30 |
HDD性能测试数据
1 | $sudo fio -iodepth=10 -ioengine=libaio -direct=1 -rw=randread -bs=32k -size=1G -numjobs=1 -runtime=60 -group_reporting -filename=./io.test -name=Read_Testing |
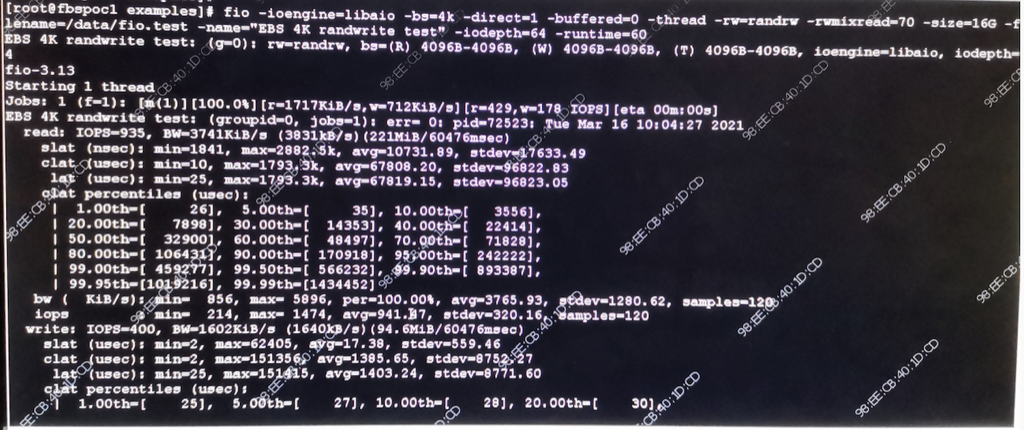
从上图可以看到这个磁盘的IOPS 读 935 写 400,读rt 10731nsec 大约10us, 写 17us。如果IOPS是1000的话,rt应该是1ms,实际比1ms小两个数量级,应该是cache、磁盘阵列在起作用。
SATA硬盘,10K转
万转机械硬盘组成RAID5阵列,在顺序条件最好的情况下,带宽可以达到1GB/s以上,平均延时也非常低,最低只有20多us。但是在随机IO的情况下,机械硬盘的短板就充分暴露了,零点几兆的带宽,将近5ms的延迟,IOPS只有200左右。其原因是因为
- 随机访问直接让RAID卡缓存成了个摆设
- 磁盘不能并行工作,因为我的机器RAID宽度Strip Size为128 KB
- 机械轴也得在各个磁道之间跳来跳去。
理解了磁盘顺序IO时候的几十M甚至一个GB的带宽,随机IO这个真的是太可怜了。
从上面的测试数据中我们看到了机械硬盘在顺序IO和随机IO下的巨大性能差异。在顺序IO情况下,磁盘是最擅长的顺序IO,再加上Raid卡缓存命中率也高。这时带宽表现有几十、几百M,最好条件下甚至能达到1GB。IOPS这时候能有2-3W左右。到了随机IO的情形下,机械轴也被逼的跳来跳去寻道,RAID卡缓存也失效了。带宽跌到了1MB以下,最低只有100K,IOPS也只有可怜巴巴的200左右。
开关 libaio 对比
启用和禁用 libaio 进行对比,尤其要注意 libaio 要配合 -iodepth=N 使用才能发挥作用
MySQL 8.0 里 innodb_parallel_read_threads 默认是开 4 个线程并行读,这就很像 libaio+iodepth 了
1 | #fio -ioengine=libaio -direct=1 -iodepth=32 -rw=randread -bs=32k -size=16G -numjobs=1 -runtime=200 -group_reporting -filename=/polarx/ren.test -name=Read_Testing |
查看 SSD 的队列数:
1 | #cat /sys/block/nvme0n1/queue/nr_requests |
innodb_parallel_read_threads
加大 innodb_parallel_read_threads 可以看到 count(*) 的速度能和 innodb_parallel_read_threads 匹配增加
1 | //set global innodb_parallel_read_threads=16 |
从上面可以看到一个线程去读的时候 iops 是 4000, 如果 16 个线程并发去读 iops 就是 48000,count 速度也提升了 16 倍
下图是 innodb_parallel_read_threads=4 时的 iotop,可以看到单线程读上限就是 52M 左右,相较 1 的时候 count(*) 的性能正好翻了 4 倍
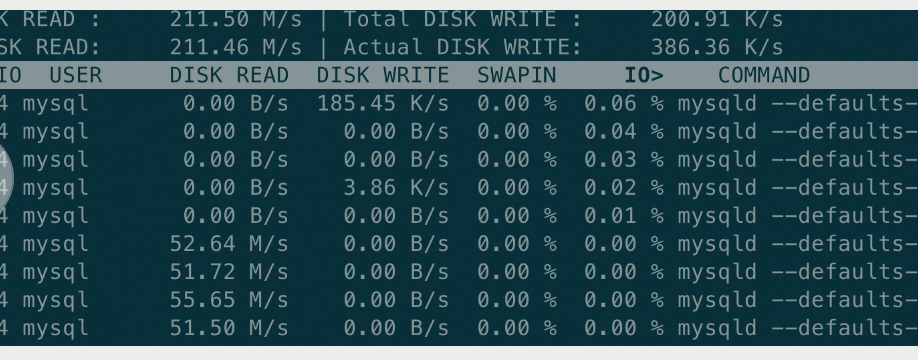
nvme SSD 的吞吐
1 | //iodepth=1 时 iops 7324,吞吐 117M |
之所以有这么大的差异,是靠 SSD 的多队列,也就是业务层面也要支持多线程同时读写才能发挥出 SSD 的多队列能力,也和目标文件大小相关
从数据上看 %util 对 SSD 参考意义不大,但是 %util 越大越是触摸到 IO 瓶颈了,比如看到 util% 到了 50% 不代表 IO 用到一半了, 50% 代表 1 秒中内有 0.5 秒 SSD 的所有队列都是空闲的
测试数据总结
| -direct=1 -buffered=1 | -direct=0 -buffered=1 | -direct=1 -buffered=0 | -direct=0 -buffered=0 | |
|---|---|---|---|---|
| NVMe SSD | R=10.6k W=4544 | R=10.8K W=4642 | R=99.8K W=42.8K | R=38.6k W=16.5k |
| SATA SSD | R=4312 W=1852 | R=5389 W=2314 | R=16.9k W=7254 | R=15.8k W=6803 |
| ESSD | R=2149 W=2150 | R=1987 W=1984 | R=2462 W=2465 | R=2455 W=2458 |
看起来,对于SSD如果buffered为1的话direct没啥用,如果buffered为0那么direct为1性能要好很多
SATA SSD的IOPS比NVMe性能差很多。
SATA SSD当-buffered=1参数下SATA SSD的latency在7-10us之间。
NVMe SSD以及SATA SSD当buffered=0的条件下latency均为2-3us, NVMe SSD latency参考文章第一个表格, 和本次NVMe测试结果一致.
ESSD的latency基本是13-16us。
以上NVMe SSD测试数据是在测试过程中还有mysql在全力导入数据的情况下,用fio测试所得。所以空闲情况下测试结果会更好。
网上测试数据参考
我们来一起看一下具体的数据。首先来看NVMe如何减小了协议栈本身的时间消耗,我们用blktrace工具来分析一组传输在应用程序层、操作系统层、驱动层和硬件层消耗的时间和占比,来了解AHCI和NVMe协议的性能区别:
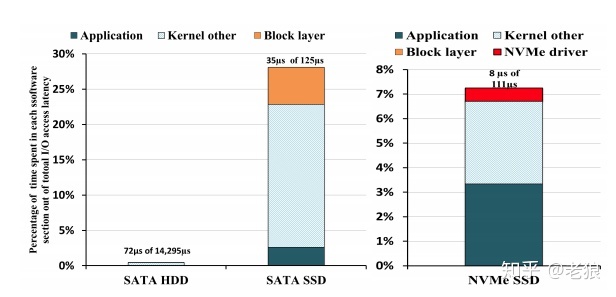
硬盘HDD作为一个参考基准,它的时延是非常大的,达到14ms,而AHCI SATA为125us,NVMe为111us。我们从图中可以看出,NVMe相对AHCI,协议栈及之下所占用的时间比重明显减小,应用程序层面等待的时间占比很高,这是因为SSD物理硬盘速度不够快,导致应用空转。NVMe也为将来Optane硬盘这种低延迟介质的速度提高留下了广阔的空间。
对比LVM 、RAID0和 一块NVMe SSD
曙光H620-G30A机型下测试
各拿两块nvme,分别作LVM和RAID0,另外单独拿一块nvme直接读写,条带用的是4块nvme做的,然后比较顺序、随机读写,测试结果如下:
注意:这里的 LVM 使用的是默认的线性模式(linear),即数据先写满第一块盘再写第二块盘,并非条带模式。因此 LVM 列的数据本质上反映的是”单盘性能 + LVM 软件开销”,不能用来说明”两块盘组 LVM 性能差”。如果用
lvcreate --stripes 2 --stripesize 64k创建条带化 LVM,性能应接近 RAID0。测试方法学勘误(2026 补注,下面结论和数据需要结合这几条一起看):
-direct=1 -buffered=1同时给是矛盾参数。fio 文档明确写buffered是direct的反面(direct=1即O_DIRECT,绕过 page cache;buffered=1即走 page cache),二者互斥。同时给时以direct=1生效,buffered=1被静默忽略。所以本节表格里凡是-direct=1 -buffered=1那一行,实际跑的是 O_DIRECT 路径,”开 buffer 性能翻倍”的结论站不住——它和下面direct=1 -buffered=0那一行其实是同一种模式,数值差异是其他扰动(如测试顺序、盘 GC 状态)导致的。想真的对比 buffered vs direct,命令里应该只给-direct=0(走 page cache)或-direct=1(绕过),不要同时写 buffered。
-rw=randwrite -rwmixread=70的rwmixread被静默忽略。fio 里rwmixread只在rw=randrw / rw=rw(读写混合)时生效,rw=randwrite是纯写,70% 读的语义根本没进入测试,实际全程是 100% 随机写。这也解释了为什么后文出现”SSD 随机读 IOPS 大概是随机写的 10%”的反常结论——根本没测读,看到的只是 fio 在randwrite模式下报的空读计数,不是盘的真实读性能。想测 7:3 混合读写应该写成-rw=randrw -rwmixread=70。单线程 + 单核绑定导致”加盘没加速”是测试方法问题,不是 RAID 软件的问题。本节所有 fio 都是
numjobs=1(单线程 submit),dd 还额外taskset -c 16绑单核。mdraid 把请求按 chunk 切到多盘后需要并发 submit,单线程在内核里只能串行下发,瓶颈压在 CPU 一个核上,自然跑不出多盘红利。证据就在 iostat 里——4 盘 RAID0 下每块盘 util 只有 ~9-20%,还有 4-10 倍的富余,但 bw 上不去。这个现象应该读作”单线程下 mdraid 扩展性有限“,不能外推成”软 RAID 没有收益”或”多盘不如单盘”。要跑出线性扩展,需要numjobs=盘数*2+--cpus_allowed_policy=split,让每块盘都有独立线程喂 IO。本文末尾引用的阿里云测试脚本就是这么做的,只是前面的对比测试没用上。
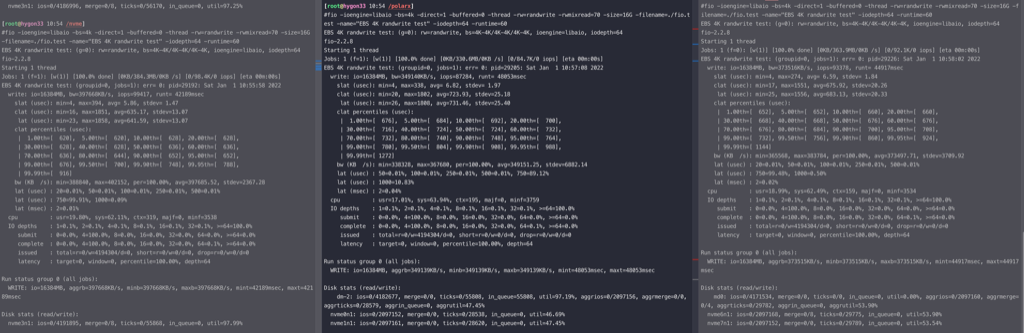
| RAID0(2块盘) | NVMe | LVM(2块,线性模式) | RAID0(4块盘) | 线性(4块 linear) | |
|---|---|---|---|---|---|
| dd write bs=1M count=10240 conv=fsync | 10.9秒 | 23秒 | 24.6秒 | 10.9秒 | 11.9秒 |
| fio -ioengine=libaio -bs=4k -buffered=1 | bw=346744KB/s, iops=86686 nvme6n1: util=38.43% nvme7n1: util=38.96% |
bw=380816KB/s, iops=95203 nvme2n1: util=68.31% |
bw=175704KB/s, iops=43925 nvme0n1:util=29.60% nvme1n1: util=25.64% |
bw=337495KB/s, iops=84373 nvme6n1: util=20.93% nvme5n1: util=21.30% nvme4n1: util=21.12% nvme7n1: util=20.95% |
bw=329721KB/s, iops=82430 nvme0n1: util=67.22% nvme3n1: util=0% 线性每次只写一块盘 |
| fio -ioengine=libaio -bs=4k -direct=1 -buffered=0 | bw=121556KB/s, iops=30389 nvme6n1: util=18.70% nvme7n1: util=18.91% |
bw=126215KB/s, iops=31553 nvme2n1: util=37.27% |
bw=117192KB/s, iops=29297 nvme0n1:util=21.16% nvme1n1: util=13.35% |
bw=119145KB/s, iops=29786 nvme6n1: util=9.19% nvme5n1: util=9.45% nvme4n1: util=9.45% nvme7n1: util=9.30% |
bw=116688KB/s, iops=29171 nvme0n1: util=37.87% nvme3n1: util=0% 线性每次只写一块盘 |
| fio -bs=4k -direct=1 -buffered=0 | bw=104107KB/s, iops=26026 nvme6n1: util=15.55% nvme7n1: util=15.00% |
bw=105115KB/s, iops=26278 nvme2n1: util=31.25% |
bw=101936KB/s, iops=25484 nvme0n1:util=17.76% nvme1n1: util=12.07% |
bw=102517KB/s, iops=25629 nvme6n1: util=8.13% nvme5n1: util=7.65% nvme4n1: util=7.57% nvme7n1: util=7.75% |
bw=87280KB/s, iops=21820 nvme0n1: util=31.27% nvme3n1: util=0% 线性每次只写一块盘 |
- 整体看 nvme 最好(顺序写除外),raid0性能接近nvme,LVM(线性模式)最差
- 顺序写raid0是nvme、LVM(线性模式)的两倍
- 随机读写带buffered的话 nvme最好,raid0略差(猜测是软件消耗),LVM 线性模式只有前两者的一半——但这是因为线性模式下数据只写一块盘,本质上是单盘性能加上 LVM 软件开销
- 关掉buffered 三者性能下降都很大,最终差异变小
- raid0下两块盘非常均衡,LVM 线性模式下两块盘负载差异大是预期行为(先写满一块再写下一块)
- 当阵列中盘数变多后,单线程测试下软件实现的RAID性能并没有线性提升(瓶颈在CPU侧而非磁盘侧,从iostat看每块盘util都很低)
- 开buffer对性能提升非常大
- 每次测试前都会echo 3 > /proc/sys/vm/drop_caches ; rm -f ./fio.test ;测试跑多次,取稳定值
- fio 测试里的 iodepth 对应 /sys/block/sdd/queue/nr_requests, SSD 的队列数越性能越好,但是要配合多线程并发读写
顺序读写
然后同时做dd写入测试
1 | time taskset -c 0 dd if=/dev/zero of=./tempfile2 bs=1M count=40240 & |
下图上面两块nvme做的LVM(线性模式),下面两块nvme做成RAID0,同时开始测试,可以看到RAID0的两块盘写入速度更快(因为条带化可以并行写两块盘,而线性模式只写一块)
测试结果
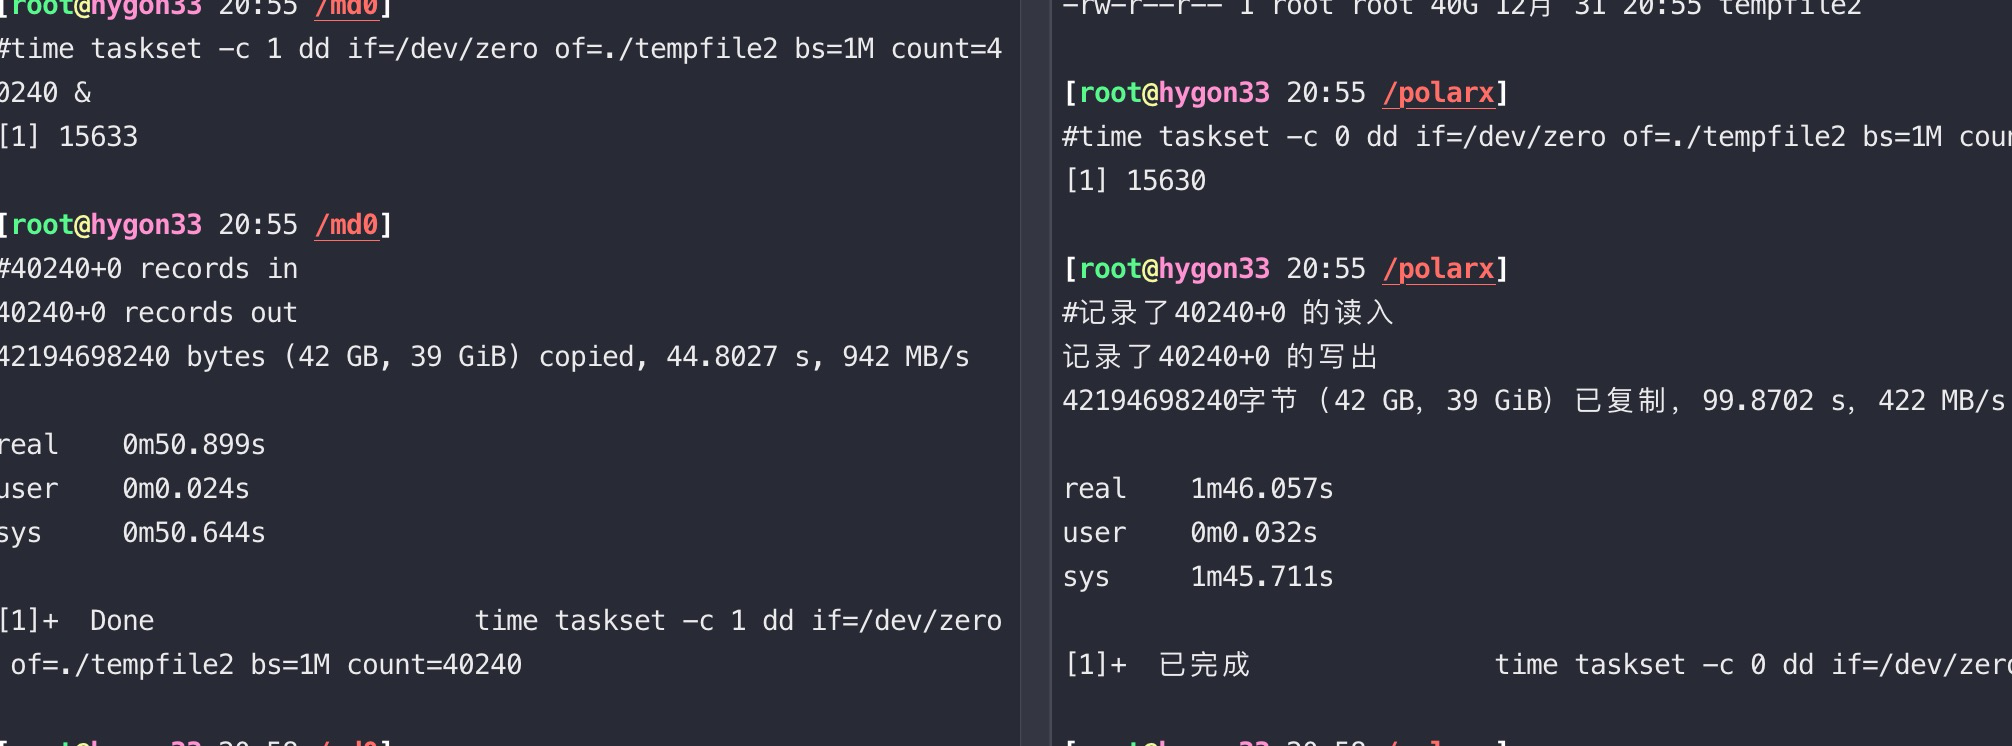
实际单独写一块nvme也比写两块nvme做的LVM(线性模式)要快一倍——这是因为线性模式下只用到一块盘,额外的 LVM 软件开销反而拖慢了性能。对dd这样的顺序读写,软RAID0(条带化)还是能提升一倍速度的
1 | [root@hygon33 14:02 /nvme] |
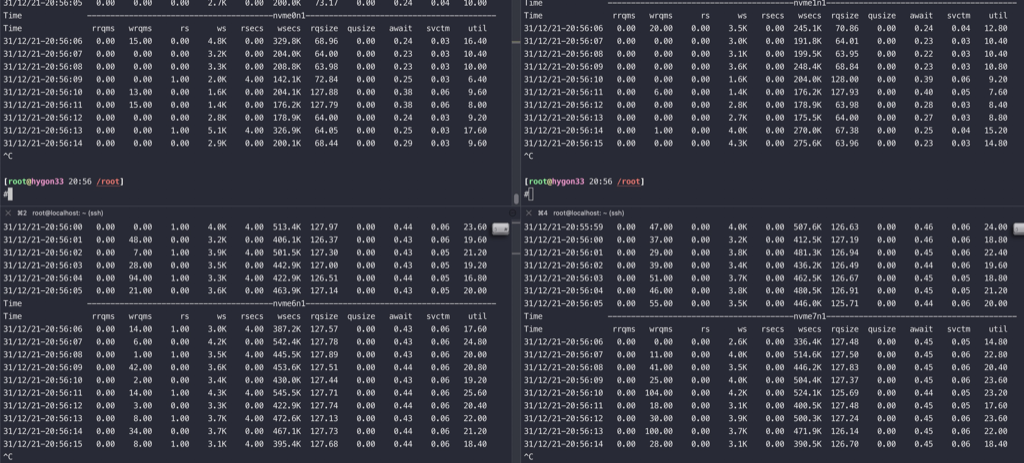
随机读写
SSD单独的随机读IOPS大概是随机写IOPS的10%, 应该是因为write有cache
RAID0是使用mdadm做的软raid,系统层面还是有消耗,没法和RAID卡硬件比较
左边是一块nvme,中间是两块nvme做了LVM(线性模式),右边是两块nvme做RAID0,看起来速度差不多,一块nvme似乎要好一点点
1 | fio -ioengine=libaio -bs=4k -buffered=1 -thread -rw=randwrite -rwmixread=70 -size=16G -filename=./fio.test -name="EBS 4K randwrite test" -iodepth=64 -runtime=60 |
从观察来看,RAID0的两块盘读写、iops都非常均衡,LVM(线性模式)下只有一块盘在工作
三个测试分开跑,独立nvme性能最好,LVM(线性模式)最差——但这是线性分配的预期行为,不代表 LVM 技术本身差
三个测试分开跑,去掉 aio,性能都只有原来的一半
1 | fio -bs=4k -direct=1 -buffered=0 -thread -rw=randwrite -rwmixread=70 -size=16G -filename=./fio.test -name="EBS 4K randwrite test" -iodepth=64 -runtime=60 |
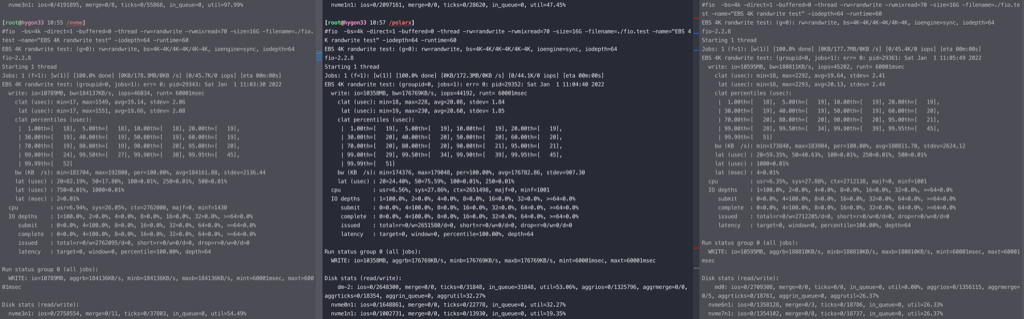
修改fio参数,用最快的 direct=0 buffered=1 aio 结论是raid0最快,直接写nvme略慢,LVM(线性模式)只有raid0的一半(因为线性模式只用到一块盘)
1 | [root@hygon33 13:43 /md0] |
将RAID0从两块nvme改成四块后,整体性能略微下降
1 | #fio -bs=4k -direct=1 -buffered=0 -thread -rw=randwrite -rwmixread=70 -size=16G -filename=./fio.test -name="EBS 4K randwrite test" -iodepth=64 -runtime=60 |
raid6测试
raid6开buffer性能比raid0还要好10-20%,实际是将刷盘延迟异步在做,如果用-buffer=0 raid6的性能只有raid0的一半
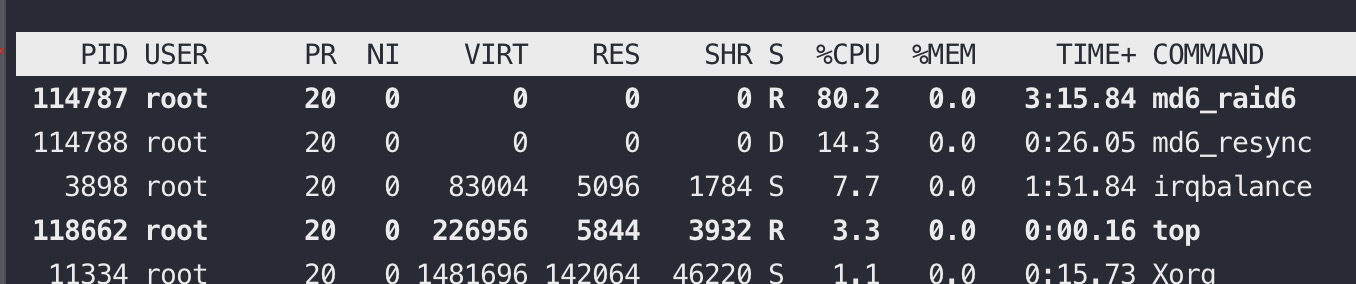
1 | [root@hygon33 17:19 /md6] |
测试完成很久后ssd还维持高水位的读写
1 | avg-cpu: %user %nice %system %iowait %steal %idle |
fio 结果解读
slat,异步场景下才有
其中slat指的是发起IO的时间,在异步IO模式下,发起IO以后,IO会异步完成。例如调用一个异步的write,虽然write返回成功了,但是IO还未完成,slat约等于发起write的耗时;
slat (usec): min=4, max=6154, avg=48.82, stdev=56.38: The first latency metric you’ll see is the ‘slat’ or submission latency. It is pretty much what it sounds like, meaning “how long did it take to submit this IO to the kernel for processing?”
clat
clat指的是完成时间,从发起IO后到完成IO的时间,在同步IO模式下,clat是指整个写动作完成时间
lat
lat是总延迟时间,指的是IO单元创建到完成的总时间,通常这项数据关注较多。同步场景几乎等于clat,异步场景等于clat+slat
这项数据需要关注的是max,看看有没有极端的高延迟IO;另外还需要关注stdev,这项数据越大说明,IO响应时间波动越大,反之越小,波动越小
clat percentiles (usec):处于某个百分位的io操作时延
cpu : usr=9.11%, sys=57.07%, ctx=762410, majf=0, minf=1769 //用户和系统的CPU占用时间百分比,线程切换次数,major以及minor页面错误的数量。
direct和buffered参数是冲突的,用一个就行,应该是direct=0性能更好,实际不是这样,这里还需要找资料求证下
direct``=boolIf value is true, use non-buffered I/O. This is usually O_DIRECT. Note that OpenBSD and ZFS on Solaris don’t support direct I/O. On Windows the synchronous ioengines don’t support direct I/O. Default: false.
buffered``=boolIf value is true, use buffered I/O. This is the opposite of the
directoption. Defaults to true.
iostat 结果解读
iostat输出的数据来源diskstat (/proc/diskstats),推荐:https://bean-li.github.io/dive-into-iostat/
Dm-0就是lvm
1 | avg-cpu: %user %nice %system %iowait %steal %idle |
avgqu_sz,是iostat的一项比较重要的数据。如果队列过长,则表示有大量IO在处理或等待,但是这还不足以说明后端的存储系统达到了处理极限。例如后端存储的并发能力是4096,客户端并发发送了256个IO下去,那么队列长度就是256。即使长时间队列长度是256,也不能说明什么,仅仅表明队列长度是256,有256个IO在处理或者排队。
avgrq-sz:请求是大IO还是小IO
rd_ticks和wr_ticks是把每一个IO消耗时间累加起来,但是硬盘设备一般可以并行处理多个IO,因此,rd_ticks和wr_ticks之和一般会比自然时间(wall-clock time)要大
那么怎么判断IO是在调度队列排队等待,还是在设备上处理呢?iostat有两项数据可以给出一个大致的判断。svctime,这项数据的指的是IO在设备处理中耗费的时间。另外一项数据await,指的是IO从排队到完成的时间,包括了svctime和排队等待的时间。那么通过对比这两项数据,如果两项数据差不多,则说明IO基本没有排队等待,耗费的时间都是设备处理。如果await远大于svctime,则说明有大量的IO在排队,并没有发送给设备处理。
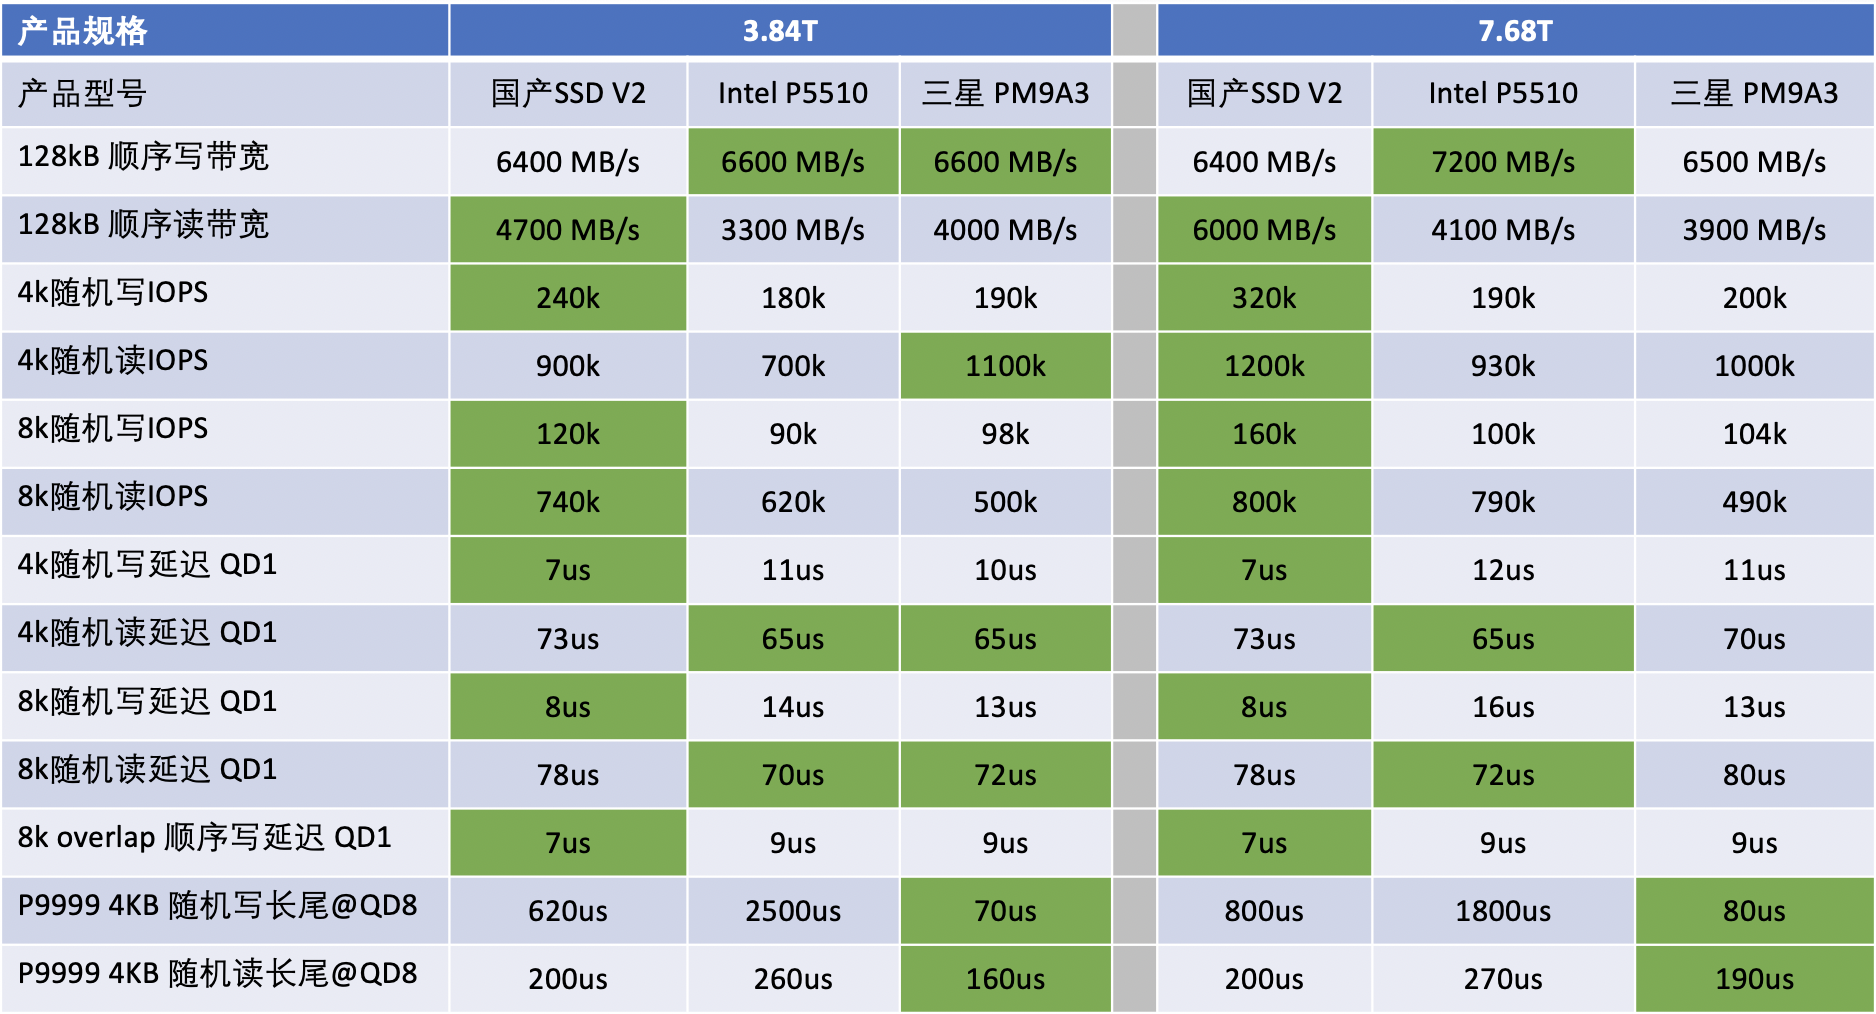
不同厂家SSD性能对比
国产SSD指的是AliFlash
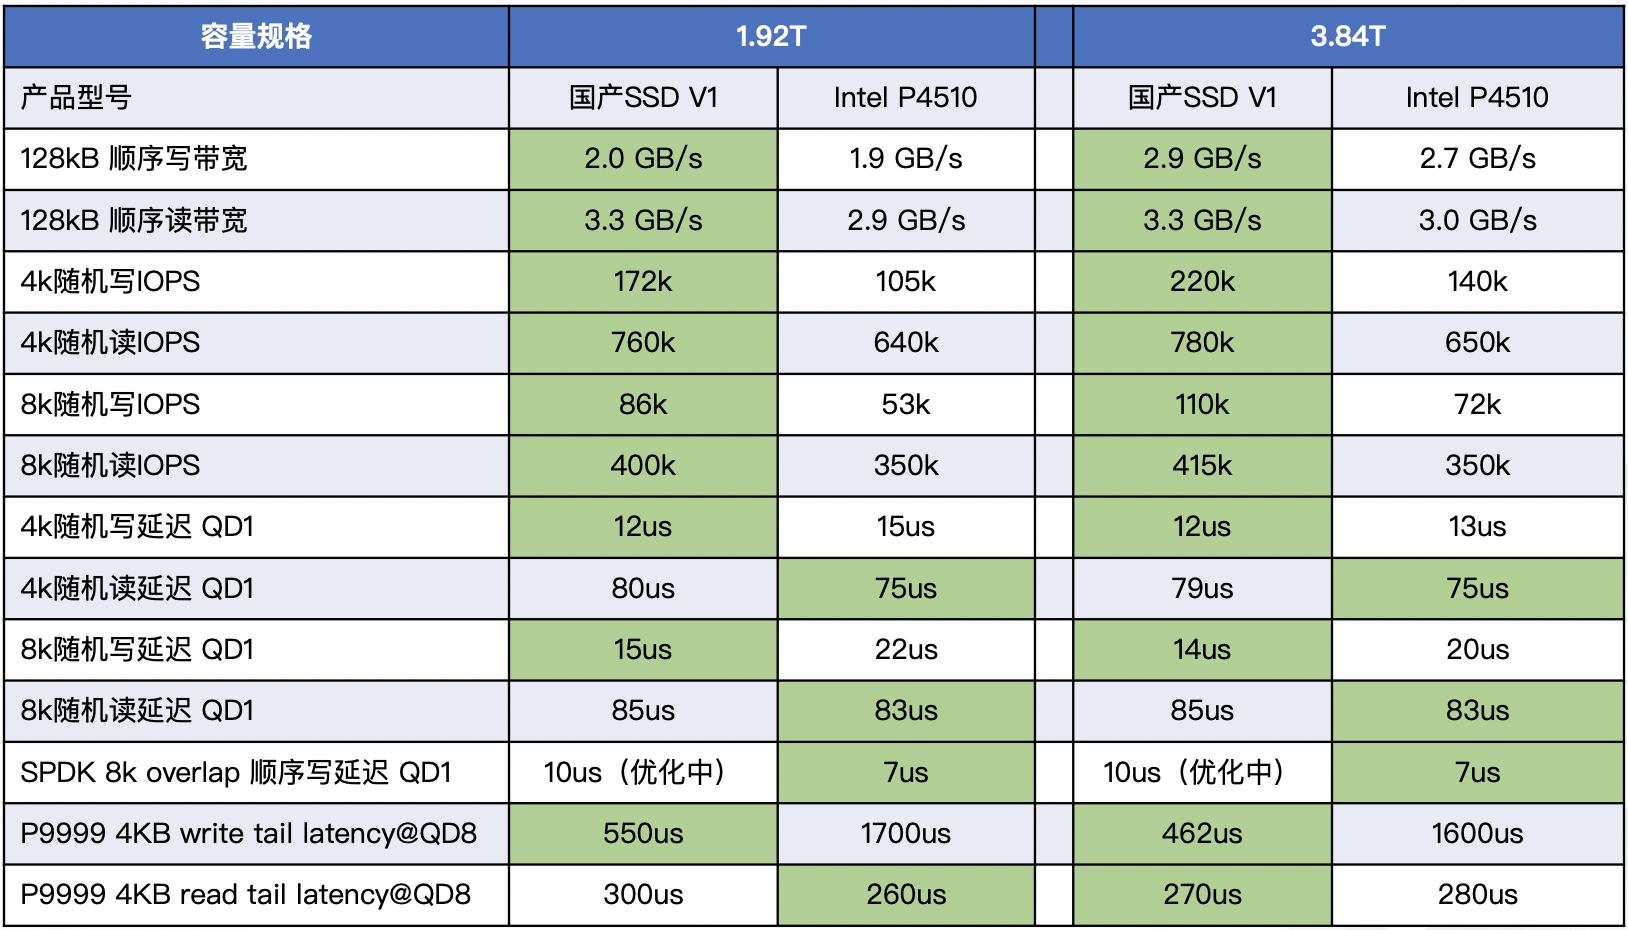
rq_affinity
参考aliyun测试文档 , rq_affinity增加2的commit: git show 5757a6d76c
1 | function RunFio |
对NVME SSD进行测试,左边rq_affinity是2,右边rq_affinity为1,在这个测试参数下rq_affinity为1的性能要好(后许多次测试两者性能差不多)
scheduler 算法
如下,选择了bfq,ssd的话推荐用none或者mq-deadline
1 | #cat /sys/block/nvme{0,1,2,3}n1/queue/scheduler |
bfq(Budget Fair Queueing),该调度算法令存储设备公平的对待每个线程,为各个进程服务相同数量的扇区。通常bfq适用于多媒体应用、桌面环境,对于很多IO压力很大的场景,例如IO集中在某些进程上的场景,bfq并不适用。
mq-deadline算法并不限制每个进程的 IO 资源,是一种以提高机械硬盘吞吐量为出发点的调度算法,该算法适用于IO压力大且IO集中在某几个进程的场景,比如大数据、数据库等场景
磁盘队列的主要目的是对磁盘的I/O进行合并和排序,以提高磁盘的整理性能,对于传统的机械硬盘而言,由于其读写头需要进行物理寻址,因此请求排序和合并调度是非常必要的。但对于SSD硬盘,由于其不需要进行物理寻址,因此磁盘队列的最用相对于小一点
修改
- 临时修改全部磁盘的I/O调度算法,以mq-deadline为例(临时生效):
echo mq-deadline > /sys/block/sd*/queue/scheduler
- 永久修改I/O调度算法,以mq-deadline为例(重启后生效):
vim /lib/udev/rules.d/60-block-scheduler.rules

将图中的bfq改为none或者mq-deadline。
- 验证查看磁盘使用的调度算法:
使用lsblk -t查看SCHED列。
1 | # lsblk -t |
修改bfq调度器的idle时间(临时生效,重启后失效。)
bfq的idle时间默认是8ms,将默认值修改为0。
执行如下命令修改idle值。此处以sdb举例,修改idle为0。
1
echo 0 > /sys/block/sdb/queue/iosched/slice_idle
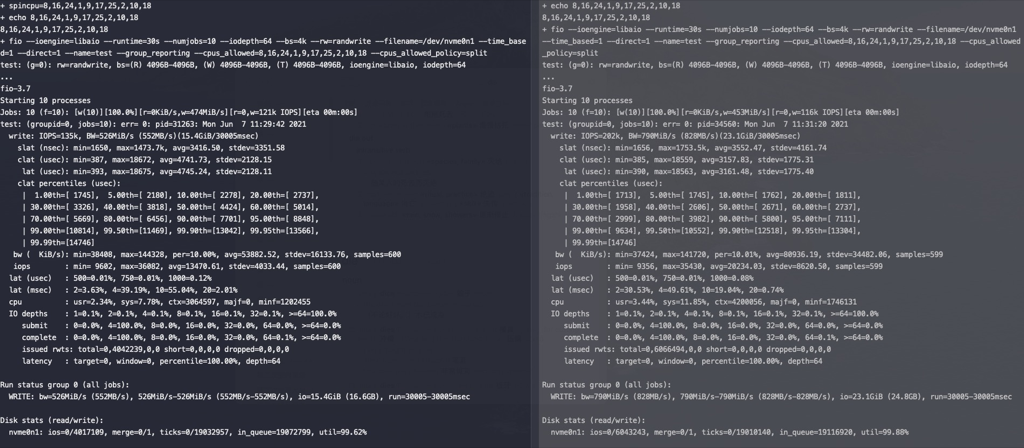
none VS bfq
从下图可以看到 iops 减少到 none 的20-40%之间,并且抖动很大
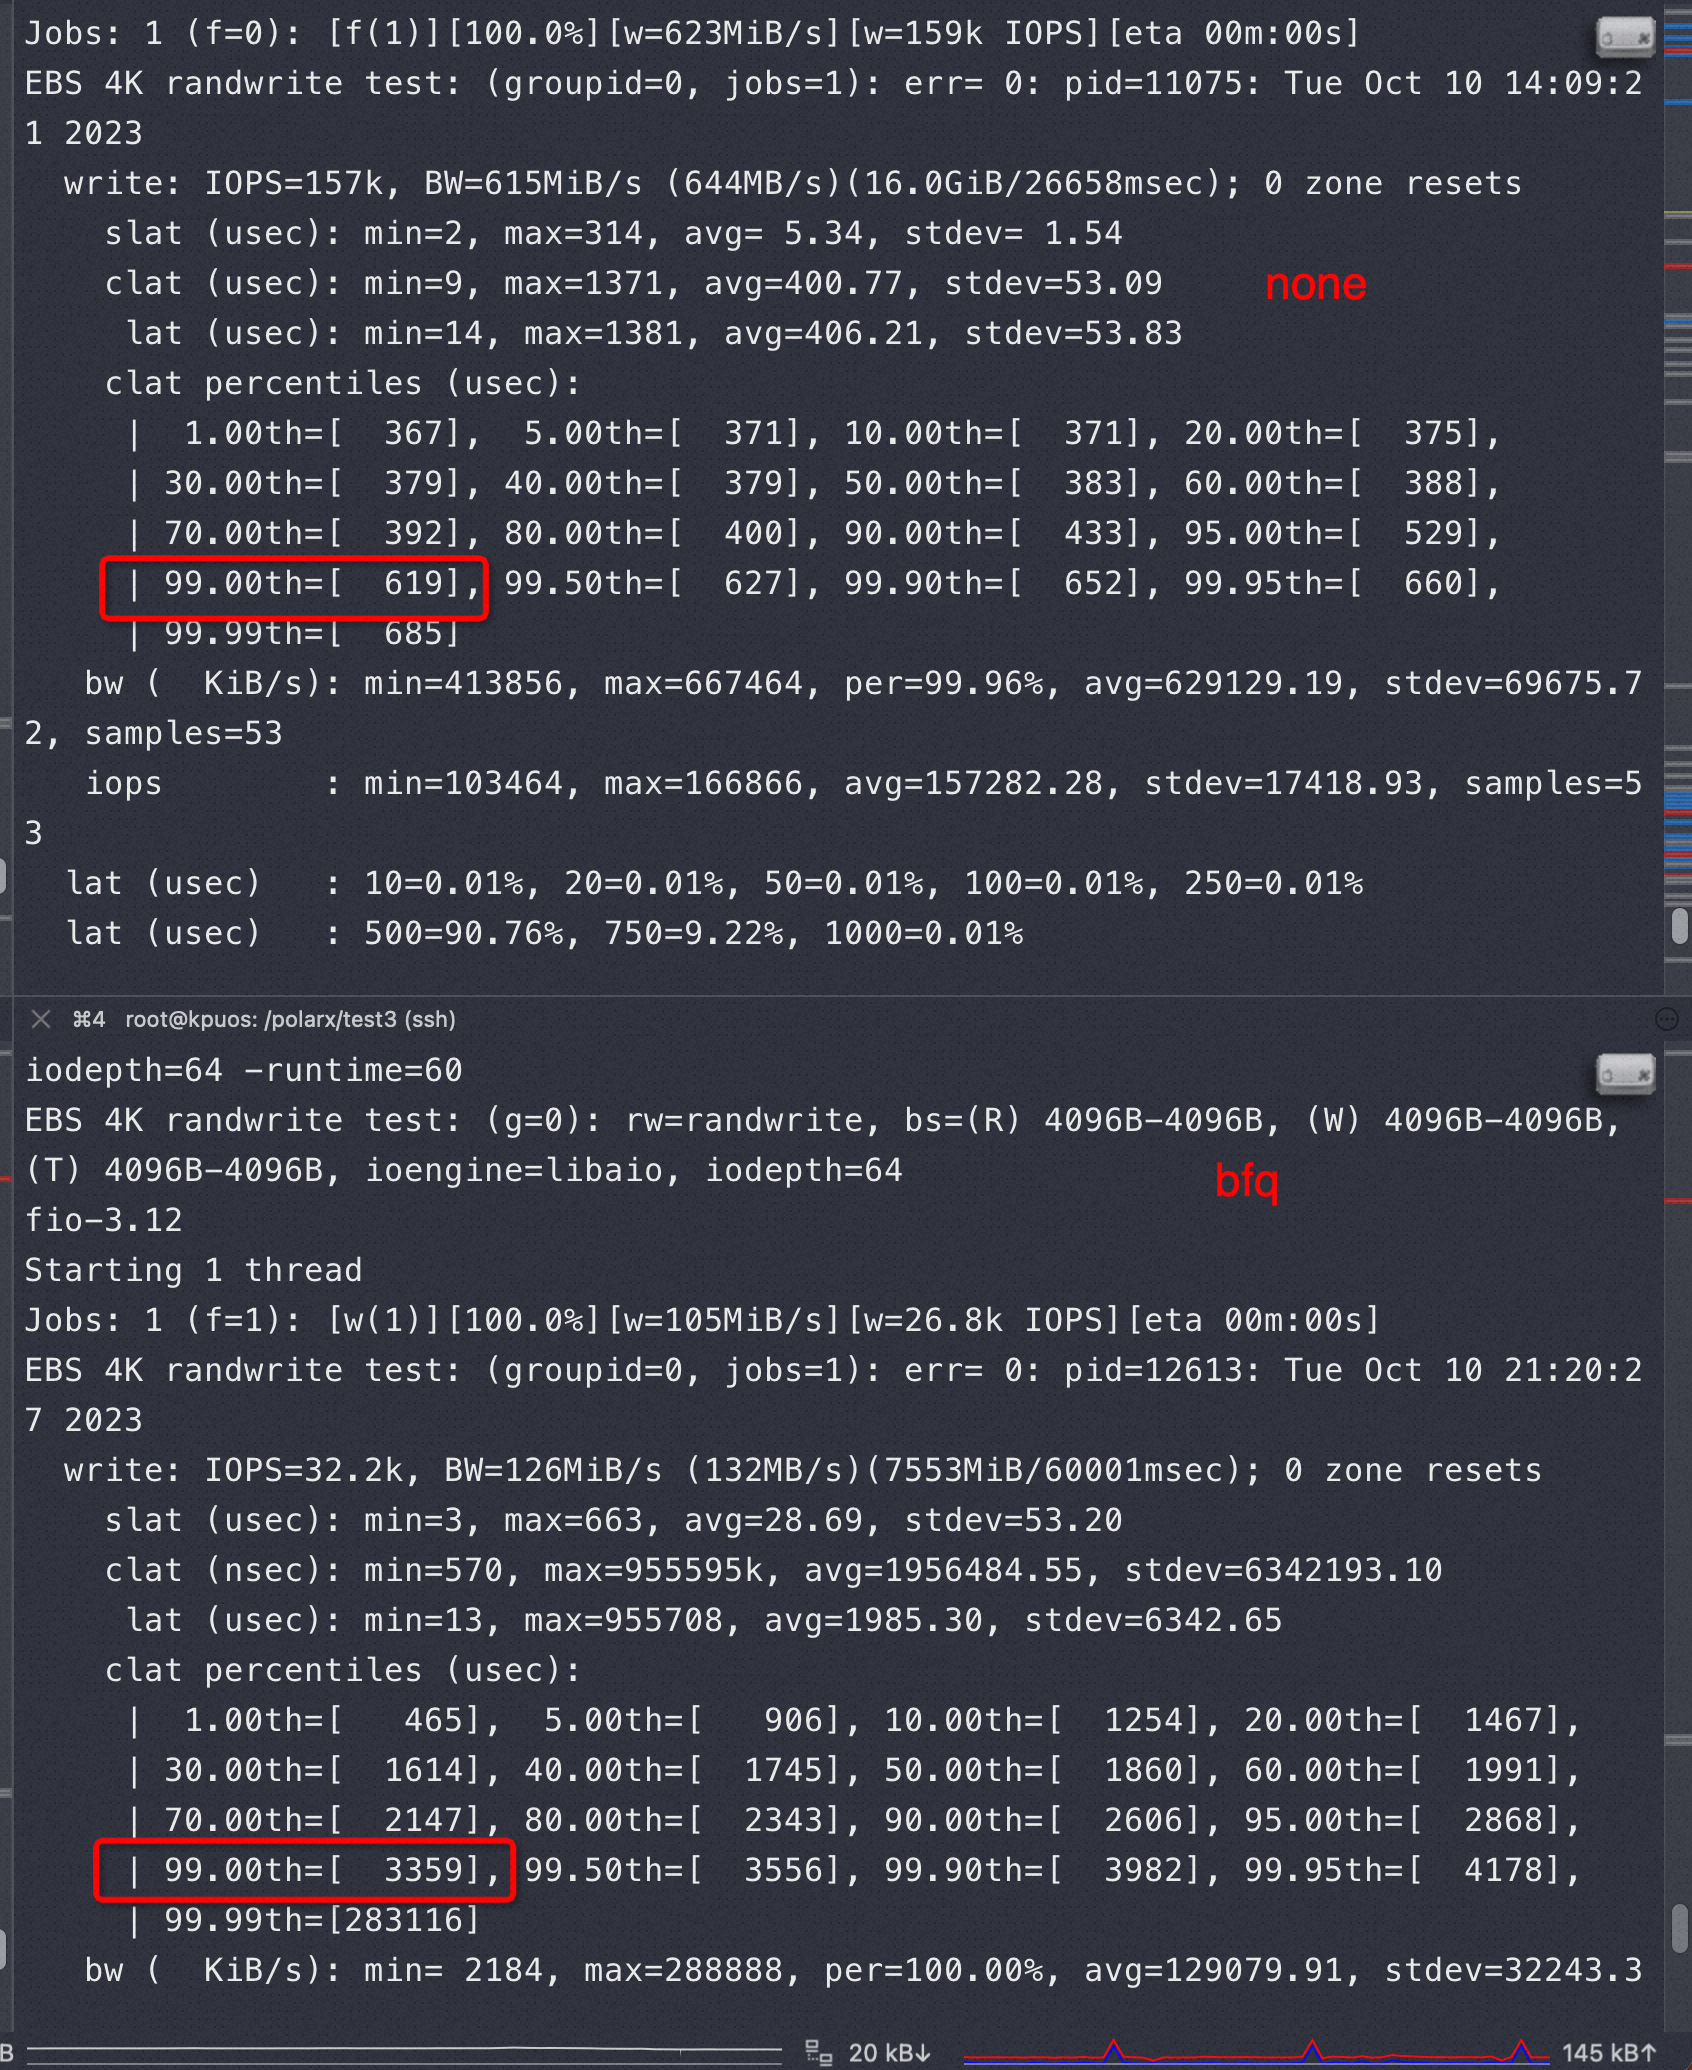
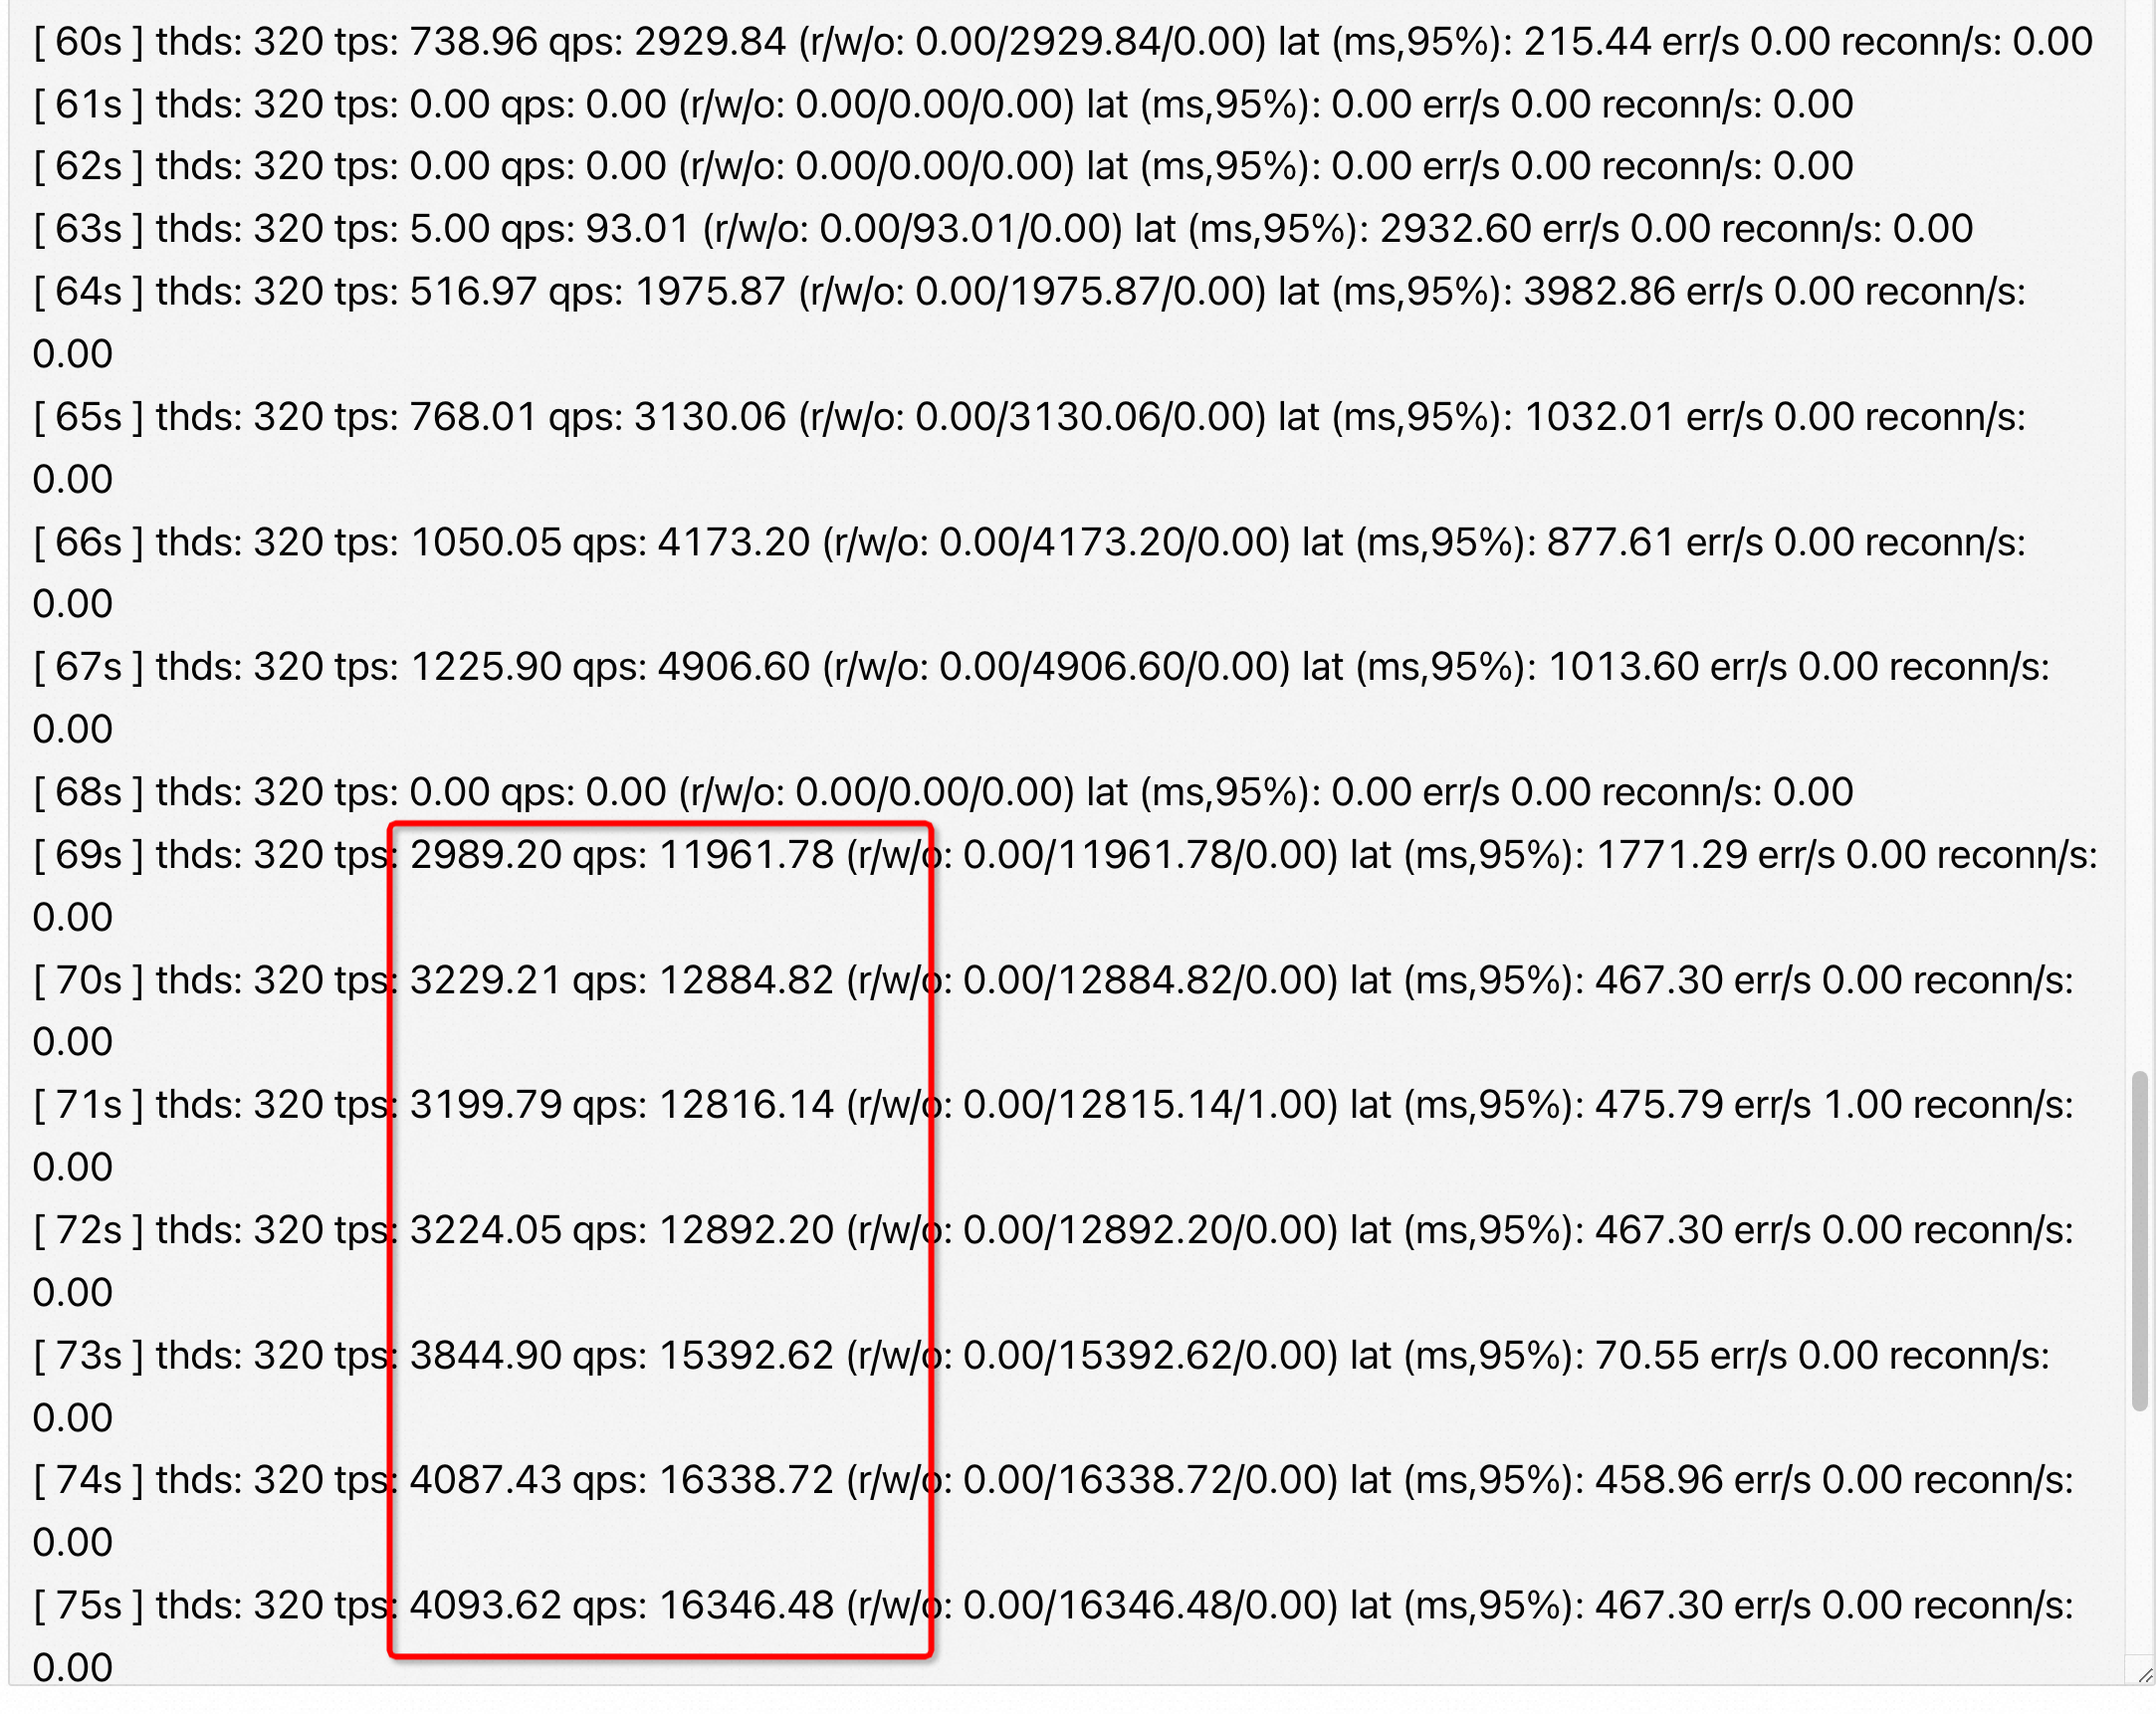
用sysbench write only 场景下 压鲲鹏机器+麒麟(4块nvme做条带LVM )+官方MySQL 也看到了QPS 很差且长期跌0,红框是改成none,红框之前的部分是bfq
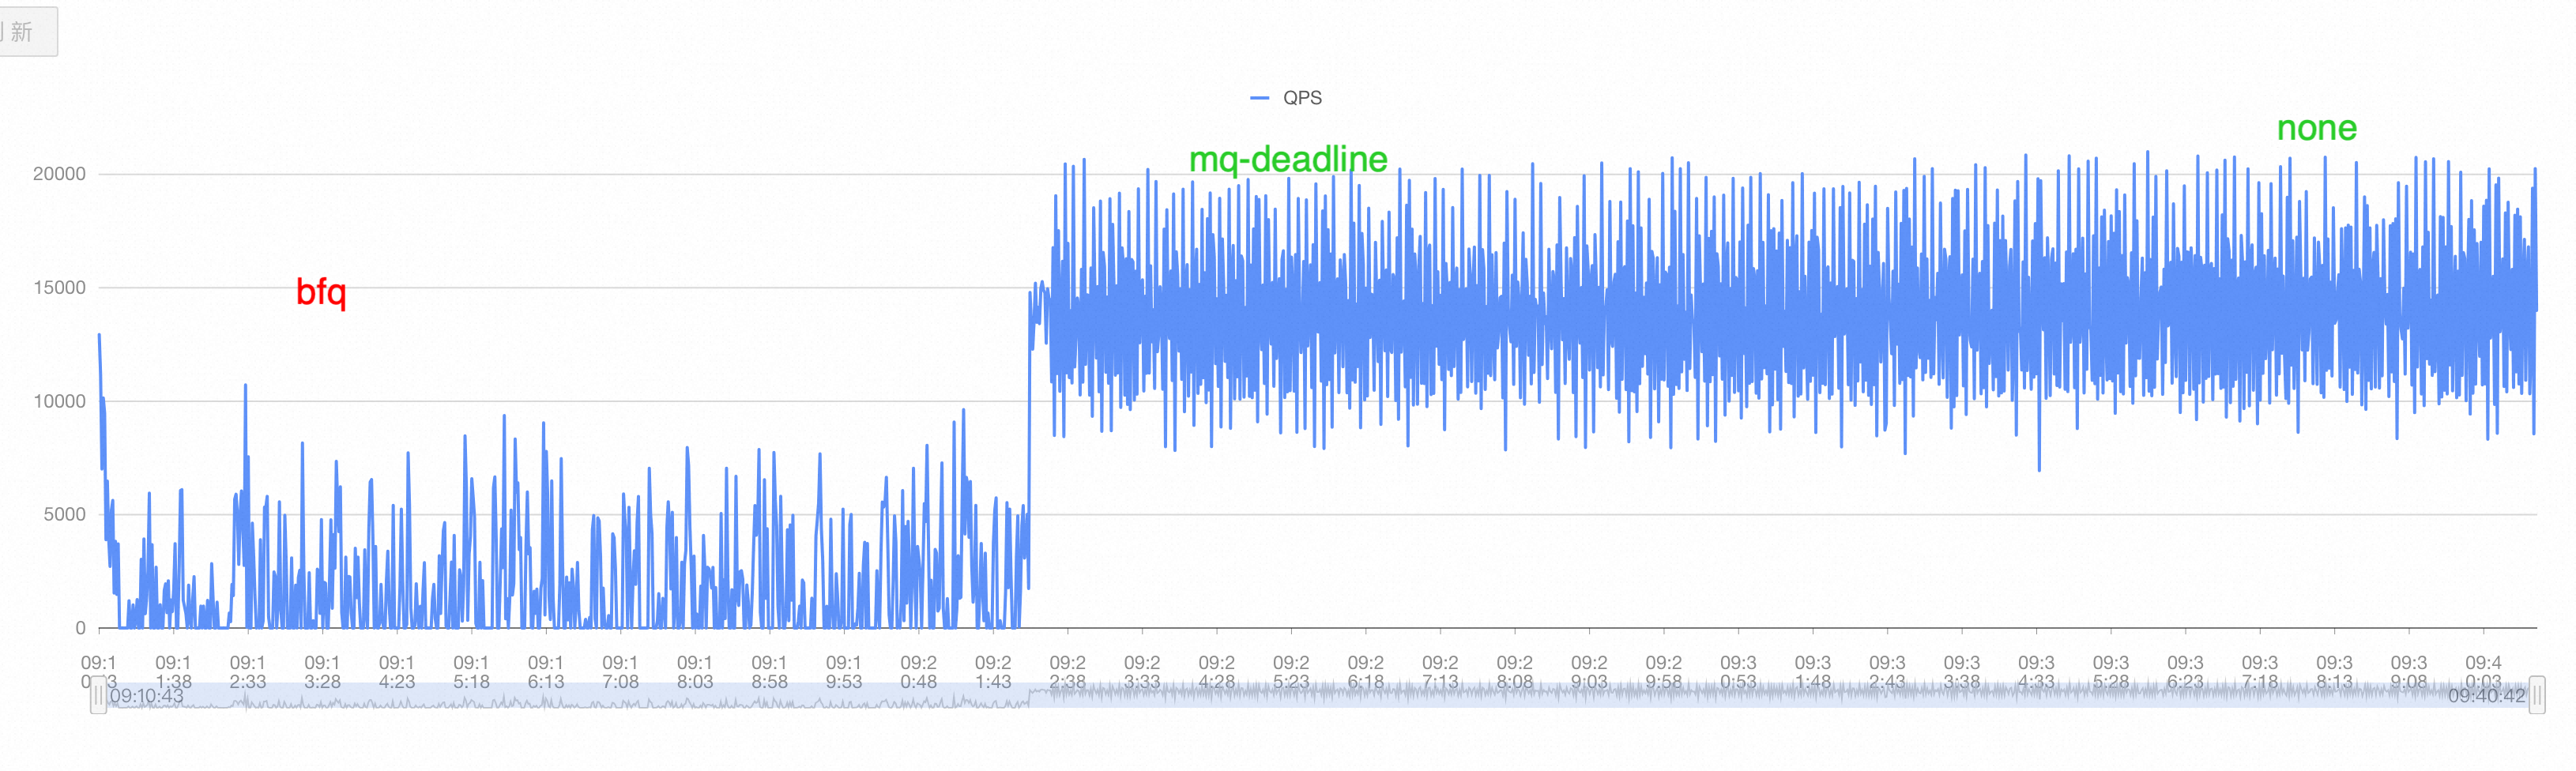
下图是 sysbench write only 场景不同 scheduler 算法的 QPS,可以看到 bfq 很差,mq-deadline 和 none 几乎差不多
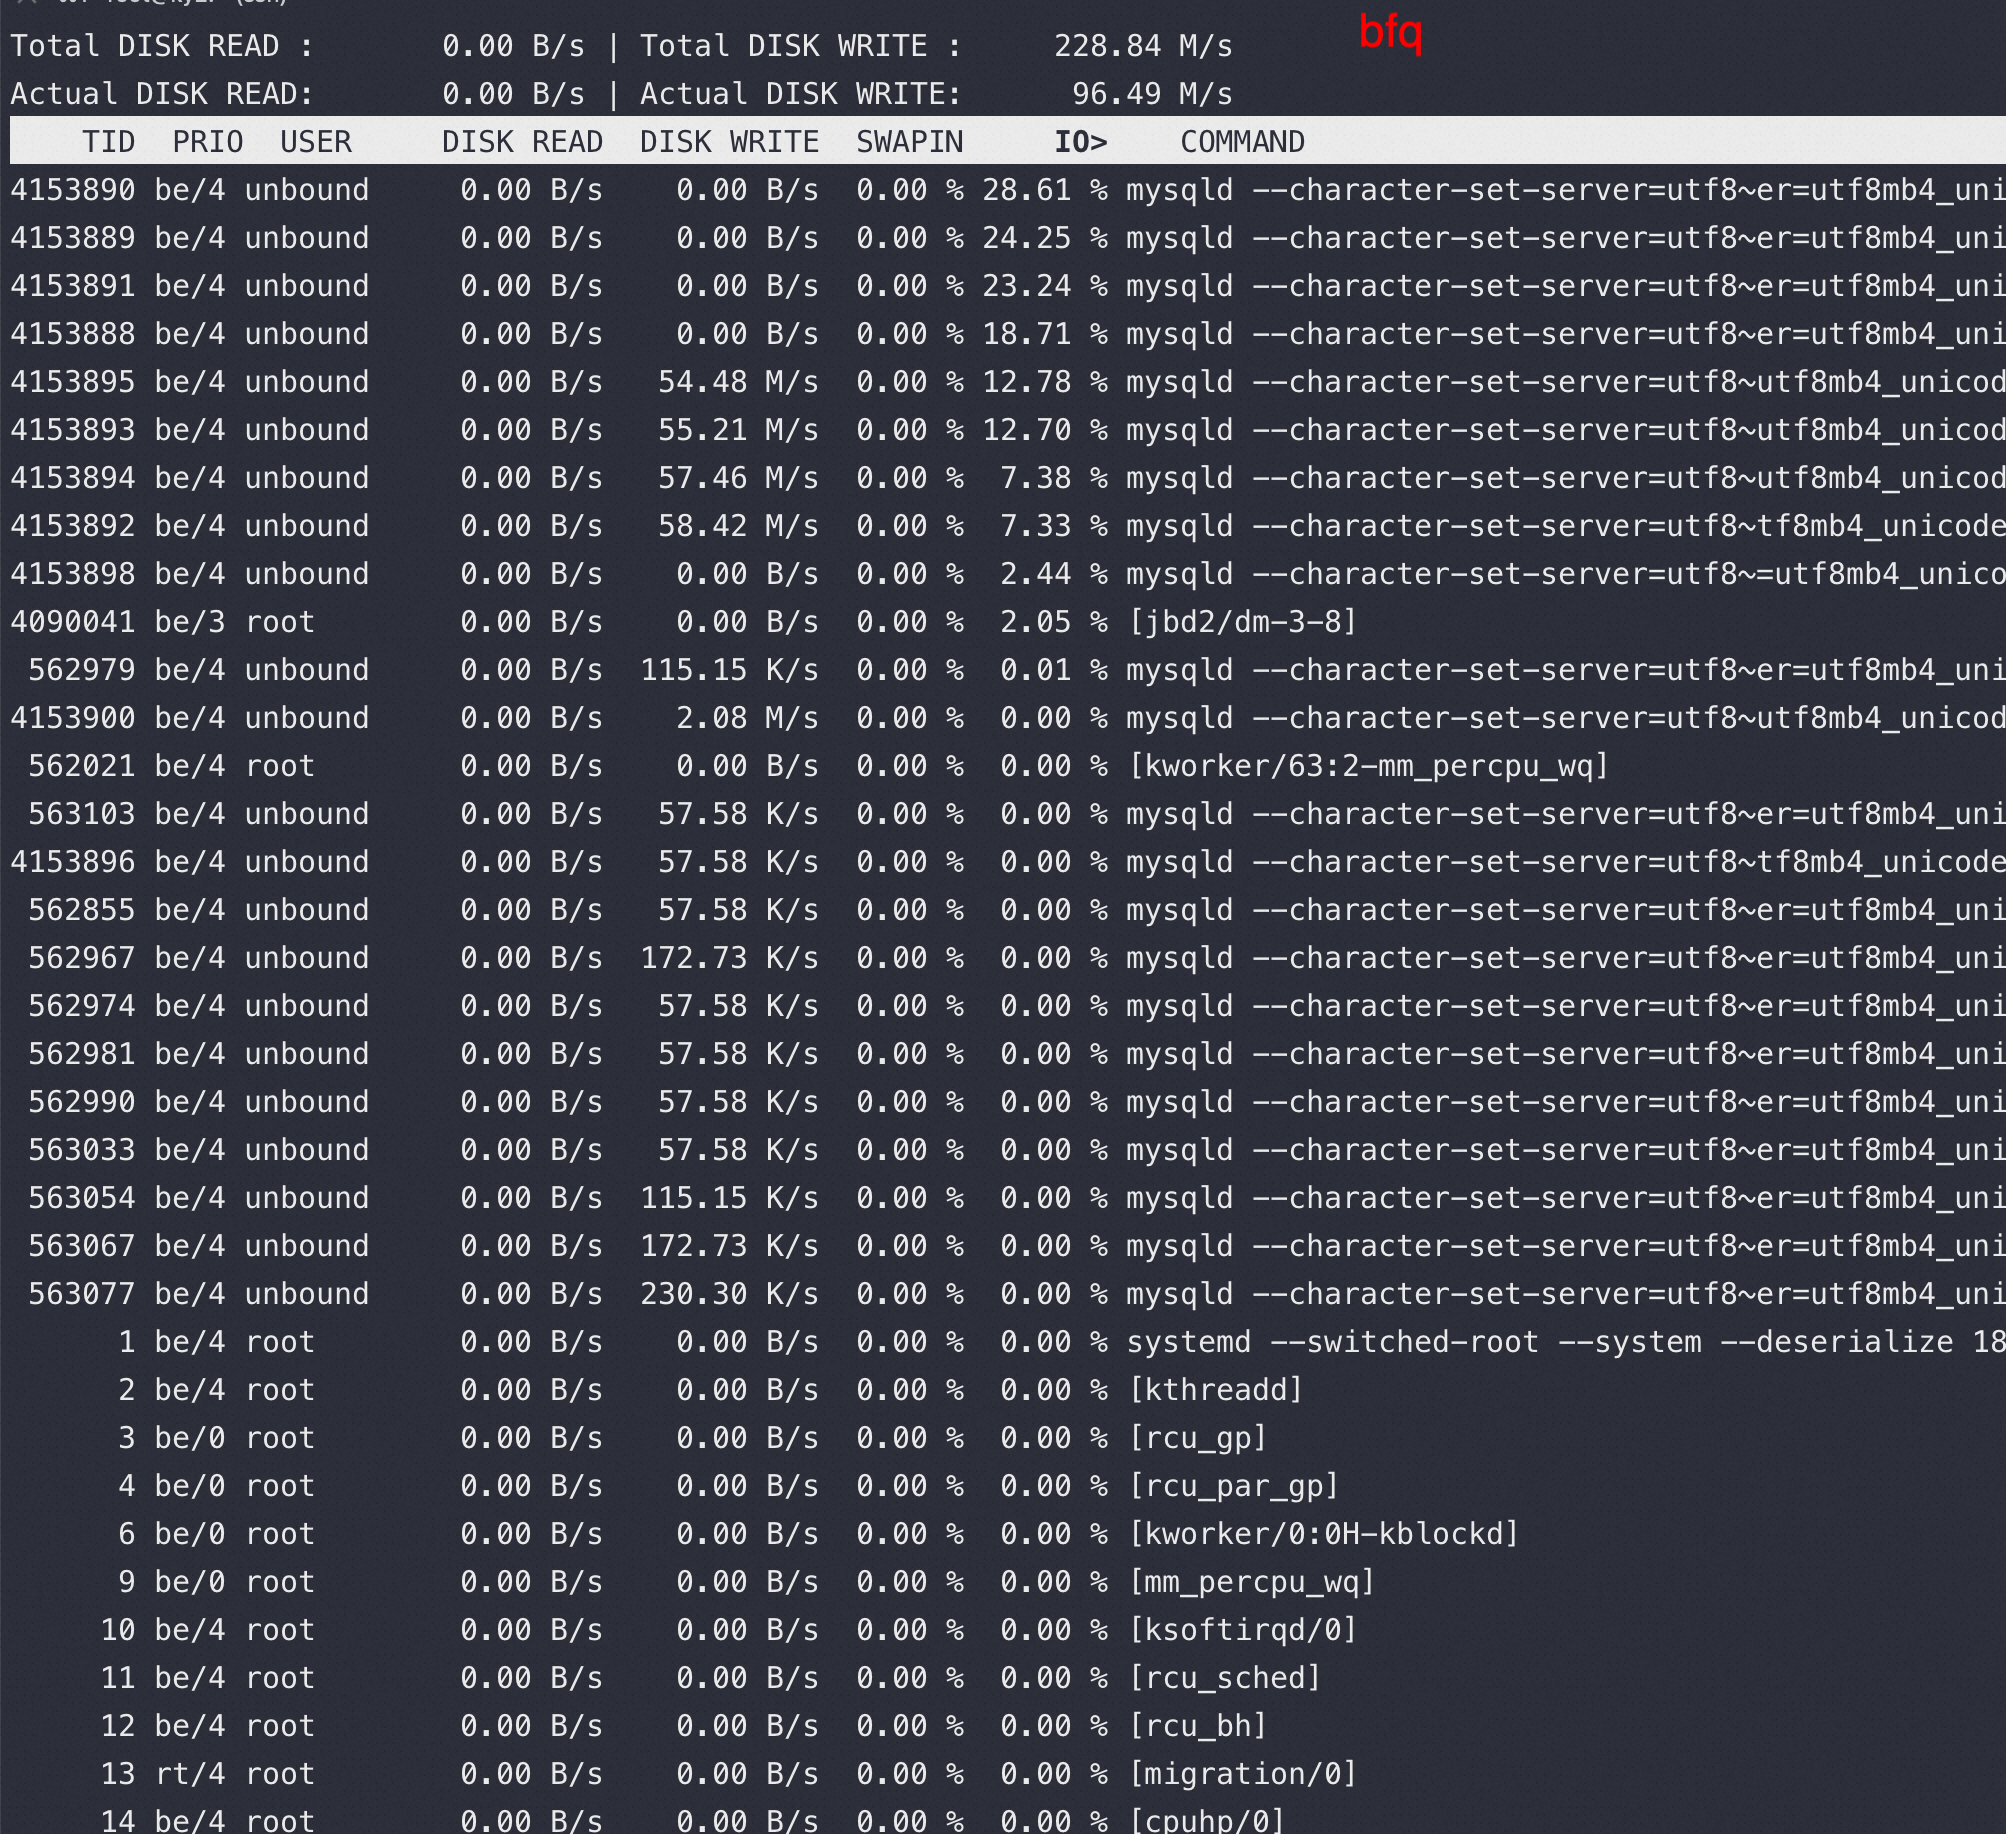
对应的 iotop

磁盘挂载参数
内核一般配置的脏页回写超时时间是30s,理论上page cache能buffer住所有的脏页,但是ext4文件系统的默认挂载参数开始支持日志(journal),文件的inode被修改后,需要刷到journal里,这样系统crash了文件系统能恢复过来,内核配置默认5s刷一次journal。
ext4还有一个配置项叫挂载方式,有ordered和writeback两个选项,区别是ordered在把inode刷到journal里之前,会把inode的所有脏页先回写到磁盘里,如果不希望inode这么快写回到磁盘则可以用writeback参数。当SSD开始写盘的时候会严重影响SSD读能力
1 | # 编辑/etc/fstab,挂载参数设置为defaults,noatime,nodiratime,delalloc,nobarrier,data=writeback |
noatime 读取文件时,将禁用对元数据的更新。它还启用了 nodiratime 行为,该行为会在读取目录时禁用对元数据的更新
nodelalloc 参数是关闭了ext4的delayed allocation 特性。所谓delayed allocation 是指,把磁盘block的分配推后到真正要写数据的时候,比如写入文件的时候,先写内存,当数据需要落盘的时候,再由文件系统分配磁盘块,这有利于文件系统做出更佳的磁盘块分配决策,比如可以分配大片连续的磁盘块。显然 nodelalloc 性能要差些
delalloc吞吐高,但是偶发性延迟抖动,平均延迟略高
nodelalloc延迟稳定,但是吞吐会下降,偶发性会延迟剧烈抖动.
nobarrier 参数是不保证先写入文件系统日志然后才写入数据,也就是不保证系统崩溃后文件系统恢复的正确性,但是对写入性能有提升
1 | 参数说明: |
优化case
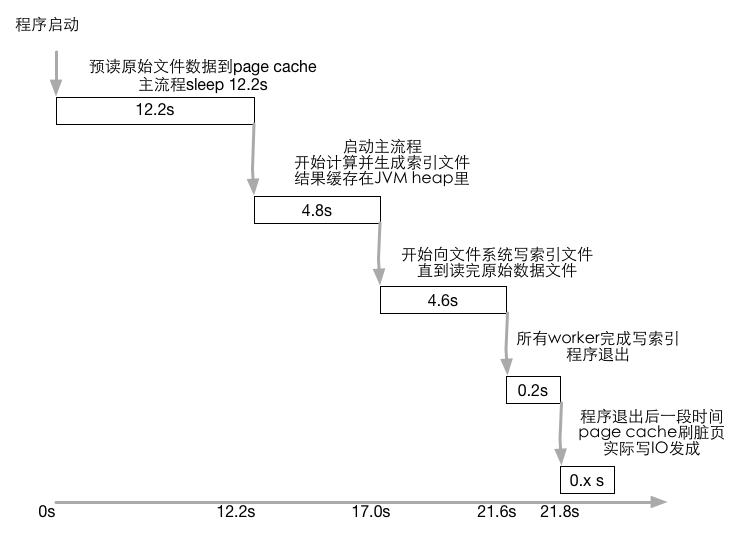
10个GB的原始文件里面都是随机数,如何快速建索引支持分页查询top(k,n)场景,机器配置是24核,JVM堆内存限制2.5G,磁盘读写为490-500MB/s左右。
最后成绩在22.9s,去掉评测方法引入的1.1s,5次查询含建索引总时间21.8s,因为读10GB文件就需要21.5s时间。当向SSD开始写索引文件后SSD读取性能下降厉害,实际期望的是写出索引到SSD的时候会被PageCache,没触发刷脏。但是这里的刷盘就是ext4挂载参数 ordered 导致了刷盘。
整个方案是:原始文件切割成小分片,喂给24个worker;每个worker读数据,处理数据,定期批量写索引出去;最后查询会去读每个worker生成的所有索引文件,通过跳表快速seek。
LVM性能对比
磁盘信息
1 | #lsblk |
单块nvme SSD盘跑mysql server,运行sysbench导入测试数据
1 | #iostat -x nvme1n1 1 |
如果同样写lvm(线性模式),由两块nvme组成(注意 iostat 显示 nvme2n1 完全空闲,说明线性模式下只有一块盘在工作)
1 | Device: rrqm/s wrqm/s r/s w/s rkB/s wkB/s avgrq-sz avgqu-sz await r_await w_await svctm %util |
数据总结
- 性能排序 NVMe SSD > SATA SSD > SAN > ESSD > HDD
- 本地ssd性能最好、sas机械盘(RAID10)性能最差
- san存储走特定的光纤网络,不是走tcp的san(至少从网卡看不到san的流量),性能居中
- 从rt来看 ssd:san:sas 大概是 1:3:15
- san比本地sas机械盘性能要好,这也许取决于san的网络传输性能和san存储中的设备(比如用的ssd而不是机械盘)
- NVMe SSD比SATA SSD快很多,latency更稳定
- 阿里云的云盘ESSD比本地SAS RAID10阵列性能还好
- 软RAID 有软件开销,在单线程低并发场景下多盘不一定比单盘快(瓶颈在 CPU 侧);但在顺序写和高并发场景下,条带化(RAID0/条带 LVM)可以显著提升吞吐。LVM 默认的线性模式不做条带化,性能接近单盘
- 不同测试场景(4K/8K/ 读写、随机与否、单线程/多线程)会导致不同品牌性能数据差异较大
工具
1 | //raid 阵列查看 |
参考资料
http://cizixs.com/2017/01/03/how-slow-is-disk-and-network
https://tobert.github.io/post/2014-04-17-fio-output-explained.html
https://zhuanlan.zhihu.com/p/40497397