Nginx 性能测试
Nginx 性能测试
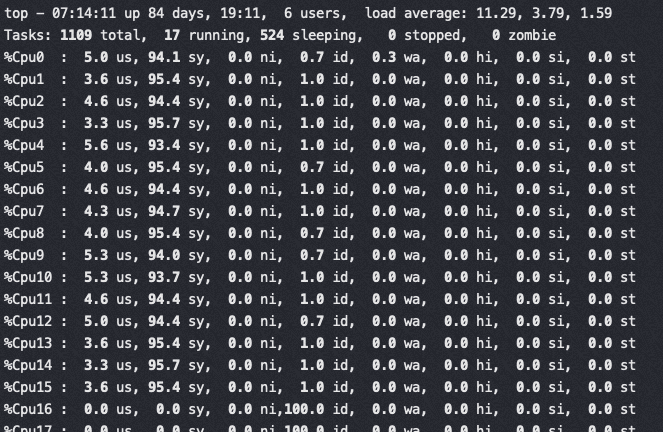
压测工具选择 wrk ,apache ab压nginx单核没问题,多核的话 ab 自己先到瓶颈。另外默认关闭 access.log 避免 osq(osq 优化的自旋锁)。
Nginx 官方测试数据
普通测试数据参考官方数据,不再多做测试
RPS for HTTP Requests
The table and graph below show the number of HTTP requests for varying numbers of CPUs and varying request sizes, in kilobytes (KB).
| CPUs | 0 KB | 1 KB | 10 KB | 100 KB |
|---|---|---|---|---|
| 1 | 145,551 | 74,091 | 54,684 | 33,125 |
| 2 | 249,293 | 131,466 | 102,069 | 62,554 |
| 4 | 543,061 | 261,269 | 207,848 | 88,691 |
| 8 | 1,048,421 | 524,745 | 392,151 | 91,640 |
| 16 | 2,001,846 | 972,382 | 663,921 | 91,623 |
| 32 | 3,019,182 | 1,316,362 | 774,567 | 91,640 |
| 36 | 3,298,511 | 1,309,358 | 764,744 | 91,655 |

RPS for HTTPS Requests
HTTPS RPS is lower than HTTP RPS for the same provisioned bare‑metal hardware because the data encryption and decryption necessary to secure data transmitted between machines is computationally expensive.
Nonetheless, continued advances in Intel architecture – resulting in servers with faster processors and better memory management – mean that the performance of software for CPU‑bound encryption tasks continually improves compared to dedicated hardware encryption devices.
Though RPS for HTTPS are roughly one‑quarter less than for HTTP at the 16‑CPU mark, “throwing hardware at the problem” – in the form of additional CPUs – is more effective than for HTTP, for the more commonly used file sizes and all the way up to 36 CPUs.
| CPUs | 0 KB | 1 KB | 10 KB | 100 KB |
|---|---|---|---|---|
| 1 | 71,561 | 40,207 | 23,308 | 4,830 |
| 2 | 151,325 | 85,139 | 48,654 | 9,871 |
| 4 | 324,654 | 178,395 | 96,808 | 19,355 |
| 8 | 647,213 | 359,576 | 198,818 | 38,900 |
| 16 | 1,262,999 | 690,329 | 383,860 | 77,427 |
| 32 | 2,197,336 | 1,207,959 | 692,804 | 90,430 |
| 36 | 2,175,945 | 1,239,624 | 733,745 | 89,842 |
参考配置参数
1 | user nginx; |
https 配置
解开https默认配置注释 // sed -i “57,81s/#(.*)/\1/“ /etc/nginx/nginx.conf
1 | # Settings for a TLS enabled server. |
生成秘钥文件和配置https
1 | mkdir /etc/pki/nginx/ /etc/pki/nginx/private -p |
创建ecdsa P256 秘钥和证书
1 | openssl req -x509 -sha256 -nodes -days 365 -newkey ec:<(openssl ecparam -name prime256v1) -keyout ecdsa.key -out ecdsa.crt -subj "/C=CN/ST=Beijing/L=Beijing/O=Example Inc./OU=Web Security/CN=example1.com" |
https 长连接
1 | wrk -t 32 -c 1000 -d 30 --latency https://$serverIP:443 |
https 短连接
1 | wrk -t 32 -c 1000 -d 30 -H 'Connection: close' --latency https://$serverIP:443 |
不同 CPU 型号下 Nginx 静态页面的处理能力
对比不同 CPU 型号下 Nginx 静态页面的处理能力。静态文件下容易出现 同一文件上的 自旋锁(OSQ),null 测试场景表示直接返回,不读取文件
1 | wrk -t12 -c400 -d30s http://100.81.131.221:18082/index.html //参数可以调整,目标就是将 CPU 压满 |
软中断在 node0 上,intel E5和 M的对比,在M上访问单个文件锁竞争太激烈,改成请求直接 return 后多核能保持较好的线性能力(下表中 null标识)
| CPUs(括号中为core序号) | E5-2682 | E5-2682 null | M | M null | AMD 7t83 null | AMD 7t83 | ft s2500 on null |
|---|---|---|---|---|---|---|---|
| 1(0) | 69282/61500.77 | 118694/106825 | 74091 | 135539/192691 | 190568 | 87190 | 35064 |
| 2(1,2) | 130648 us 31% | 233947 | 131466 | 365315 | |||
| 2(1对HT) | 94158 34% | 160114 | 217783 | ||||
| 4(0-3) | 234884/211897 | 463033/481010 | 499507/748880 | 730189 | 323591 | ||
| 8(0-7) | 467658/431308 | 923348/825002 | 1015744/1529721 | 1442115 | 650780 | ||
| 8(0-15) | 1689722/1363031 | 1982448/3047778 | 2569314 | 915399 |
测试说明:
- 压测要将多个核打满,有时候因为软中断的挤占会导致部分核打不满
- 要考虑软中断对CPU使用的挤占/以及软中断跨node的影响
- 测试结果两组数字的话,前者为nginx、软中断分别在不同的node
- E5/M 软中断绑 node1,测试结果的两组数据表示软中断和nginx跨node和同node(同 node时软中断和nginx尽量错开)
- null 指的是 nginx 直接返回 200,不从文件读取html,保证没有文件锁
- AMD 软中断总是能跟着绑核的nginx进程跑
- 压测要将多个核打满,有时候因为软中断的挤占会导致部分核打不满
M是裸金属ECS,moc卡插在Die1上,所以软中断默认绑在 Die1 上,测试强行将软中断绑定到 Die0 实际测试结果和绑定在 Die1 性能一样,猜测改了驱动将网络包的描述符没有按硬件绑死而是跟软中断就近分配。
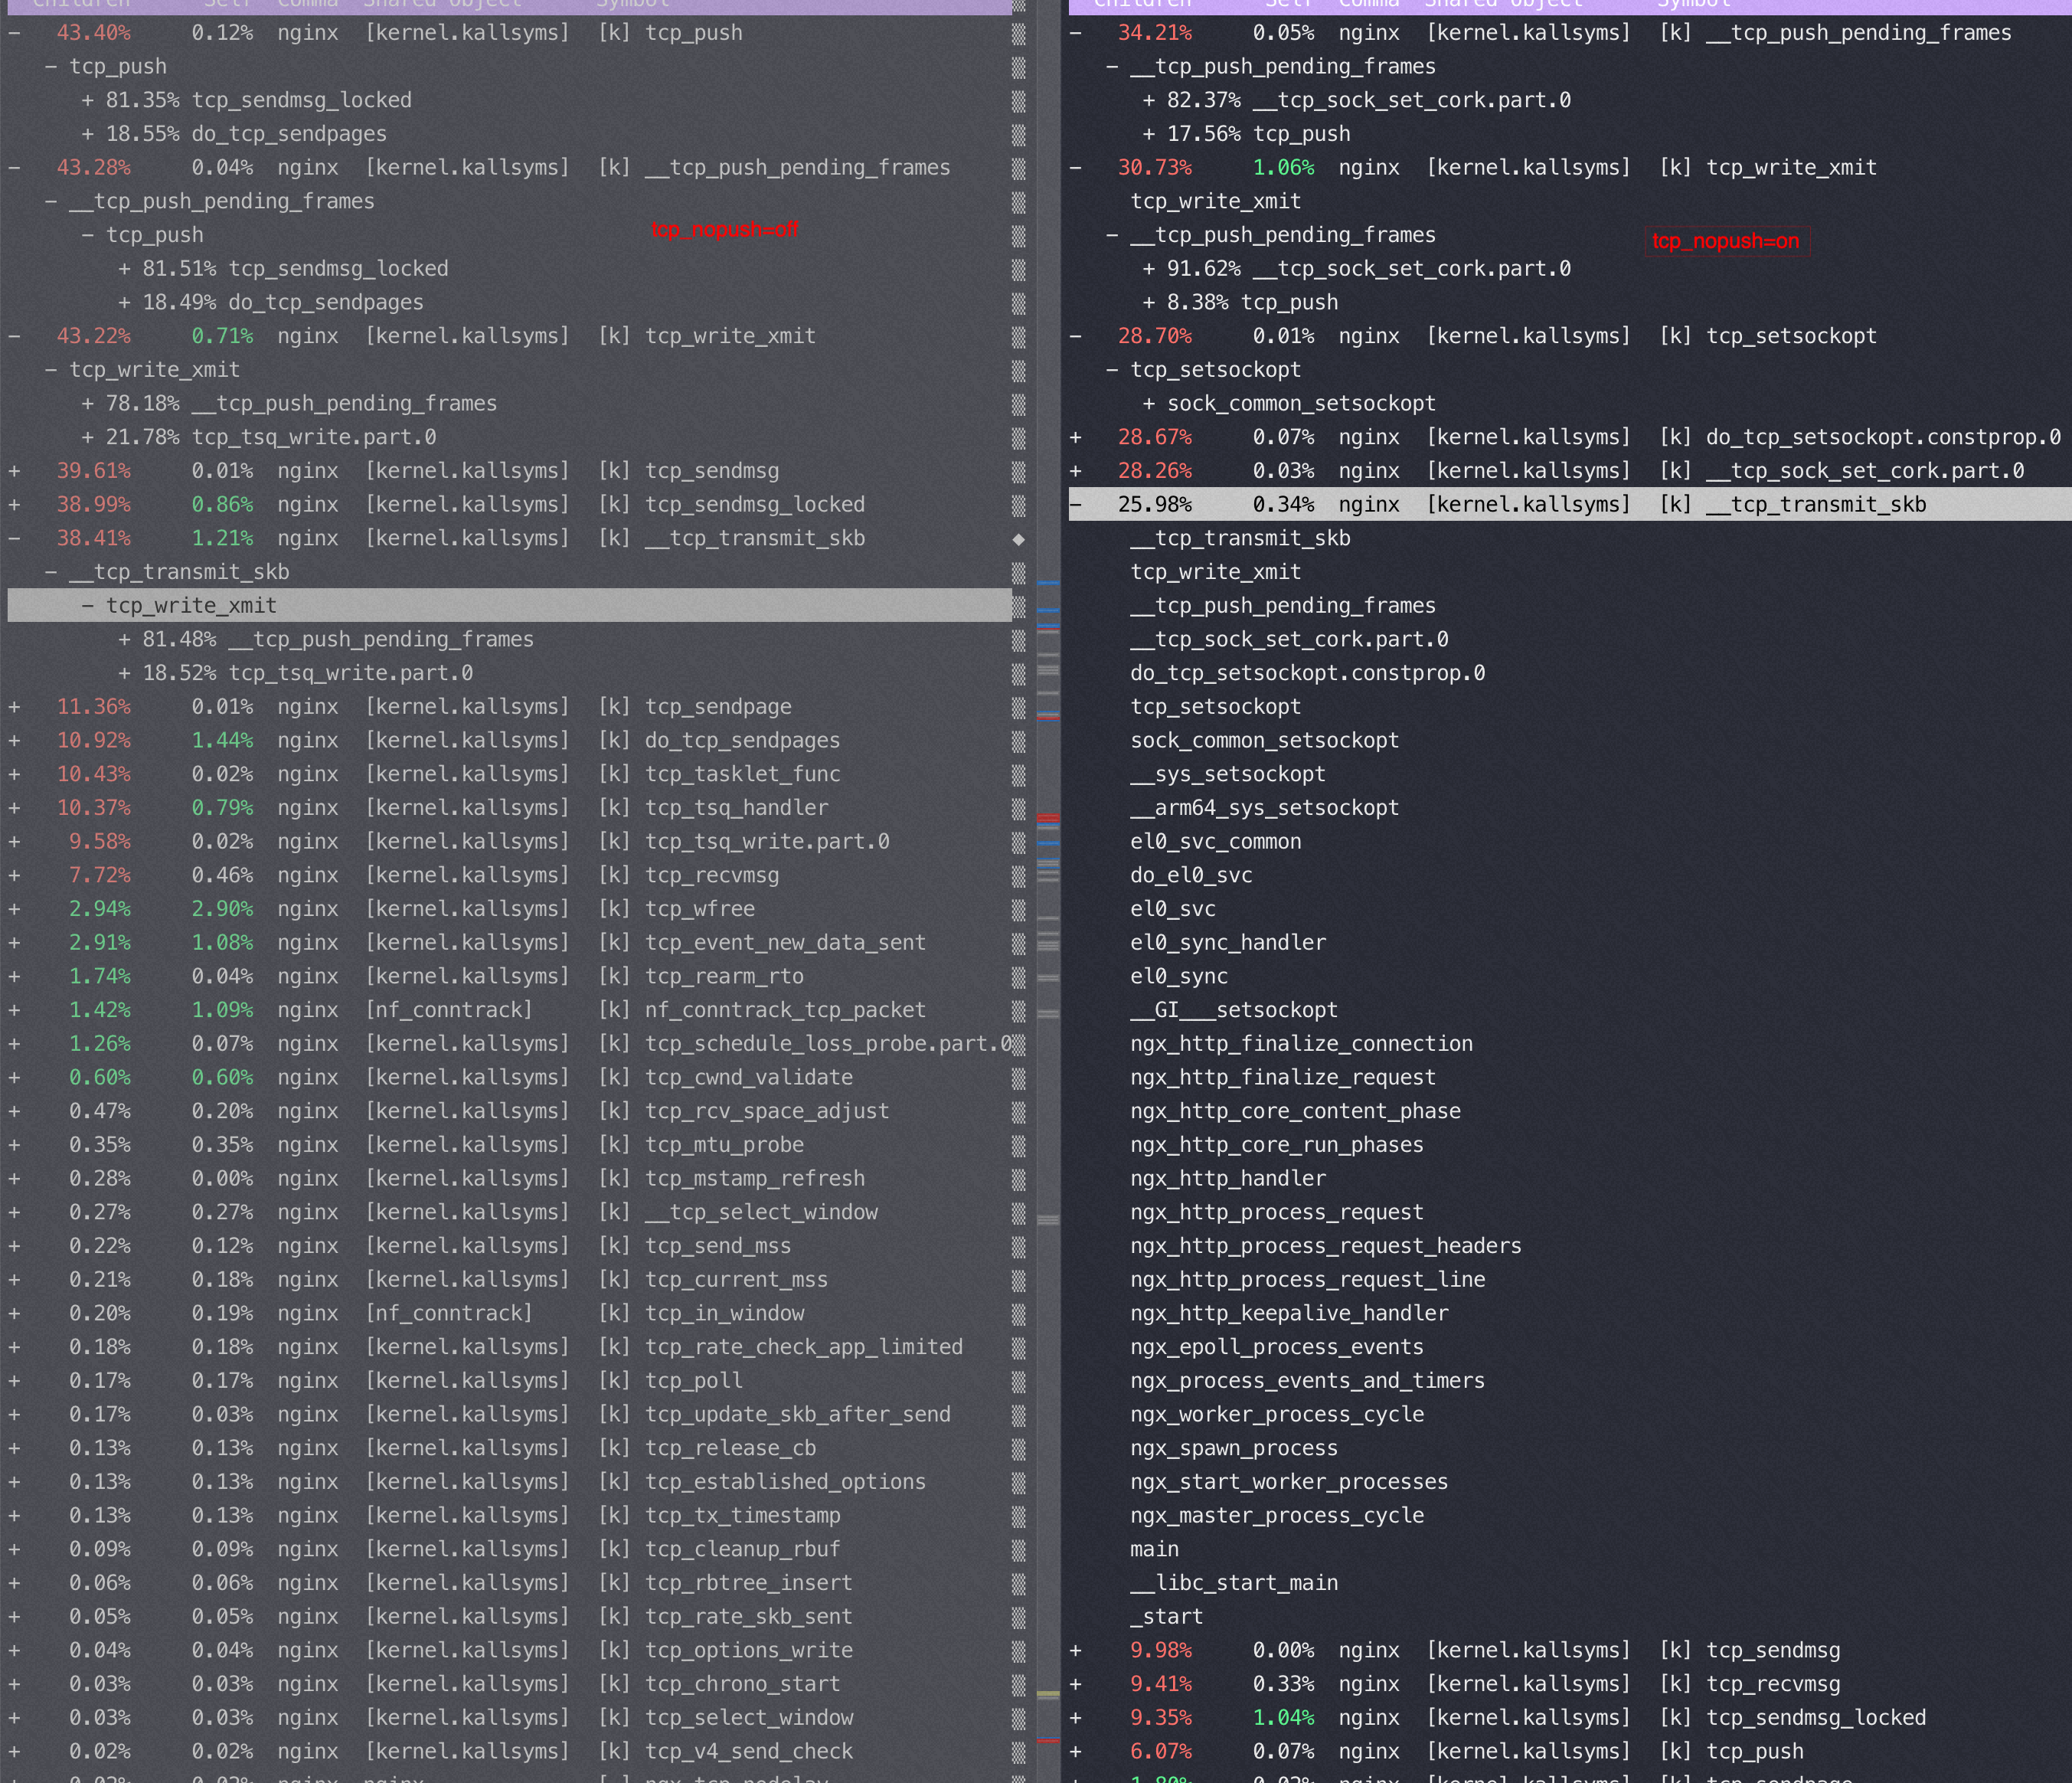
sendfile 和 tcp_nopush
tcp_nopush 对性能的影响
M上,返回很小的 html页面,如果 tcp_nopush=on 性能能有20%的提升,并且开启后 si% 使用率从10%降到了0. Tcp_nodelay=on 就基本对性能没啥影响
TCP_NOPUSH 是 FreeBSD 的一个 socket 选项,对应 Linux 的 TCP_CORK,Nginx 里统一用
tcp_nopush来控制它。启用它之后,数据包会累计到一定大小之后才会发送,减小了额外开销,提高网络效率。To keep everything logical, Nginx tcp_nopush activates the TCP_CORK option in the Linux TCP stack since the TCP_NOPUSH one exists on FreeBSD only.
nginx on M 8核,http 长连接,访问极小的静态页面(AMD 上测试也是 sendfile off 性能要好30%左右)
| tcp_nopush on | tcp_nopush off | |
|---|---|---|
| sendfile on | 46万(PPS 44万) | 37万(PPS 73万) |
| sendfile off | 49万(PPS 48万) | 49万(PPS 48万) |
问题:为什么 sendfile off 性能反而好?(PPS 明显低了)
答:一次请求Nginx要回复header+body, header在用户态内存,body走sendfile在内核态内存,nginx没有机会合并header+body, sendfile on后导致每次请求要回复两个tcp包。而 sendfile off的时候虽然有用户态内核态切换、copy,但是有机会把 header/body 合并成一个tcp包
从抓包来看,sendfile on的时候每次 http get都是回复两个包:1) http 包头(len:288)2)http body(len: 58)
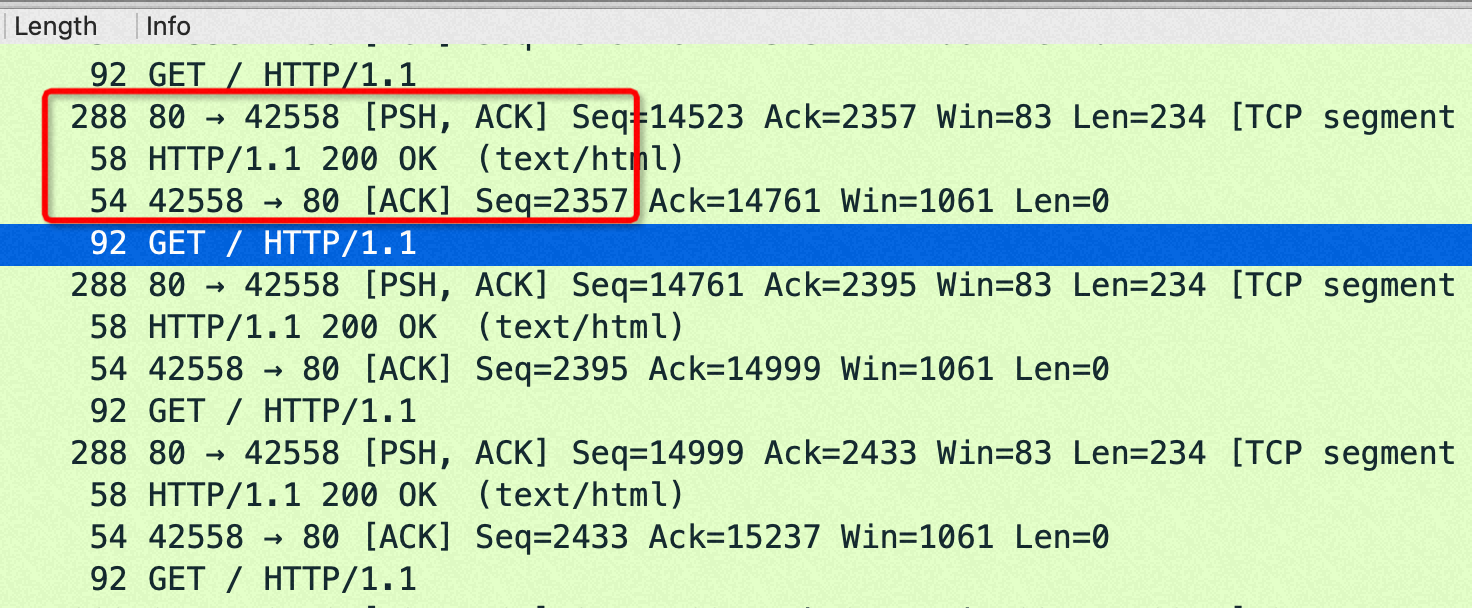
sendfile off的时候每次 http get都是回复一个包: http 包头+body(len:292=288+4)
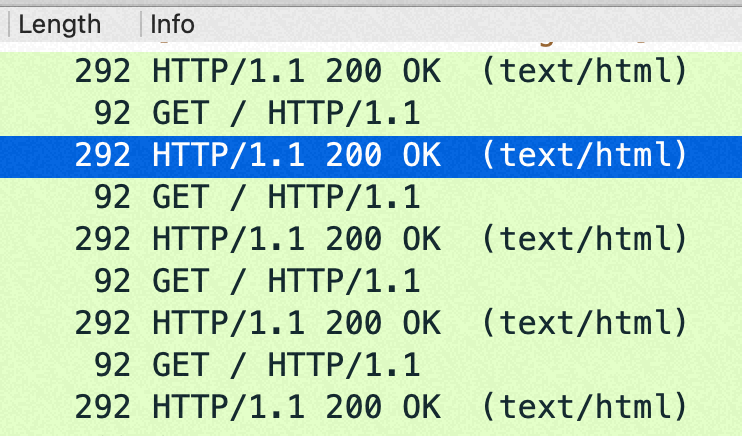
在这个小包场景,如果sendfile=off 后,回包在http层面就已经合并从1个了,导致内核没机会再次 cork(合并包);如果sendfile=on 则是每次请求回复两个tcp包,如果设置了 nopush 会在内核层面合并一次。
如果不是访问磁盘上的静态页面,而是直接 return某个内存的内容的话,sendfile on/off 对性能没有影响,原理也如上,不需要访问磁盘,也就没有机会分两个包发送包头和body了。
分析参考数据
以下数据都是变换不同的 sendfile、tcp_nopush等组合来观察QPS、setsockopt、PPS来分析这些参数起了什么作用
1 | //tcp_nopush off; QPS 37万 很明显 pps 比46万高了将近1倍,这是因为 tcp_cork 合并了小包 |
This behavior is confirmed in a comment from the TCP stack source about TCP_CORK:
When set indicates to always queue non-full frames. Later the user clears this option and we transmit any pending partial frames in the queue. This is meant to be used alongside sendfile() to get properly filled frames when the user (for example) must write out headers with a write() call first and then use sendfile to send out the data parts. TCP_CORK can be set together with TCP_NODELAY and it is stronger than TCP_NODELAY.
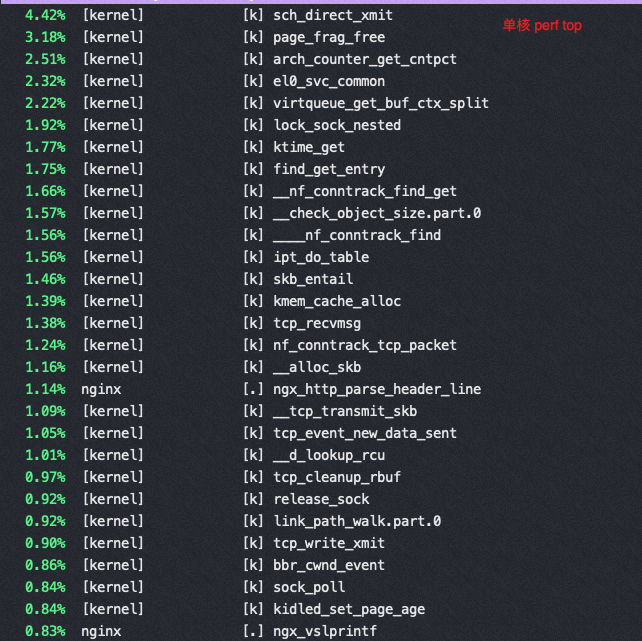
perf top 数据
以下都是 sendfile on的时候变换 tcp_nopush 参数得到的不同 perf 数据
tcp_nopush=off:(QPS 37万)
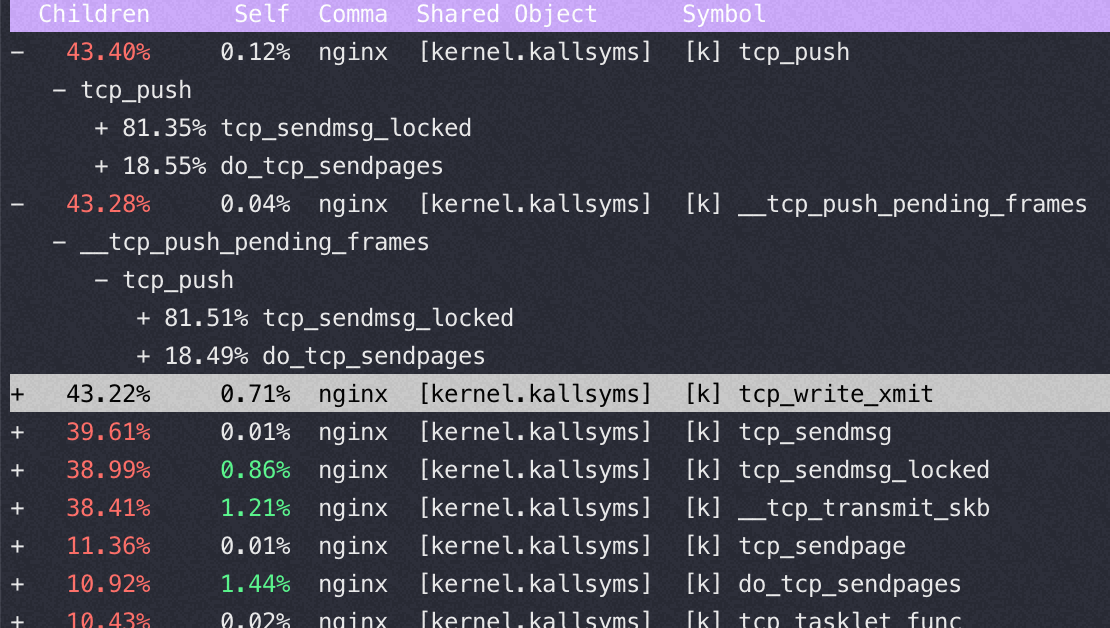
tcp_nopush=on:(QPS 46万)
对比一下,在sendfile on的时候,用不同的push 参数对应的 tcp 栈
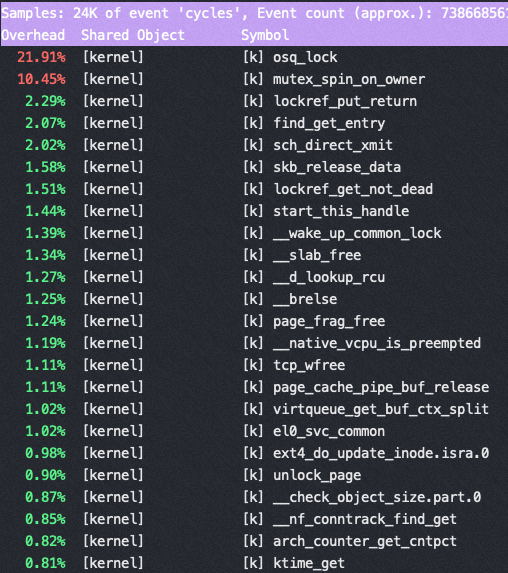
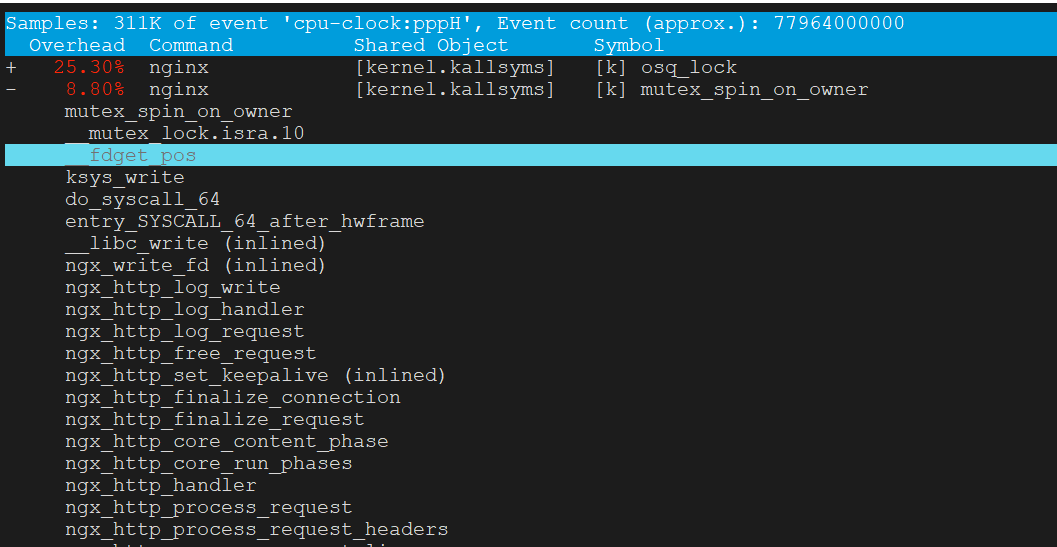
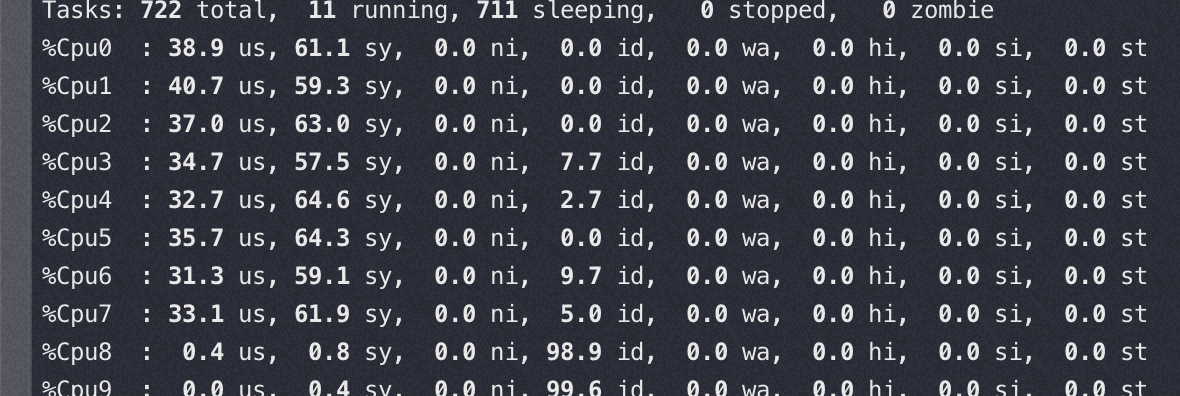
Nginx 在16核后再增加核数性能提升很少的分析
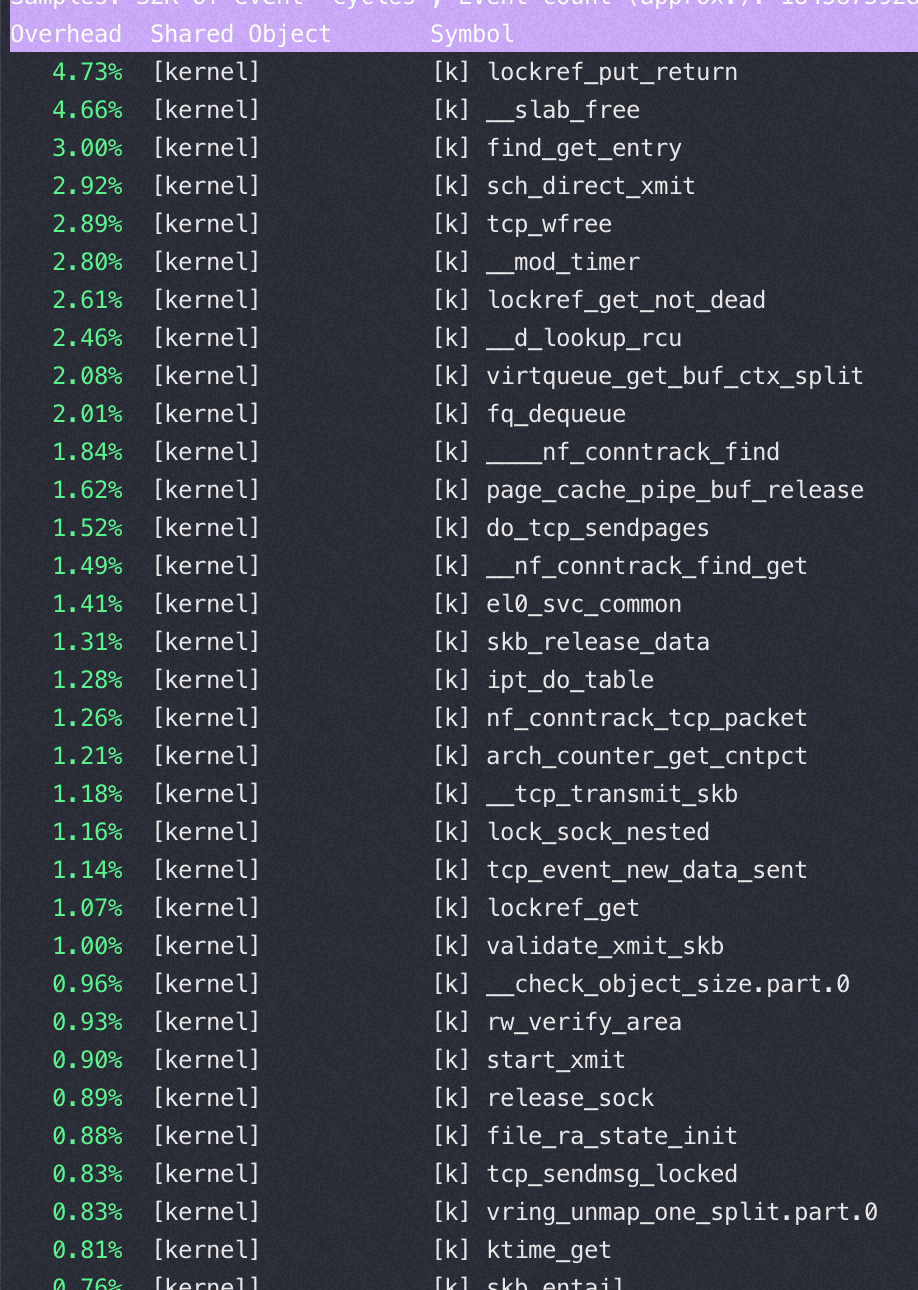
16核 perf top
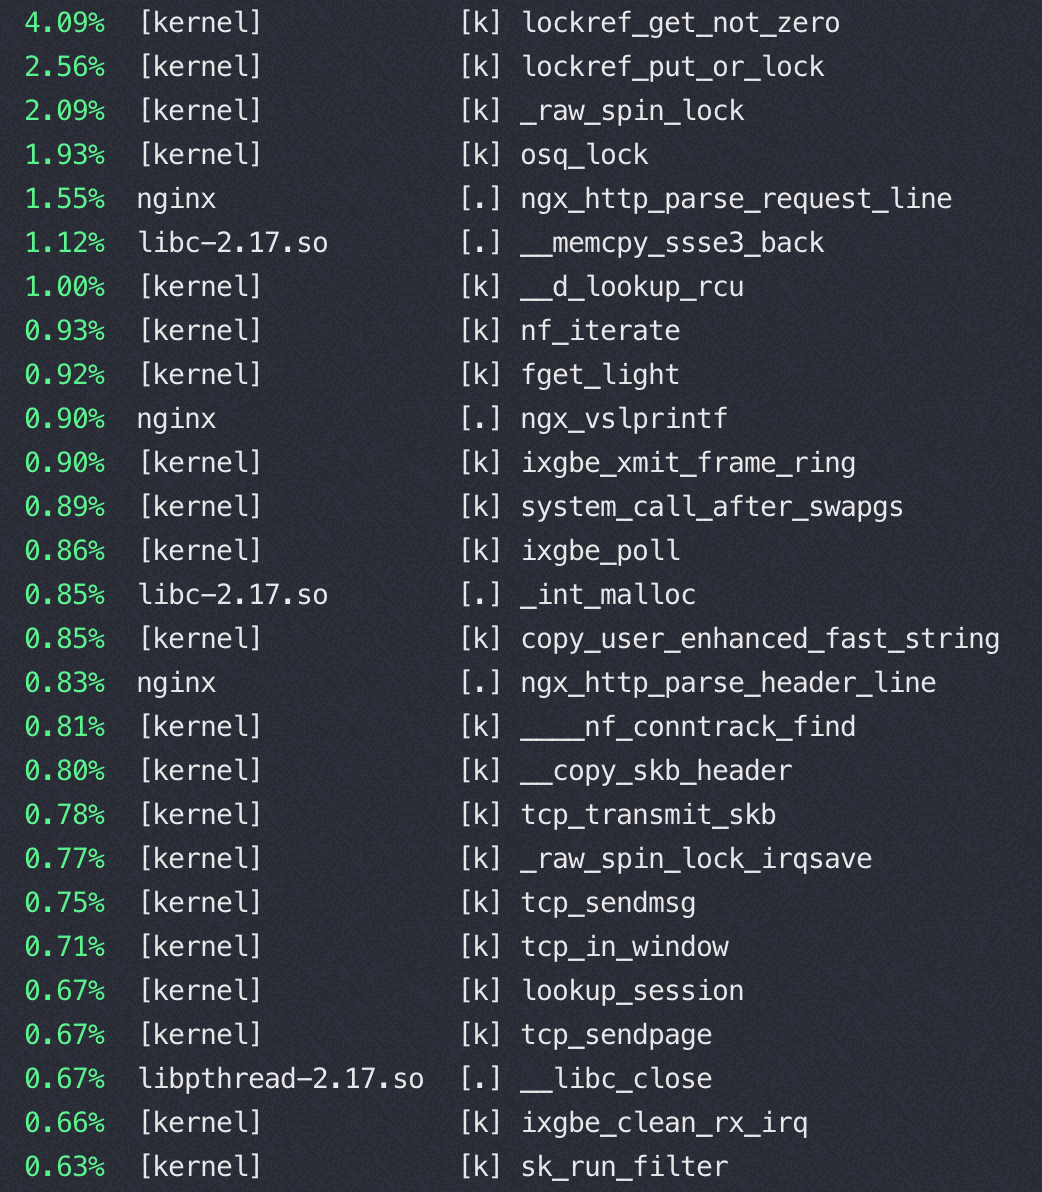
32核 perf top
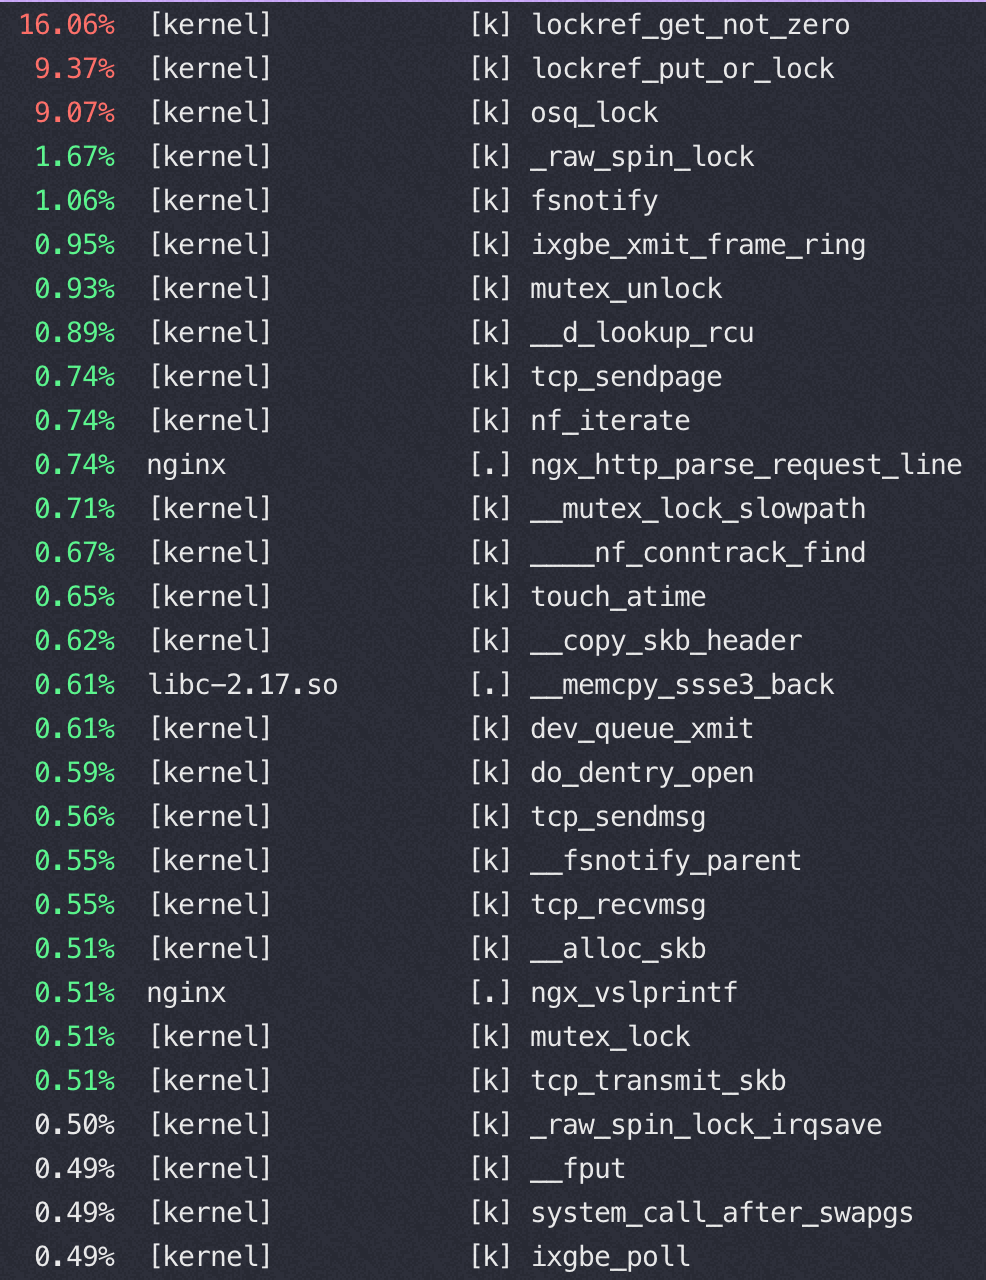
从以上两个perf top 对比可以看到内核锁消耗增加非常明显
这是因为读写文件锁 osq_lock ,比如nginx需要写日志访问 access.log,需要加锁
osq(optimistci spinning queue)是基于MCS算法的一个具体实现,osq_lock 是Linux 中对MCS的实现
1 | location / { |
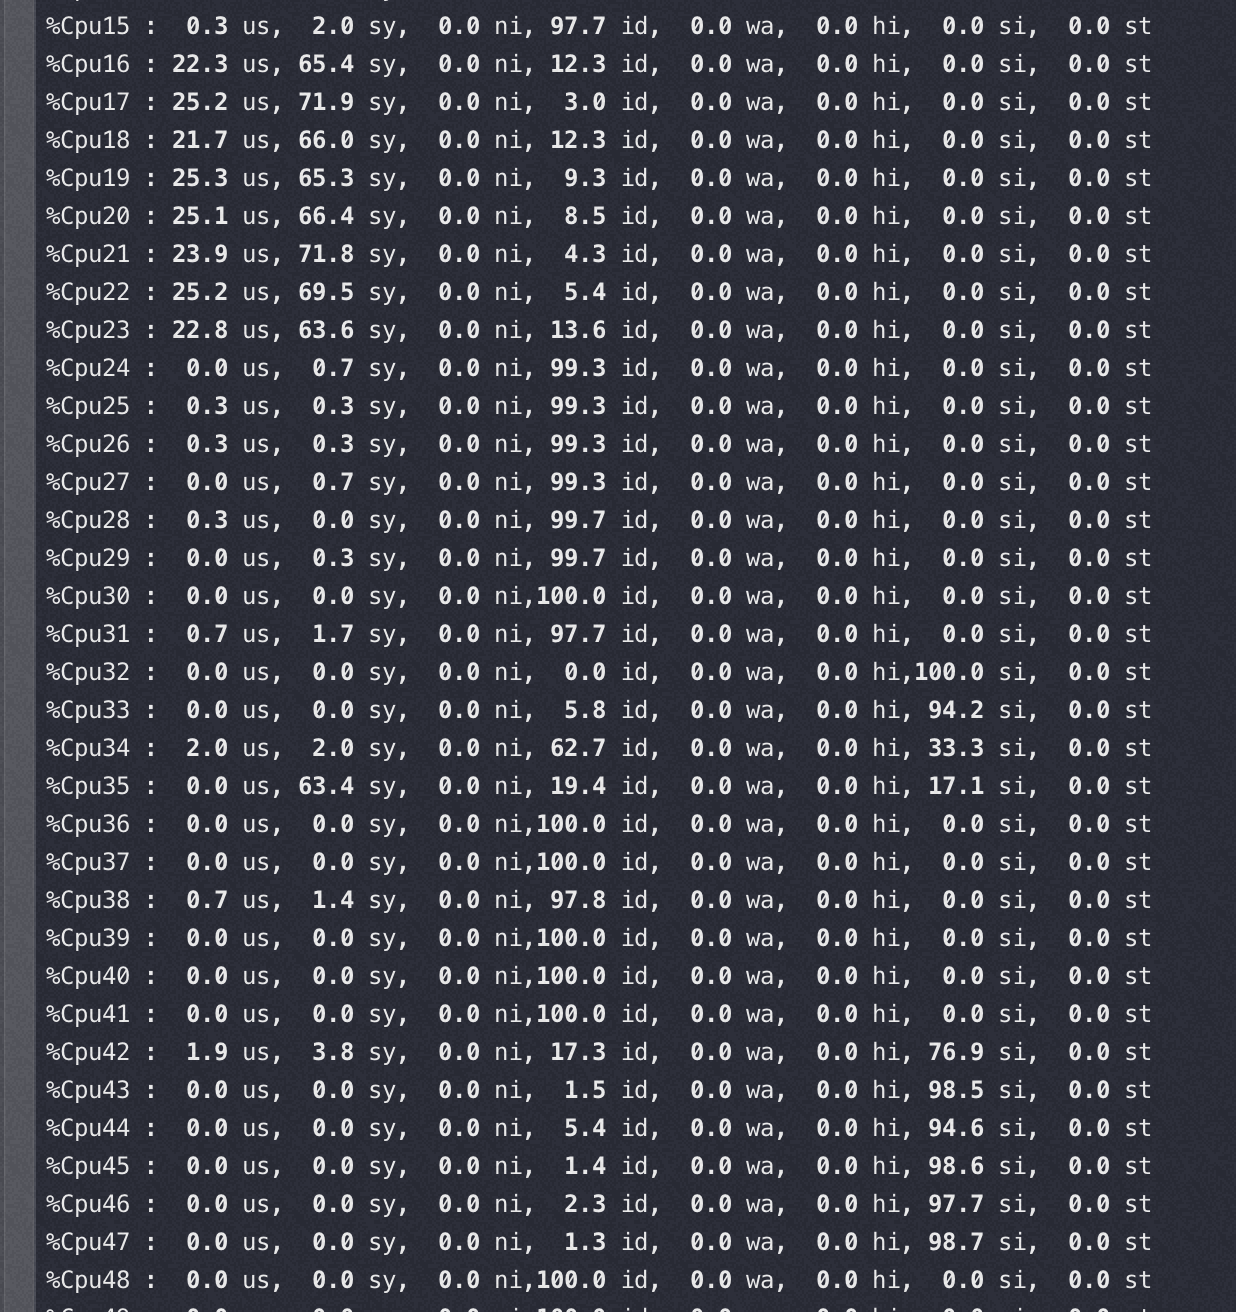
ARM下这个瓶颈更明显
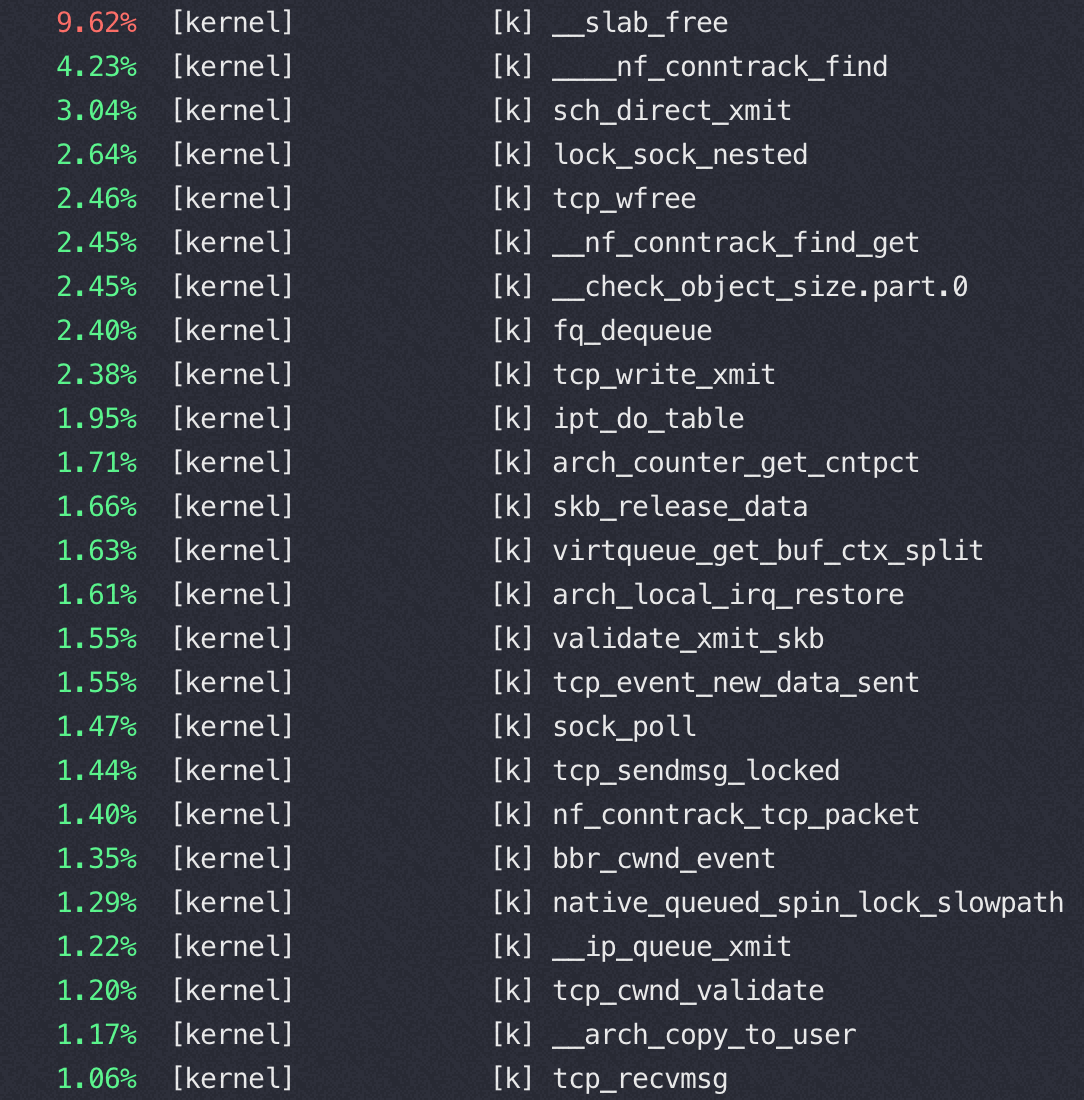
M上用40-64 core 并发的时候 perf top都是如下图,40 core以上网络瓶颈,pps 达到620万(离ECS规格承诺的1200万还很远),CPU压不起来了
1 | #tsar --traffic -i1 --live |
文件锁的竞争
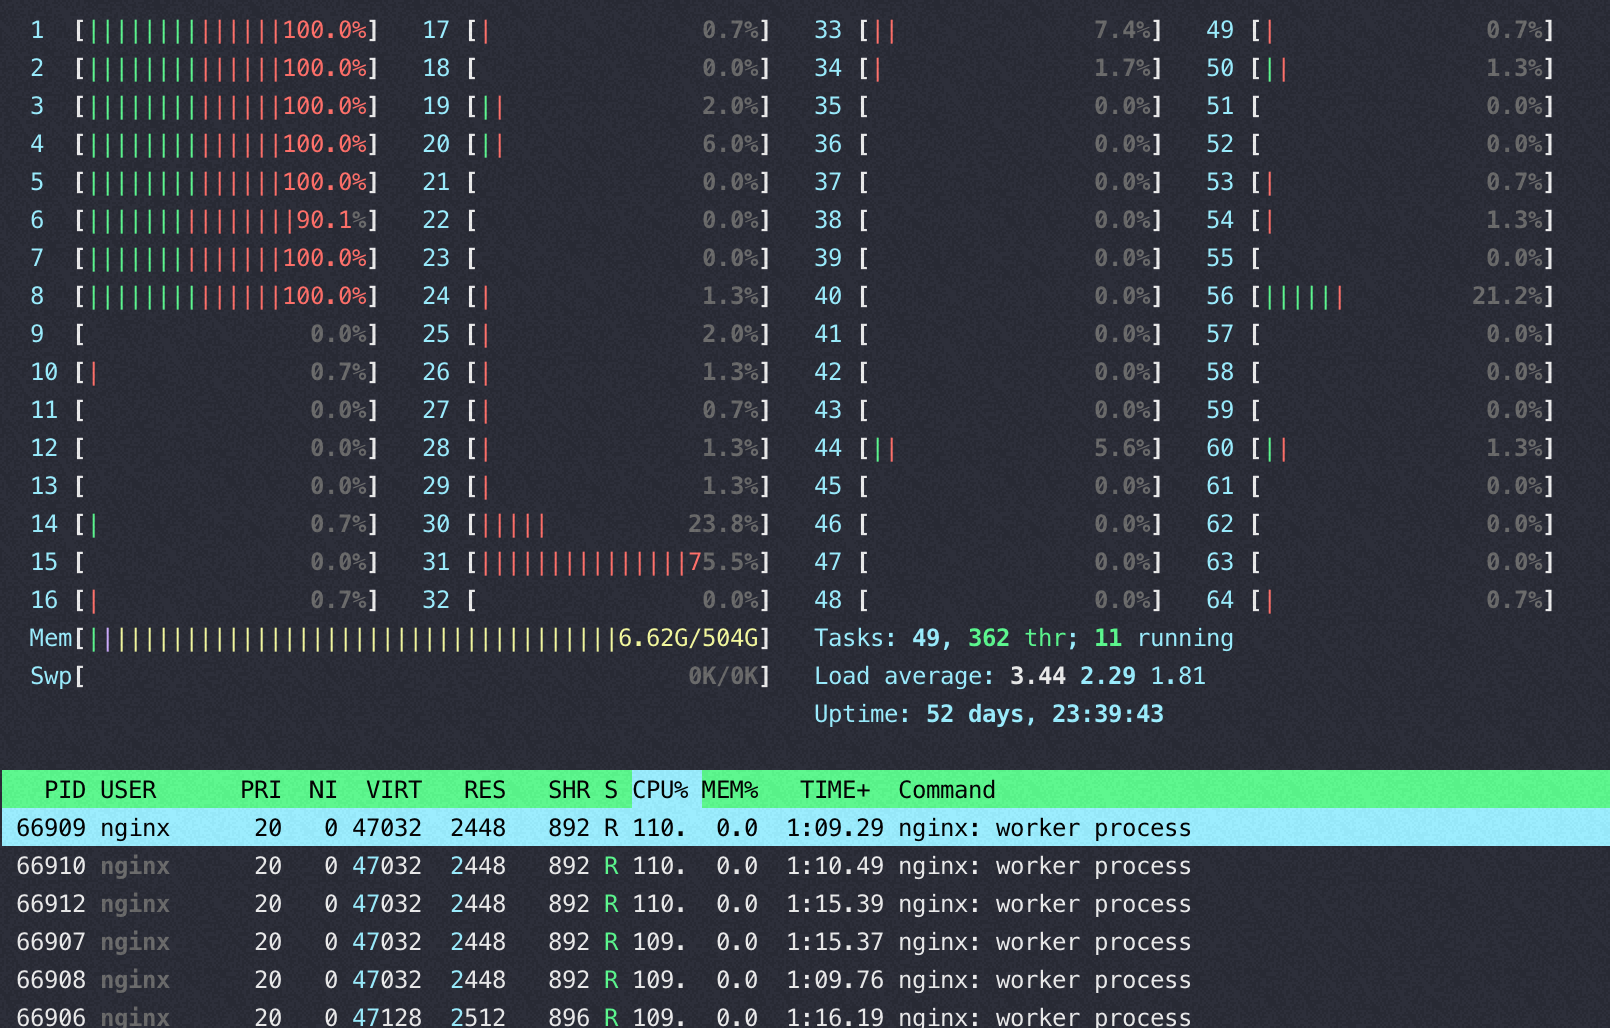
Nginx 在M 上使用 16 core的时候完全压不起来,都是内核态锁竞争,16core QPS 不到23万,线性能力很差(单核68000)
从下图可以看到 sys 偏高,真正用于 us 的 CPU 太少,而内核态 CPU 消耗过高的是 osq_lock(写日志文件锁相关)
16核对应的perf状态
1 | Performance counter stats for process id '49643': |
软中断和 nginx 所在 node 关系
以下两种情况的软中断都绑在 32-47 core上
软中断和 nginx 在同一个node,这时基本看不到多少 si%
软中断和 nginx 跨node(性能相当于同node的70-80%), 软中断几乎快打满 8 个核了,同时性能还差
网络描述符、数据缓冲区,设备的关系
网络描述符的内存分配跟着设备走(设备插在哪个node 就就近在本 node 分配描述符的内存), 数据缓冲区内存跟着队列(中断)走, 如果队列绑定到DIE0, 而设备在DIE1上,这样在做DMA通信时, 会产生跨 DIE 的交织访问.
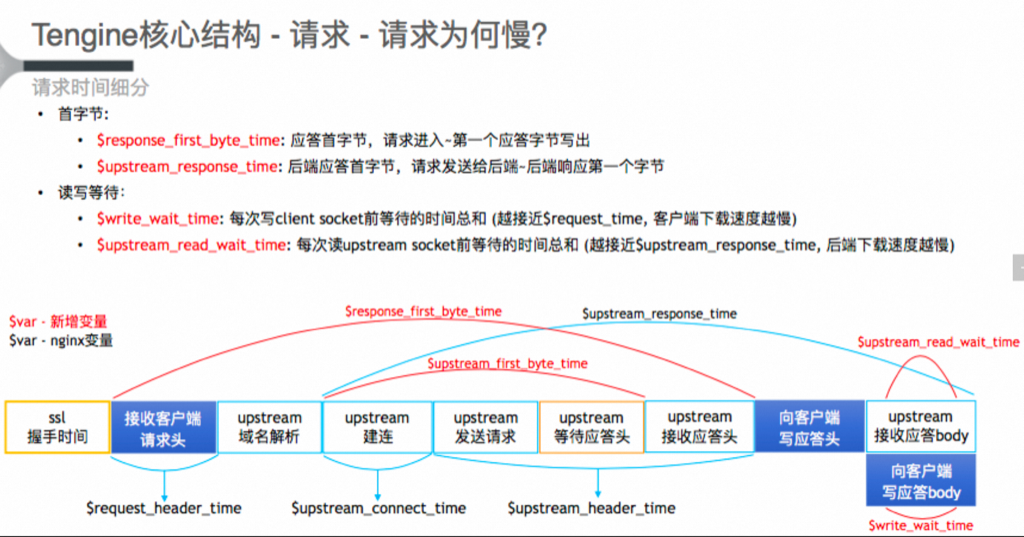
Nginx处理HTTP的生命周期
Nginx将HTTP处理分成了11个阶段。下面的阶段,按顺序执行
| 阶段名称 | 阶段作用 | 涉及的模块Moduel | Moduel作用 |
|---|---|---|---|
| POST_READ | 接收到完整的http头部后处理的阶段,在uri重写之前。一般跳过 | realip | 读取客户端真实IP信息,用于限流等 |
| SERVER_RERITE | location匹配前,修改uri的阶段,用于重定向,location块外的重写指令(多次执行) | rewrite | 重定向 |
| FIND_CONFIG | uri寻找匹配的location块配置项(多次执行) | find_config | 根据URI寻找匹配的localtion块配置 |
| REWRITE | 找到location块后再修改uri,location级别的uri重写阶段(多次执行) | rewrite | 重定向 |
| POST_WRITE | 防死循环,跳转到对应阶段 | / | / |
| PREACCESS | 权限预处理 | limt_conn | 限制处理请求的速率,还可以设置桶的大小,是否延迟等参数 |
| limit_req | 限制连接和请求数 | ||
| ACCESS | 判断是否允许这个请求进入 | auth_basic | 实现简单的用户名、密码登录 |
| access | 支持配置allow\deny等指令 | ||
| auth_request | 将请求转发到第三方认证服务器上 | ||
| POST_ACCESS | 向用户发送拒绝服务的错误码,用来响应上一阶段的拒绝 | / | / |
| PRECONTENT | 服务器响应内容之前向响应内容添加一些额外的内容。 | try_files | 匹配配置的多个url地址 |
| mirrors | 复制一个相同的子请求,例如生产流量复制 | ||
| CONTENT | 内容生成阶段,该阶段产生响应,并发送到客户端 | concat | 如果访问多个小文件,可在一次请求上返回多个小文件内容 |
| random_index,index, auto_index | 显示location下目录或目录下的index.html文件的配置 | ||
| static | 通过absolute_redirect等指令设置重定向的Location等 | ||
| LOG | 记录访问日志 | log | 配置日志格式,存储位置等 |
也可以通过源码ngx_module.c 中,查看到ngx_module_name,其中包含了在编译 Nginx 的时候的 with 指令所包含的所有模块,它们之间的顺序非常关键,在数组中顺序是相反的。
总结
要考虑软中断、以及网卡软中断队列数量对性能的影响
sendfile不一定导致性能变好了
参考资料
完善的Nginx在AWS Graviton上的测试报告https://armkeil.blob.core.windows.net/developer/Files/pdf/white-paper/guidelines-for-deploying-nginx-plus-on-aws.pdf