nginx性能和软中断
问题
- 如何调整软中断才能达到最优性能?
- 通过 top 观察软中断 和 si%、sy% 的关系
测试机型
双路 Intel(R) Xeon(R) CPU E5-2682 v4 sh
两块万兆网卡:Intel Corporation 82599ES 10-Gigabit SFI/SFP+ Network Connection (rev 01)
内核:3.10.0-327
1
2
| NUMA node0 CPU(s): 0-15,32-47
NUMA node1 CPU(s): 16-31,48-63
|
软中断和 si%
压nginx 碰到一个奇怪的问题,将软中断绑到48-63核,如果nginx绑到这个socket下的其它核比如 16-23,我就基本上看不到 si% 的使用率;如果所有条件都不变我将nginx 绑0-7core(另外一个socket),那么我能看到0-7 core上的软中断 si%使用率达到600%以上(8core累加)。 si%使用率应该只和 PPS、流量相关,这个测试中不同绑核nginx的QPS 差了20%以内。
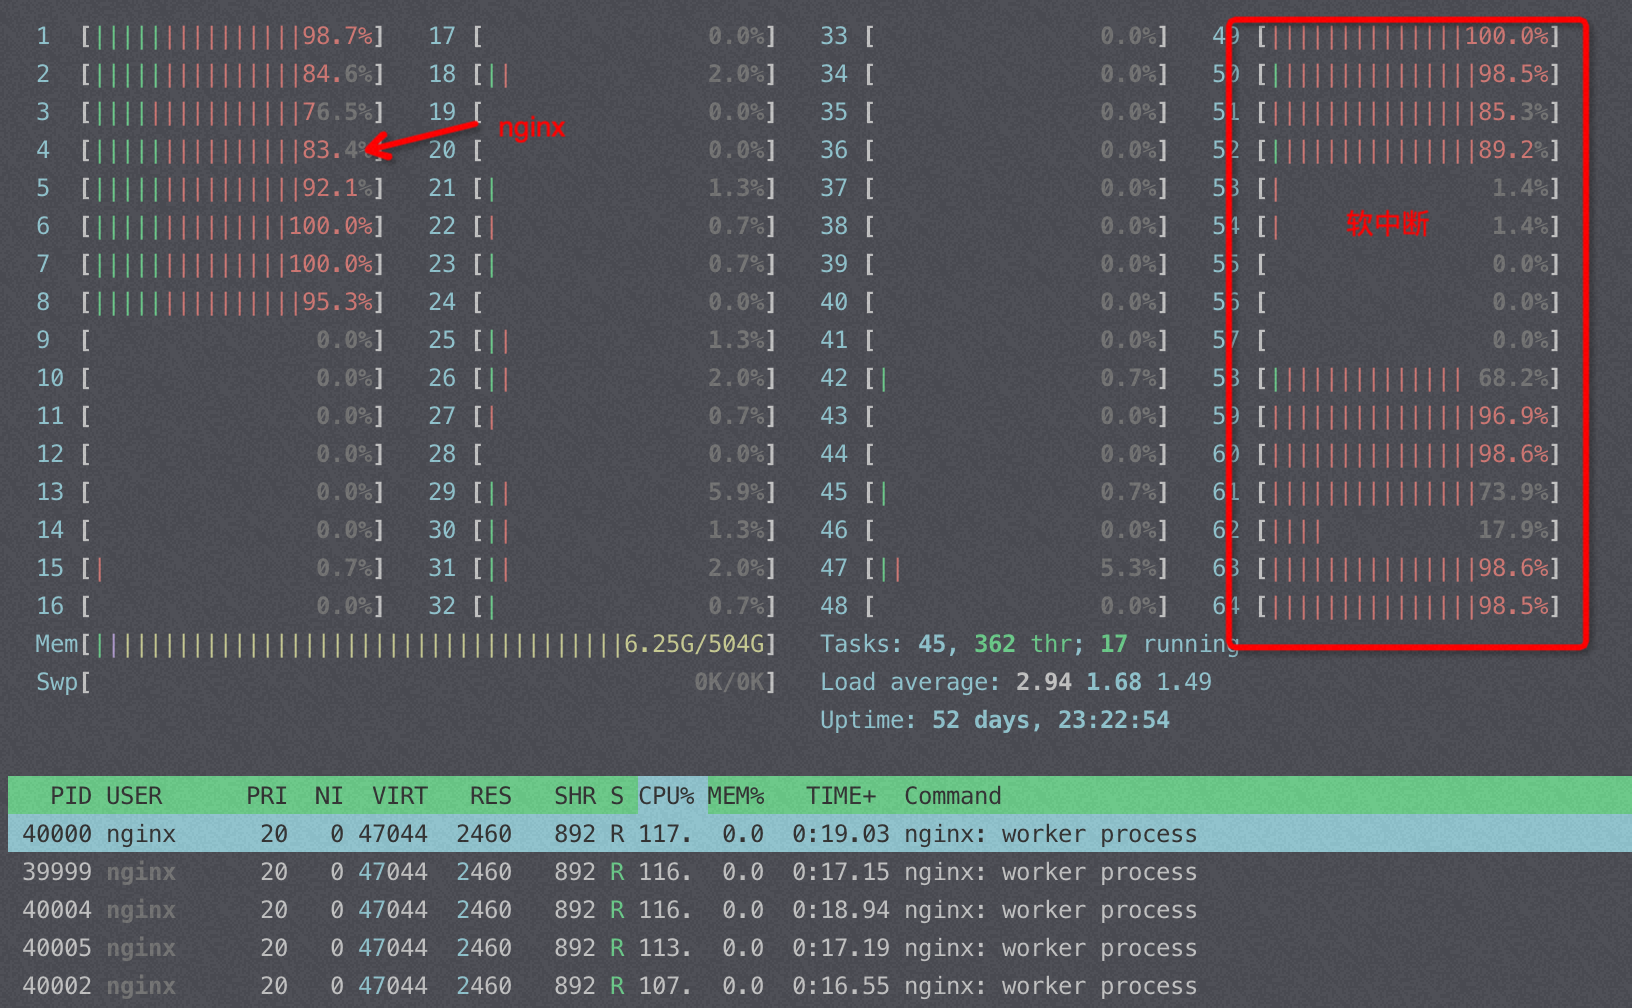
CPU是intel E5,网卡插在node0上
1
2
3
4
5
| Model name: Intel(R) Xeon(R) CPU E5-2682 v4 @ 2.50GHz
NUMA node0 CPU(s):     0-15,32-47
NUMA node1 CPU(s):     16-31,48-63
软中断绑定:IRQBALANCE_BANNED_CPUS=0000ffff,ffffffff
|
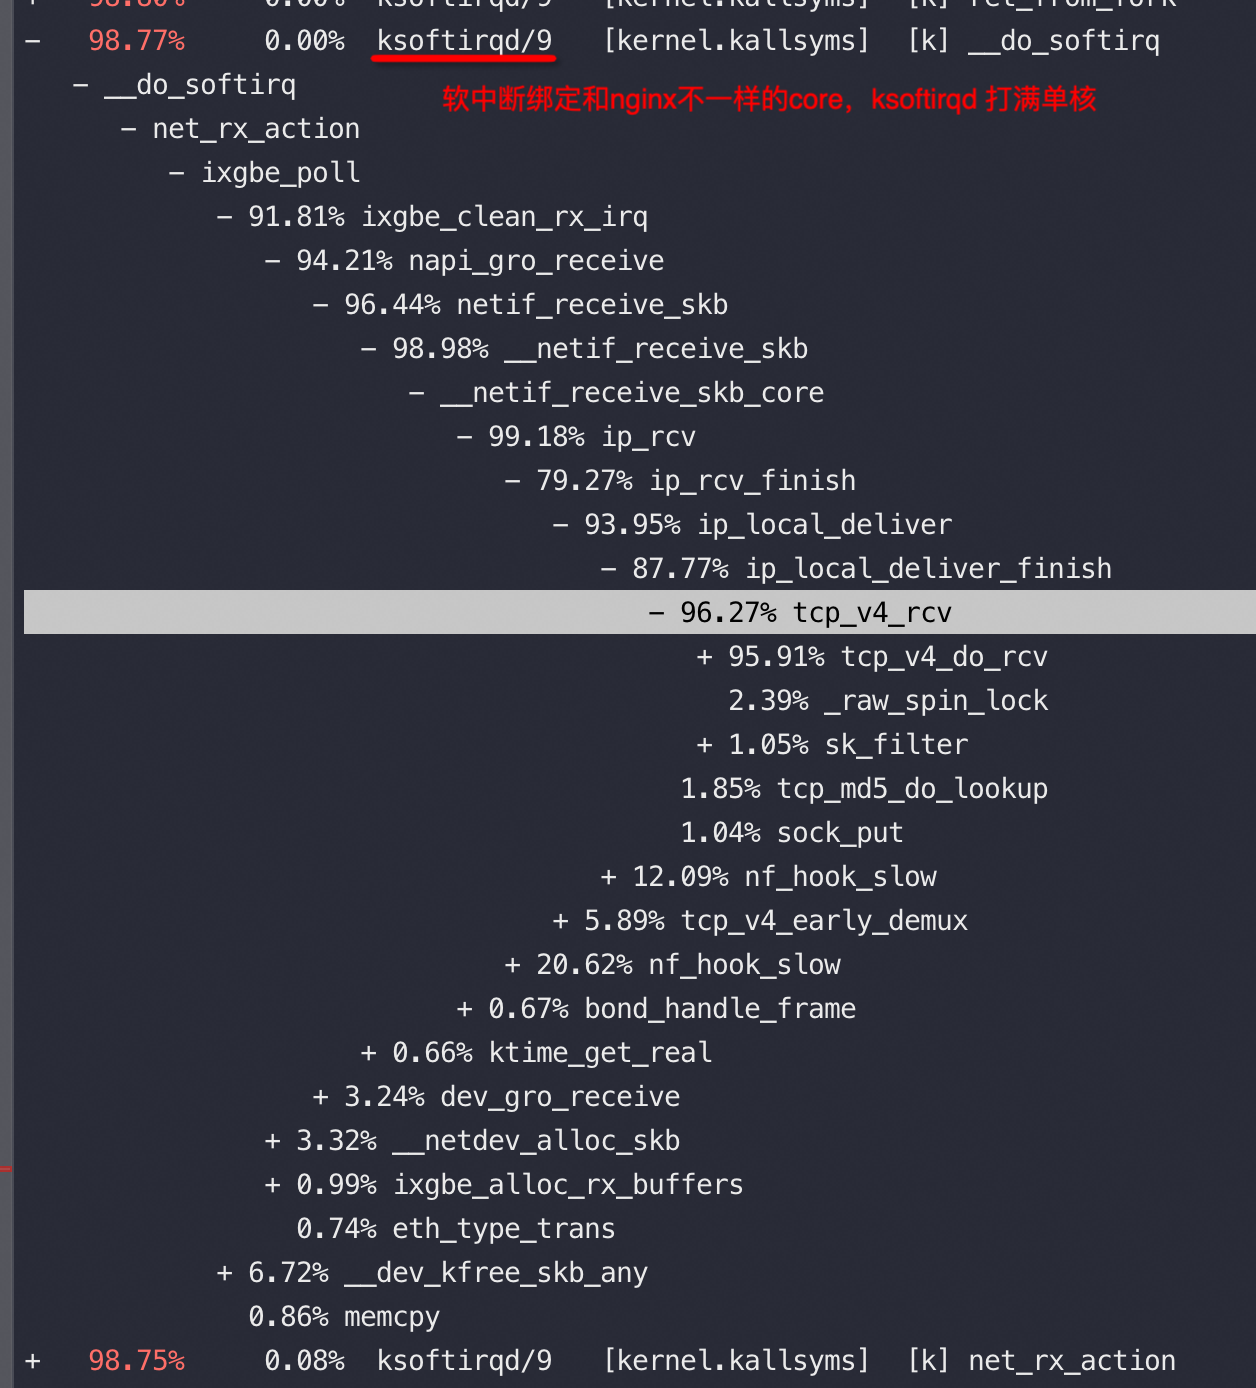
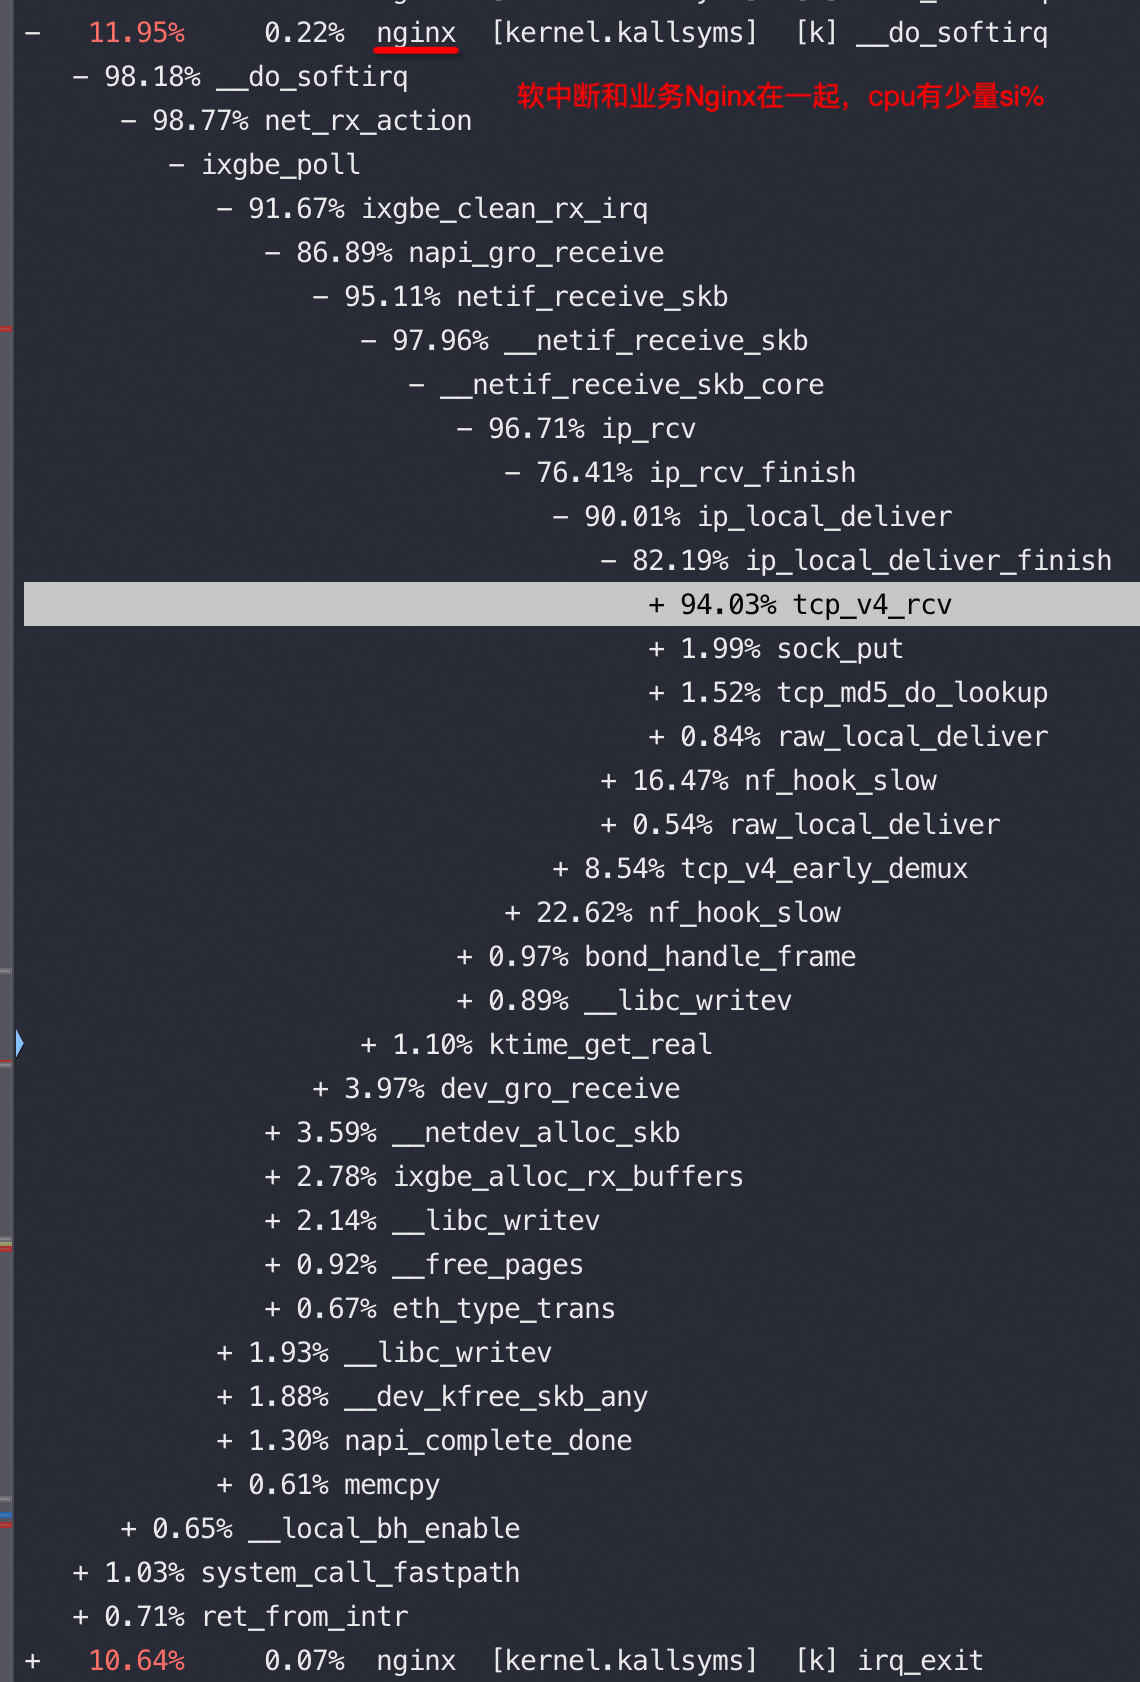
默认业务进程调用内核软中断do_softirq等来处理收发包,不需要跨core,如果将软中断绑定到具体的core后,会触发ksoftirqd 来调用do_softirq来处理收发包,整体上肯定效率不如同一个core处理业务和软中断的效率高。进一步如果软中断跨socket绑定导致处理时长进一步升高、总效率更差
https://askubuntu.com/questions/7858/why-is-ksoftirqd-0-process-using-all-of-my-cpu
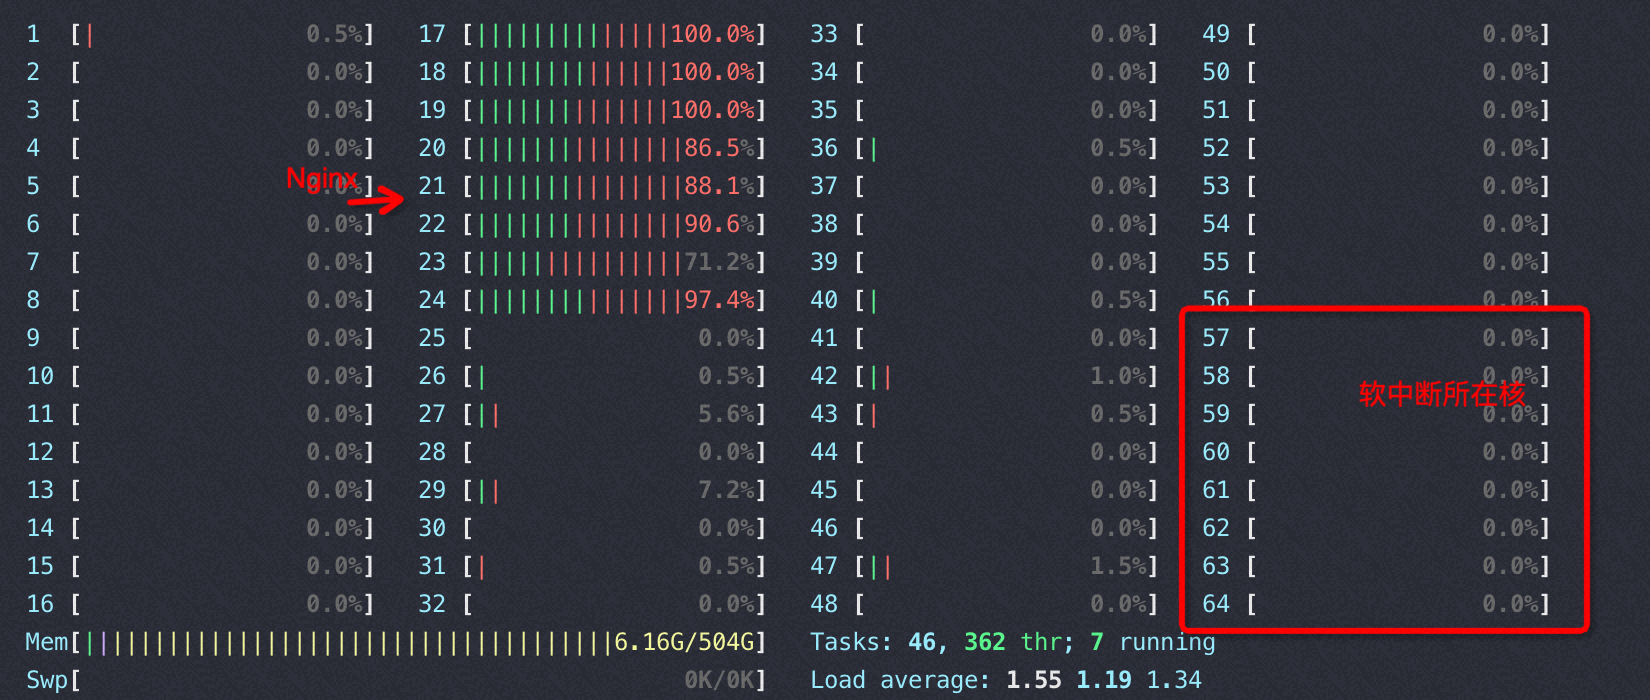
下图场景下,收包没有占用 si,而是占用的 sy
将软中断和业务进程拆开绑核,均将软中断、业务基本压满的情况下,如果软中断在本node,QPS 增加20%+
软中断打满单核后的IPC:
1
2
3
4
5
6
7
8
9
10
11
12
13
14
15
16
17
18
19
20
21
22
23
24
25
26
27
28
29
30
31
| #perf stat --cpu 29 //软中断所在core,si%=100%,和业务以及网卡跨node
Performance counter stats for 'CPU(s) 29':
4470.584807 task-clock (msec) # 1.001 CPUs utilized (100.00%)
252 context-switches # 0.056 K/sec (100.00%)
8 cpu-migrations # 0.002 K/sec (100.00%)
3 page-faults # 0.001 K/sec
11,158,106,237 cycles # 2.496 GHz (100.00%)
<not supported> stalled-cycles-frontend
<not supported> stalled-cycles-backend
7,976,745,525 instructions # 0.71 insns per cycle (100.00%)
1,444,740,326 branches # 323.166 M/sec (100.00%)
7,073,805 branch-misses # 0.49% of all branches
4.465613433 seconds time elapsed
#perf stat --cpu 1 //软中断所在core,si%=100%,和业务以及网卡跨node
Performance counter stats for 'CPU(s) 1':
5132.639092 task-clock (msec) # 1.002 CPUs utilized (100.00%)
1,119 context-switches # 0.218 K/sec (100.00%)
6 cpu-migrations # 0.001 K/sec (100.00%)
0 page-faults # 0.000 K/sec
12,773,996,227 cycles # 2.489 GHz (100.00%)
<not supported> stalled-cycles-frontend
<not supported> stalled-cycles-backend
12,457,832,798 instructions # 0.98 insns per cycle (100.00%)
2,243,820,953 branches # 437.167 M/sec (100.00%)
12,769,358 branch-misses # 0.57% of all branches
5.124937947 seconds time elapsed
|
Nginx业务进程的IPC
1
2
3
4
5
6
7
8
9
10
11
12
13
14
15
16
17
18
19
20
21
22
23
24
25
26
27
28
29
30
31
32
33
| #perf stat -p 30434 //软中断跨node
Performance counter stats for process id '30434':
6838.088642 task-clock (msec) # 0.953 CPUs utilized (100.00%)
19,664 context-switches # 0.003 M/sec (100.00%)
0 cpu-migrations # 0.000 K/sec (100.00%)
4 page-faults # 0.001 K/sec
17,027,659,259 cycles # 2.490 GHz (100.00%)
<not supported> stalled-cycles-frontend
<not supported> stalled-cycles-backend
14,315,679,297 instructions # 0.84 insns per cycle (100.00%)
2,919,774,303 branches # 426.987 M/sec (100.00%)
34,643,571 branch-misses # 1.19% of all branches
7.176493377 seconds time elapsed
#perf stat -p 30434 //软中断和nginx、网卡在同一node
^C
Performance counter stats for process id '30434':
5720.308631 task-clock (msec) # 0.979 CPUs utilized (100.00%)
11,513 context-switches # 0.002 M/sec (100.00%)
1 cpu-migrations # 0.000 K/sec (100.00%)
0 page-faults # 0.000 K/sec
14,234,226,577 cycles # 2.488 GHz (100.00%)
<not supported> stalled-cycles-frontend
<not supported> stalled-cycles-backend
14,741,777,543 instructions # 1.04 insns per cycle (100.00%)
3,009,021,477 branches # 526.024 M/sec (100.00%)
35,690,882 branch-misses # 1.19% of all branches
5.845534744 seconds time elapsed
|
如果将nginx绑到node1(和网卡分开),同样再将软中断绑到node0、node1上,这个时候同样是软中断和业务在同一node性能要好,也就是软中断要和业务在一个node和网卡在哪里没关系。
网络包收发涉及两块内存分配:描述符(指针)和data buffer(存放网络包数据);
网卡的描述符、data buffer申请的内存都在设备所在的numa上, 如果将队列的中断绑定到其他cpu上, 那么队列申请的data buffer的节点也会跟着中断迁移,但是描述符是和网卡所在的node绑定不会迁移的。
Top 看到的 ksoftirqd 占用cpu不高,但是去看对应的 CPU core si消耗比较高,这是因为 ksoftirqd 只是触发软中断后的入口,进而会调用do_softirq/net_rx_action 等内核函数,在 si% 的消耗中包含了这些被调用的消耗
总结
软中断绑定优先让irqbalance自己决定,默认系统倾向于自动在业务中调用软中断,代价最低
尽量不要让包溢出net.core.netdev_budget,溢出后触发ksoftirqd 来处理效率更低
尽量控制不要让 ksoftirqd 打满,所以可以绑定更多core来