SystemStap、BCC、bpftrace
SystemStap、BCC、bpftrace
Linux 4.4+ 支持 eBPF。基于 eBPF 可以将任何内核函数调用转换成可带任何 数据的用户空间事件。bcc 作为一个更上层的工具使这个过程更加方便。内核探测 代码用 C 写,数据处理代码用 Python。
从 Linux 3.15 开始,BPF 被扩展成了 eBPF,extended BPF 的缩写。它从 2 个 32bit 寄存器扩展到了 10 个 64bit 寄存器,并增加了后向跳转。Linux 3.18 中又进行了进一 步扩展,将它从网络子系统中移出来,并添加了 maps 等工具。为了保证安全性又引入了一 个检测器,用于验证内存访问的合法性和可能的代码路径。如果检测器不能推断出程序会在 有限的步骤内结束,就会拒绝程序的注入(内核)。
SystemTap 是一个 tracing 系统,简单来说,它提供了一种领域特定语言(DSL),代码编译成内核模块,然后热加 载到运行中的内核。但出于安全考虑,一些生产系统禁止动态模块加载,例如我研究 eBPF 时所用的系统就不允许。
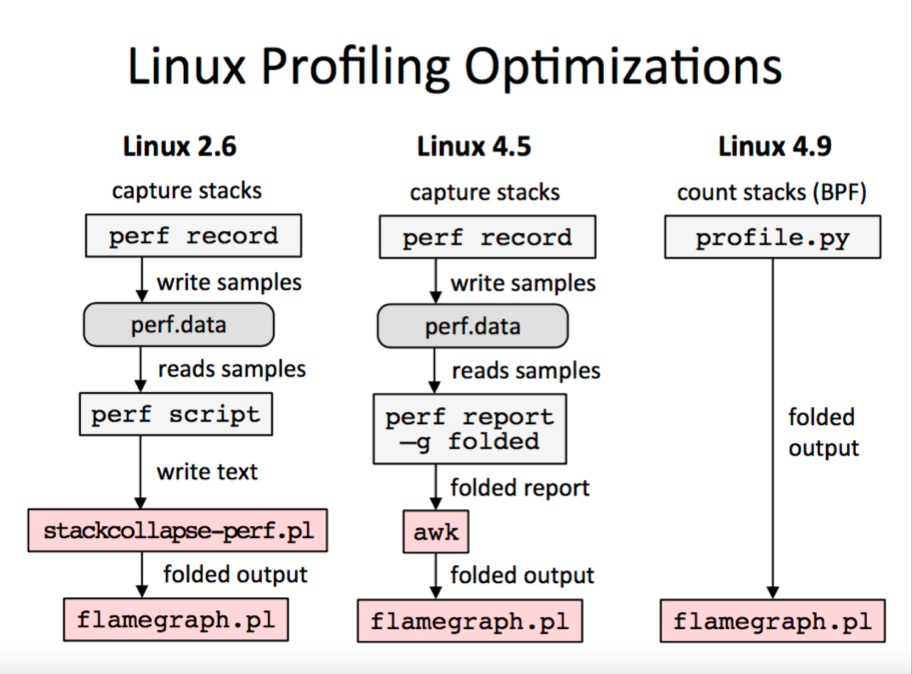
perf 是 Linux 上的最重要的性能分析工具之一。它和内核出自同一个源码树(source tree),但编译需要针对指定的内核版本。perf 可以跟踪内核,也可以跟踪用户程序, 还可用于采样或者设置跟踪点。可以把它想象成开销更低,但功能更强大的 strace。 本文只会使用非常简单的 perf 命令。想了解更多,强烈建议访问 Brendan Gregg的博客。
安装
sudo stap-prep //安装好systemtap所有依赖的(debugfs等等)
执行安装内核debug等等需要的一些包,然后才能运行systemtap
# 简单的脚本,打印4s内所有进程打开了哪些文件
#!/usr/bin/stap
probe begin
{
	log("begin to probe")
}

probe syscall.open
{
	printf ("%s(%d) open (%s)\n", execname(), pid(), argstr)
}

probe timer.ms(4000) # after 4 seconds
{
	exit ()
}

probe end
{
	log("end to probe")
}
主要需要两个包[“kernel-debuginfo”, “kernel-debuginfo-common”]
建议不要从yum装,可能会和内核小版本不同导致无法使用
1 获取内核的参数
uname -r
2 从下面的链接中取找对应内核的包
http://rpm.alibaba-inc.com/find.php?t=&os=&q=kernel-debuginfo&d=1&rid=1807
http://rpm.alibaba-inc.com/find.php?t=&os=&q=kernel-debuginfo-common-x86_64&d=1&rid=1805
如果小版本不对导致装不上的话,加上–nodeps 参数
rpm -ivh kernel-debuginfo-2.6.32-220.23.2.ali878.el6.x86_64.rpm –nodeps
#验证安装是否成功
sudo stap -v -e 'probe begin{printf("Hello, World"); exit();}'
检查OS是否支持 eBPF,你可以用这两个命令查看 ls /sys/fs/bpf 和 lsmod | grep bpf
案例
写好的默认脚本都在:/usr/share/doc/systemtap-client-2.8/examples/
stap 部分源代码: /usr/share/systemtap/tapset/linux/
- sudo ./socktop -N 20 //每个进程的流量,取最多的20个
- sudo stap netfilter_summary.stp -c “sleep 1” //每对IP之间的流量信息
- stap tcp_connections.stp -c “sleep 1” //每个进来的新连接
- sudo stap latencytap.stp –all-modules -w -t -x 38730 //监控进程38730最慢的内核操作
1 |
|
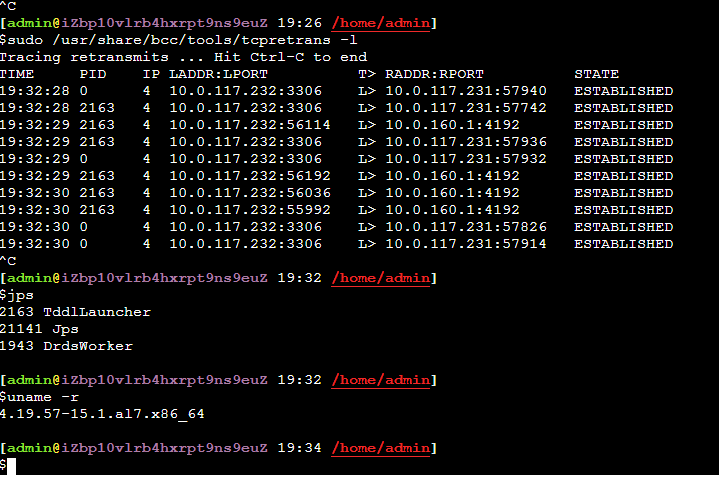
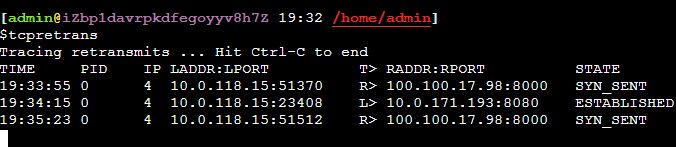
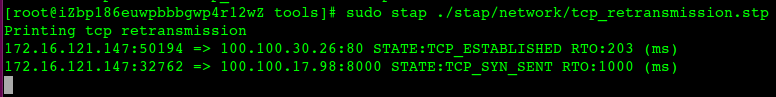
https://sourceware.org/systemtap/examples/network/tcp_retransmission.stp
案例2:需要模拟磁盘hang导致的io延迟,可以用systemtab来搞
#!/usr/bin/env stap
# 使用方式: stap delay.stp -g --all-modules -x 7222 只对7222进程进行延迟hack
# 延迟多少ms
global DELAY = 100;
global quit = 0;
global found;
probe begin {
warn(sprintf("Tracing pid %d ...\\n", target()))
}
# 如果想要针对mysql的写入,可以将下面换成
#probe process("/u01/mysql/bin/mysqld").function("sync_binlog_file").call
probe syscall.write.return {
if (pid() == target() && !quit ) {
mdelay( DELAY );
printf("write delay detail: tid: %d func:%s sleep: %d \n",tid(),probefunc(),DELAY);
}
}
probe syscall.fsync.return {
if (pid() == target() && !quit ) {
mdelay( DELAY );
printf("fsync delay detail: tid: %d func:%s sleep: %d \n",tid(),probefunc(),DELAY);
}
}
# 任务持续时间
probe timer.s(20) {
if (!found) {
warn("No backtraces found. Quitting now...\n")
exit()
} else {
warn("Time's up. Quitting now...(it may take a while)\n")
quit = 1
}
}
7U的系统自动封装了mtime函数 /usr/share/systemtap/tapset/linux/guru-delay.stp
如果是6U的系统,需要在上面的脚本中自己加上mdelay的函数
%{
#undef STP_OVERLOAD
#include <linux/delay.h>
%}

function mdelay(ms:long) %{
  mdelay(THIS->ms);
%}
案例3 追踪丢包
1 | probe kernel.trace("kfree_skb") |
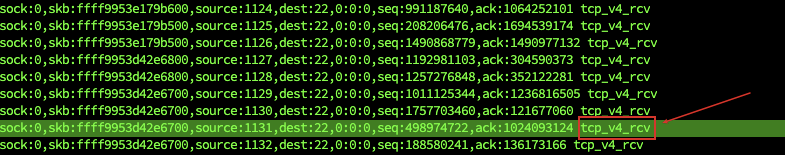
以上systemtap输出可以看出包进了tcp_v4_rcv, 所以继续分析tcp_v4_rcv函数:
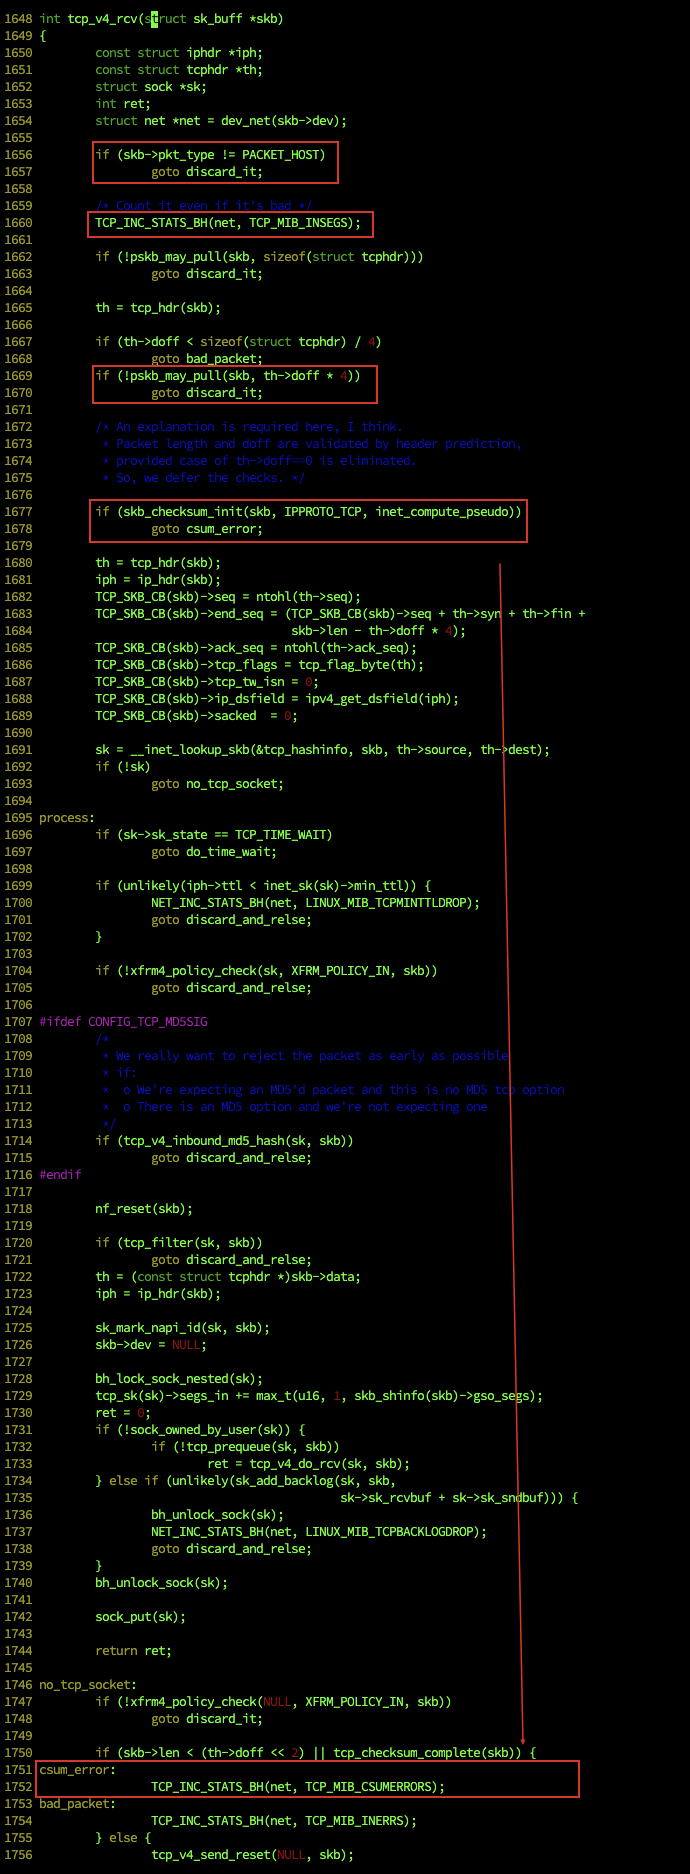
1 | probe kernel.statement("tcp_v4_rcv@net/ipv4/tcp_ipv4.c:*") |
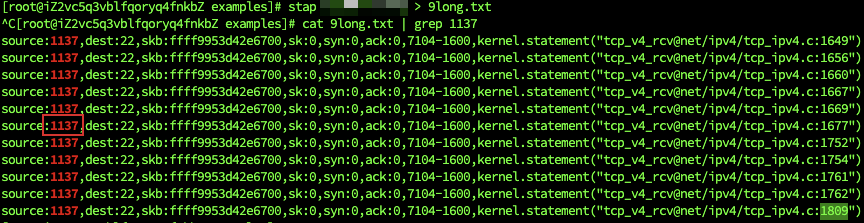
以上输出对应的代码如下:
网络重传
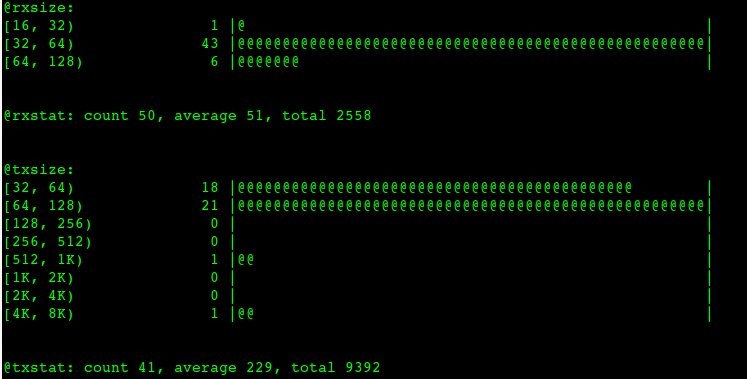
网络包大小分布
bpftrace -e 'tracepoint:net:net_dev_queue{
@txsize=hist(args->len);
@txstat=stats(args->len);
}

tracepoint:net:netif_receive_skb
{
    @rxsize=hist(args->len);
    @rxstat=stats(args->len);
}'
或者,采集10秒中的网络包大小直方图
1 | #bpftrace -e 'k:tcp_sendmsg { @size = hist(arg2); } interval:s:10 { exit(); }' |
bpftrace 单行命令
这里有一些其他的单行命令来展示 bpftrace 的能力,你可以把这些换成其他的内核函数:
获取 tcp_sendmsg() szie 大于 8192 字节的所有事件:
1 | bpftrace -e 'k:tcp_sendmsg /arg2 > 8192/ { printf("PID %d: %d bytes\n", pid, arg2); }' |
获取每个进程(PID 和 comm)的请求大小的直方图:
1 | bpftrace -e 'k:tcp_sendmsg { @size[pid, comm] = hist(arg2); }' |
返回值出现频率统计:
1 | bpftrace -e 'kr:tcp_sendmsg { @return[retval] = count(); }' |
获取每秒的统计:事件数,平均大小,和总字节数:
1 | bpftrace -e 'k:tcp_sendmsg { @size = stats(arg2); } |
统计调用栈:
1 | bpftrace -e 'k:tcp_sendmsg { @[kstack] = count(); }' |
统计调用栈,深度为3:
1 | bpftrace -e 'k:tcp_sendmsg { @[kstack(3)] = count(); }' |
获取函数调用延时的直方图,纳秒级:
1 | bpftrace -e 'k:tcp_sendmsg { @ts[tid] = nsecs; } kr:tcp_sendmsg /@ts[tid]/ { @ns = hist(nsecs - @ts[tid]); delete(@ts[tid]); }' |
最后一个例子在探测点(线程 ID 作为主键)保存时间戳,并在另外一个探测点获得这个时间戳。这个模式可以用来计算各种延时。
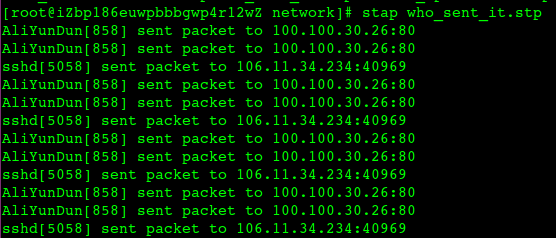
产看网络流量由哪个进程发出,或者说哪个进程在发包
网络连接创建rt?
# ./tools/bcc/tcpconnlat
PID    COMM         IP SADDR            DADDR            DPORT LAT(ms)
1935   java         4  10.81.177.14     100.100.110.2    80    0.21
6844   java         4  127.0.0.1        127.0.0.1        3406  0.05
6844   java         4  127.0.0.1        127.0.0.1        3406  0.02
1930   java         4  10.81.177.14     100.100.110.2    80    0.23
1914   java         4  10.81.177.14     100.100.110.2    80    0.26
6844   java         4  127.0.0.1        127.0.0.1        3406  0.04
6844   java         4  127.0.0.1        127.0.0.1        3406  0.02
1778   java         4  10.81.177.14     100.100.17.97    8000  1.62
1915   java         4  10.81.177.14     100.100.110.2    80    0.20
1944   java         4  10.81.177.14     100.100.110.2    80    0.23
6844   java         4  127.0.0.1        127.0.0.1        3406  0.05
6844   java         4  127.0.0.1        127.0.0.1        3406  0.03
1823   java         4  10.81.177.14     100.100.110.2    80    9.58
1928   java         4  10.81.177.14     100.100.110.2    80    9.61
6844   java         4  127.0.0.1        127.0.0.1        3406  0.05
6844   java         4  127.0.0.1        127.0.0.1        3406  0.03
1796   java         4  10.81.177.14     100.100.110.2    80    0.27
1949   java         4  10.81.177.14     100.100.110.2    80    0.22
1795   java         4  10.81.177.14     100.100.110.2    80    0.26
6844   java         4  127.0.0.1        127.0.0.1        3406  0.05
6844   java         4  127.0.0.1        127.0.0.1        3406  0.02
1916   java         4  10.81.177.14     100.100.110.2    80    3.70
1929   java         4  10.81.177.14     100.100.110.2    80    3.73
7059   java         4  127.0.0.1        127.0.0.1        3406  0.05
7059   java         4  127.0.0.1        127.0.0.1        3406  0.02
948    java         4  10.81.177.14     100.100.110.2    80    0.27
1917   java         4  10.81.177.14     100.100.110.2    80    0.20
1934   java         4  10.81.177.14     100.100.110.2    80    0.22
6844   java         4  127.0.0.1        127.0.0.1        3406  0.05
6844   java         4  127.0.0.1        127.0.0.1        3406  0.03
TCP队列实时查看
bpftrace工具包
cat tcpsynbl_example.txt
Demonstrations of tcpsynbl, the Linux bpftrace/eBPF version.
This tool shows the TCP SYN backlog size during SYN arrival as a histogram.
This lets you see how close your applications are to hitting the backlog limit
and dropping SYNs (causing performance issues with SYN retransmits). For
example:
# ./tcpsynbl.bt
Attaching 4 probes...
Tracing SYN backlog size. Ctrl-C to end.
^C
@backlog[backlog limit]: histogram of backlog size
@backlog[500]:
[0] 2266 |@@@@@@@@@@@@@@@@@@@@@@@@@@@@@@@@@@@@@@@@@@@@@@@@@@@@|
[1] 3 | |
[2, 4) 1 | |
$sudo bpftrace ./tcpsynbl.bt
Attaching 4 probes...
Tracing SYN backlog size. Ctrl-C to end.
^C
@backlog[backlog limit]: histogram of backlog size
@backlog[10]:
[0] 3 |@@@@@@@@@@@@@@@@@@@@@@@@@@@@@@@@@@@@@@@@@@@@@@@@@@@@|
@backlog[256]:
[0] 59 |@@@@@@@@@@@@@@@@@@@@@@@@@@@@@@@@@@@@@@@@@@@@@@@@@@@@|
或者 bpftrace tcpaccept.bt
cat tcpaccept_example.txt
Demonstrations of tcpaccept, the Linux bpftrace/eBPF version.
This tool traces the kernel function accepting TCP socket connections (eg, a
passive connection via accept(); not connect()). Some example output (IP
addresses changed to protect the innocent):
# ./tcpaccept
Tracing tcp accepts. Hit Ctrl-C to end.
TIME PID COMM RADDR RPORT LADDR LPORT BL
00:34:19 3949061 nginx 10.228.22.228 44226 10.229.20.169 8080 0/128
00:34:19 3951399 ruby 127.0.0.1 52422 127.0.0.1 8000 0/128
00:34:19 3949062 nginx 10.228.23.128 35408 10.229.20.169 8080 0/128
This output shows three connections, an IPv4 connections to PID 1463622, a “redis-server”
process listening on port 6379, and one IPv6 connection to a “thread.rb” process
listening on port 8000. The remote address and port are also printed, and the accept queue
current size as well as maximum size are shown.
The overhead of this tool should be negligible, since it is only tracing the
kernel function performing accept. It is not tracing every packet and then
filtering.
This tool only traces successful TCP accept()s. Connection attempts to closed
ports will not be shown (those can be traced via other functions).
There is another version of this tool in bcc: https://github.com/iovisor/bcc
最后一列就是backlog最大大小和已经多少
遍历端口状态
sudo stap -g walk_bhash.stp > /tmp/status
1 | #cat walk_bhash.stp |
抓在bind端口的进程,端口被bind后就会将 fastreuseport 从默认的-1 改成 0
1 | stap -e 'probe kernel.function("inet_csk_get_port") { |
DNS 域名解析时间
$sudo ./gethostlatency
TIME      PID    COMM                  LATms HOST
15:40:01  10549  sendmail               0.19 localhost
15:40:03  1782   java                   0.11 iZbp143cmod4v59cgon4zwZ
15:40:13  10580  ping                   0.98 abck.akksda
15:40:18  1823   java                   0.12 iZbp143cmod4v59cgon4zwZ
可以明显抓到ping但是nslookup抓不到(因为nslookup 不调用 getaddrinfo/gethostbyname)
统计线程执行时间排名
$sudo stap thread-times.stp -T 5
        comm   tid   %user %kernel (of 19997 ticks)
        java 30474  20.06%   0.75%
   swapper/0     0   0.00%   2.55%
   swapper/2     0   0.00%   2.00%
   swapper/3     0   0.00%   1.49%
        java 19500   0.38%   0.72%
        java 19501   0.35%   0.64%
        java 19503   0.34%   0.65%
        java 19496   0.28%   0.69%
        java 19497   0.28%   0.67%
        java 19502   0.31%   0.61%
        java 19498   0.30%   0.58%
        java 19499   0.26%   0.52%
   swapper/1     0   0.00%   0.75%
        java 20004   0.45%   0.18%
        java 19995   0.40%   0.19%
        java 20061   0.43%   0.16%
        java 20066   0.41%   0.17%
        java 20083   0.44%   0.13%
        java 20027   0.41%   0.16%
        java 20195   0.43%   0.13%
如上java线程执行消耗在用户态和内核态的CPU占比,根据tid可以到jstack中对应,相当于是将top命令中的线程消耗CPU做了累积,分清了用户态和内核态
内核函数执行时间
$sudo ./funclatency 'c:connect'
Tracing 1 functions for "c:connect"... Hit Ctrl-C to end.
^C

Function = [unknown] [10997]
     nsecs               : count     distribution
         0 -> 1          : 0        |                                        |
         2 -> 3          : 0        |                                        |
         4 -> 7          : 0        |                                        |
         8 -> 15         : 0        |                                        |
        16 -> 31         : 0        |                                        |
        32 -> 63         : 0        |                                        |
        64 -> 127        : 0        |                                        |
       128 -> 255        : 0        |                                        |
       256 -> 511        : 0        |                                        |
       512 -> 1023       : 0        |                                        |
      1024 -> 2047       : 0        |                                        |
      2048 -> 4095       : 0        |                                        |
      4096 -> 8191       : 4        |****************************************|
      8192 -> 16383      : 2        |********************                    |
     16384 -> 32767      : 1        |**********                              |

Function = connect [10999]  //telnet 连不上 tcp retry
     nsecs               : count     distribution
         0 -> 1          : 0        |                                        |
         2 -> 3          : 0        |                                        |
         4 -> 7          : 0        |                                        |
         8 -> 15         : 0        |                                        |
        16 -> 31         : 0        |                                        |
        32 -> 63         : 0        |                                        |
        64 -> 127        : 0        |                                        |
       128 -> 255        : 0        |                                        |
       256 -> 511        : 0        |                                        |
       512 -> 1023       : 0        |                                        |
      1024 -> 2047       : 0        |                                        |
      2048 -> 4095       : 0        |                                        |
      4096 -> 8191       : 3        |****************************************|
      8192 -> 16383      : 2        |**************************              |
     16384 -> 32767      : 1        |*************                           |
内核收发包耗时分析
1 | sudo ./funclatency -p mysqld_pid -T -u -i 1 -d 5 'pthread:__libc_send' |
磁盘
15:49:40 loadavg: 0.07 0.04 0.05 1/1008 11533

PID    COMM             D MAJ MIN DISK       I/O  Kbytes  AVGms
10784  kworker/u8:0     W 254 0   vda         31     140   2.41
416    jbd2/vda1-8      W 254 0   vda          2     100   0.93
Detaching...

[admin@iZbp143cmod4v59cgon4zwZ 15:49 /home/admin/tools/bcc]
$df -lh
Filesystem      Size  Used Avail Use% Mounted on
devtmpfs        3.8G     0  3.8G   0% /dev
tmpfs           3.9G     0  3.9G   0% /dev/shm
tmpfs           3.9G  620K  3.9G   1% /run
tmpfs           3.9G     0  3.9G   0% /sys/fs/cgroup
/dev/vda1        99G  5.1G   89G   6% /
tmpfs           779M     0  779M   0% /run/user/0
tmpfs           779M     0  779M   0% /run/user/1000

[admin@iZbp143cmod4v59cgon4zwZ 15:49 /home/admin/tools/bcc]
$sudo ./biotop 5 1
或者
$sudo stap iostats.stp -T 5
starting probe

                                       read     read             write    write
            name     open     read   KB tot    B avg    write   KB tot    B avg
            java        8   125797     5406       44   251673    44337      180
              ps      754      784      319      417        6       29     5105
            grep       39       27       73     2781        9       42     4891
              wc       10        6       17     2979        1        0        2
       AliYunDun       43       53        9      175        0        0        0
              sh        8        4        3      880        0        0        0
             fio       20       20        2      136        5        0       81
            sshd        0        6        0       70        6        0      121
 AliYunDunUpdate        2        4        0       75        0        0        0
   systemd-udevd        1        4        0       65        0        0        0
    DragoonAgent        0        0        0        0        1        0      100
          stapio        0       27        0        1        1        0       15
  aliyun-service        0       25        0        0        0        0        0
fs latency
[root@iZbp1d1tuijx3yqz46meimZ lwtools]# stap fslatency-nd.stp 1 1
Tracing FS sync reads and writes... Output every 1 secs.

Thu Sep 19 07:48:54 2019 FS latency (ns):

FS call: __vfs_read()
 value |-------------------------------------------------- count
   128 |                                                       0
   256 |                                                       0
   512 |                                                       2
  1024 |@@@@@@@@@@@@@@@@@@@@@@@@@@@@@@@@@@@@@@@@@@@@@@@@@  12423
  2048 |@@@@@@@@@@@@@@@@@@@@@@@@@@@@@@@@@@@@@@@@@          10330
  4096 |@@                                                   514
  8192 |@@@@@@                                              1624
 16384 |@                                                    273
 32768 |                                                      48
 65536 |                                                       1
131072 |                                                       0
262144 |                                                       0

FS call: __vfs_write()
 value |-------------------------------------------------- count
    64 |                                                       0
   128 |                                                       0
   256 |                                                     169
   512 |@@@@@@@@@@@@@@@@@@@@@@@@@@@@@@@@@@@@@@@@@@@@@@@@@  32549
  1024 |@@@@@@@@@@@@@@@@@@@@@@@@@                          16276
  2048 |                                                     469
  4096 |                                                     385
  8192 |                                                     439
 16384 |                                                     100
 32768 |                                                       5
 65536 |                                                       1
131072 |                                                       0
262144 |                                                       0
读写时间分布:
[root@iZbp1d1tuijx3yqz46meimZ lwtools]# ./rwtime-nd.stp java
Tracing read/write syscalls for processes named “java”… Hit Ctrl-C to end.
^C
syscall read latency (ns):
value |————————————————– count
128 | 0
256 | 0
512 |@ 3129
1024 |@@@@@@@@@@@@@@@@@@@@@@@@@@@@@@@@@@@@@@@@@@@@@@@@@ 85897
2048 |@@@@@@@@@@@@@@@ 26032
4096 | 386
8192 | 1142
16384 | 63
32768 | 3
65536 | 1
131072 | 1
262144 | 0
524288 | 0
syscall write latency (ns):
value |————————————————– count
256 | 0
512 | 0
1024 | 1720
2048 |@@@@@@@@@@@@@@@@@@@@@@@@@@@@@@@@@@@@@@@@@@@@@@@@@ 104247
4096 |@@@@@@@@@@@@@@@@@@@@@@@@@@@@@@@@@@@@@@@@@@@@@@@@@ 105507
8192 |@@@@@@@@ 17768
16384 |@ 3715
32768 | 353
65536 | 44
131072 | 0
262144 | 3
524288 | 0
1048576 | 0
SLOW FS READ AND WRITE
[root@iZbp1d1tuijx3yqz46meimZ lwtools]# ./fsslower-nd.stp 5
Tracing FS sync reads and writes slower than 5 ms... Hit Ctrl-C to end.
TIME     PID    COMM             FUNC           SIZE     LAT(ms)
07:55:13 30941  grep             __vfs_read     32768         18
07:55:13 30942  grep             __vfs_read     32768          5
07:55:13 30943  grep             __vfs_read     32768         23
07:55:13 30944  wc               __vfs_read     16384         24
07:55:13 1102   java             __vfs_read     8192          39
07:55:13 1102   java             __vfs_read     8192          40
cache
$sudo ./cachestat -T 5 1
TIME         HITS   MISSES  DIRTIES HITRATIO   BUFFERS_MB  CACHED_MB
16:01:10     6297        0       52  100.00%           31        652
中断发生,主要是网卡
# sudo stap interrupts-by-dev.stp -c 'sleep 1'
  DEVICE 	 NUMBER OF INTERRUPTS
    virtio2-req.0 :      1
 virtio0-output.0 :      2
  virtio0-input.0 :      1
 virtio0-output.0 :      1
  virtio0-input.0 :      2
 virtio0-output.0 :      1
 virtio0-output.0 :      1
  virtio0-input.0 :      1
 virtio0-output.0 :      1
  virtio0-input.0 :      1
 virtio0-output.0 :      1
  virtio0-input.0 :      1
futex
$sudo stap futexes.stp  -T 1
java[4457] lock 0x7f5da0bbd548 contended 1 times, 1 avg us
java[4457] lock 0x7f5d23c46188 contended 1 times, 27 avg us
java[4457] lock 0x7f5d52f3f154 contended 1 times, 1945 avg us
java[4457] lock 0x7f5da06a03f0 contended 1 times, 20 avg us
java[4457] lock 0x7f5da2baad54 contended 1 times, 267 avg us
java[4457] lock 0x7f5d23a8d574 contended 1 times, 60130 avg us
java[4457] lock 0x7f5d23c30154 contended 1 times, 664 avg us
java[4457] lock 0x7f5d23c5e1b4 contended 3 times, 70979 avg us
java[4457] lock 0x7f5d23bc3154 contended 1 times, 4342 avg us
java[4457] lock 0x7f5da2b897b4 contended 1 times, 70190 avg us
java[4457] lock 0x7f5d533a0d54 contended 1 times, 2202 avg us
给程序注入系统调用setsockopt
没有源代码,需要将应用的keepalive 打开。可以通过SystemTap,给进程注入一个setsockopt调用,使其开启SO_KEEPALIVE
在accept调用返回的时候注入这个调用,脚本源码为, 必须要在有新连接进来的时候:
1 | %{ |
执行的方式是,$pid为指定的进程pid:
1 | > stap -g inject_keepalive.stp $pid |
Systemtap 抓取 mysql insert 慢操作
主要抓取下面的函数
row_ins_clust_index_entry_low 主键insert
fsp_try_extend_data_file 文件扩展
mysql_insert mysql insert的最上层函数
os_aio_func mysql 调用aio的函数,我们测试时只抓取其中的同步io
stap 脚本
1 | global start_time; |
抓取结果
1 | pid->30530 tid->90738 func->os_aio_func start_time->1508234813956745 elapsed_time->11396 |
可以看出调用关系是 mysql_insert -> row_ins_clust_index_entry_low -> os_aio_func
pid 30530和129041 分别指两个mysqld 进程,怀疑IO问题
io逻辑以及涉及到的 perf 事件
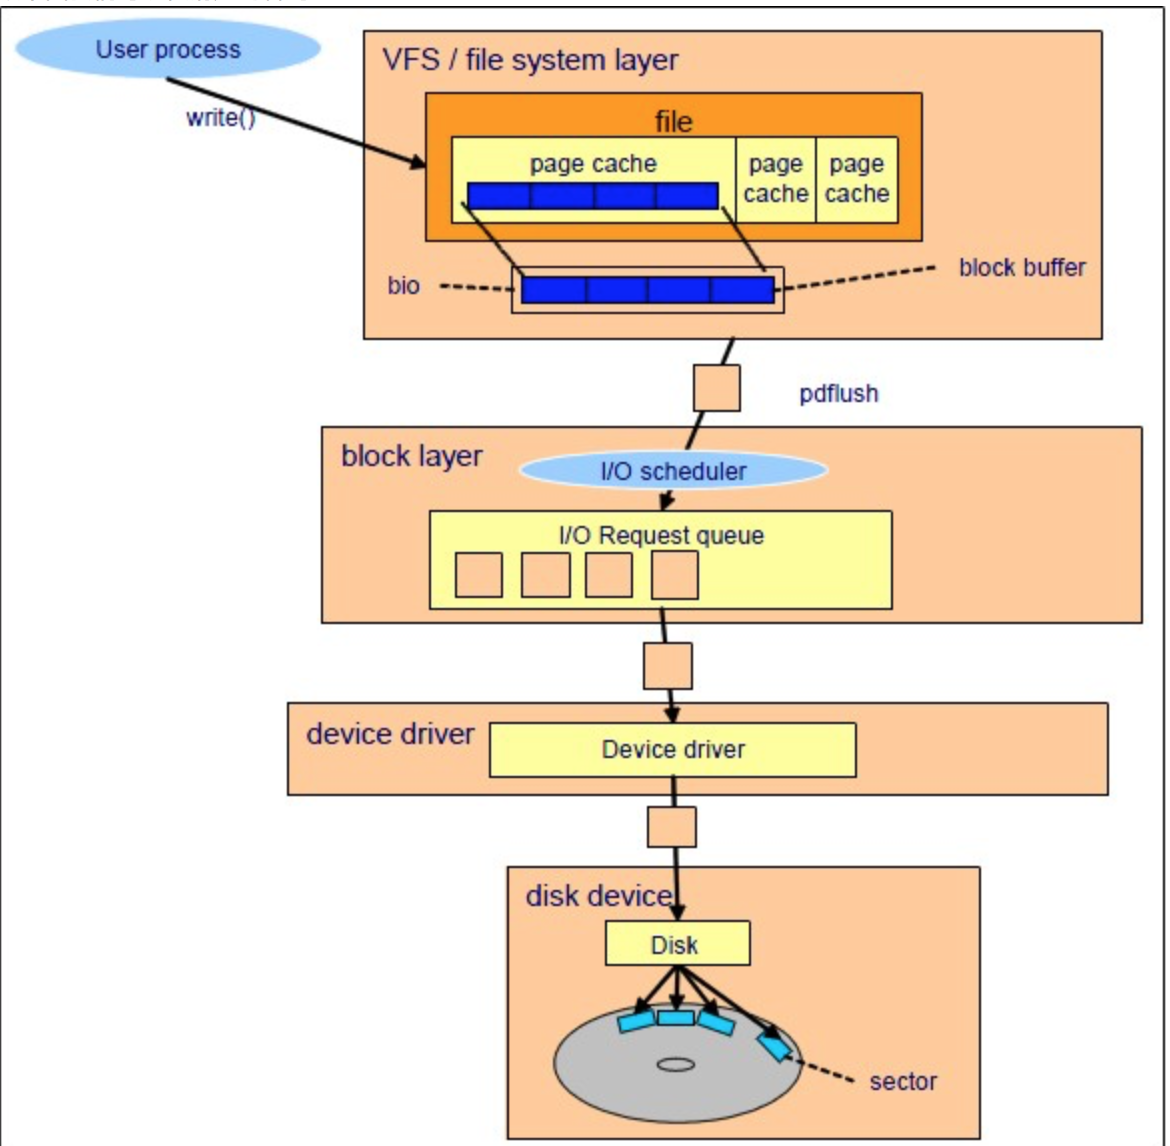
如果想要准确知道是不是硬件设备的问题,可以抓取block layer层和device driver层之间的rt,也就是以下两个事件:
block:block_rq_issue IO块经过io调度算法,以及队列等待后,最终下发出去的事件
block:block_rq_complete IO块从device driver 返回的事件
除了上面两个,假如我们想排查是不是由于IO调度策略,及队列的问题,可以追踪block:block_rq_insert 和 block:block_rq_complete 之间的rt
perf是通过cpu的打点来计算事件发生的时间,我们只要通过后期进行处理,即可知道RT
1 | # 抓取事件,会自动输出结果到当前目录下的perf.data中 |
结果如下
1 | 进程名 pid cpu time 事件 |
bpftrace 同时 trace 多个事件
1 | bpftrace -e 'k:tcp_bpf_recvmsg /comm=="nc"/ { printf("%s", kstack); } k:tcp_recvmsg /comm=="nc"/ { printf("%s", kstack); }' |
参考资料
Demo集锦:openresty systemtap demo
eBPF 内核探测:如何将任意系统调用转换成事件(2016)
使用 Linux tracepoint、perf 和 eBPF 跟踪数据包 (2017)
eBPF学习笔记(二)—— eBPF开发工具 主要是关于 bpftrace 的使用实例