CPU 性能和Cache Line 为了让程序能快点,特意了解了CPU的各种原理,比如多核、超线程、NUMA、睿频、功耗、GPU、大小核再到分支预测、cache_line失效、加锁代价、IPC等各种指标(都有对应的代码和测试数据)都会在这系列文章中得到答案。当然一定会有程序员最关心的分支预测案例、Disruptor无锁案例、cache_line伪共享案例等等。
这次让我们从最底层的沙子开始用8篇文章来回答各种疑问以及大量的实验对比案例和测试数据。
大的方面主要是从这几个疑问来写这些文章:
同样程序为什么CPU跑到800%还不如CPU跑到200%快?
IPC背后的原理和和程序效率的关系?
为什么数据库领域都爱把NUMA关了,这对吗?
几个国产芯片的性能到底怎么样?
系列文章 CPU的制造和概念
[Perf IPC以及CPU性能](/2021/05/16/Perf IPC以及CPU利用率/)
[CPU 性能和Cache Line](/2021/05/16/CPU Cache Line 和性能/)
十年后数据库还是不敢拥抱NUMA?
[Intel PAUSE指令变化是如何影响自旋锁以及MySQL的性能的](/2019/12/16/Intel PAUSE指令变化是如何影响自旋锁以及MySQL的性能的/)
Intel、海光、鲲鹏920、飞腾2500 CPU性能对比
一次海光物理机资源竞争压测的记录
飞腾ARM芯片(FT2500)的性能测试
CPU为什么要CACHE,请看这篇
什么是 cache_line CPU从内存中读取数据的时候是一次读一个cache_line到 cache中以提升效率,一般情况下cache_line的大小是64 byte(64Bytes也就是16个32位的整型)这就是CPU从内存中捞数据上来的最小数据单位,按照热点逻辑还是大概率会依次被访问到(详见后面的例子)。
比如L1 Cache 有32KB,那么它可以分成32KB / 64 = 512 条 Cache Line。
Cache Line 是 CPU 和主存之间数据传输的最小单位。当一行 Cache Line 被从内存拷贝到 Cache 里,Cache 里会为这个 Cache Line 创建一个条目。这个 Cache 条目里既包含了拷贝的内存数据,即 Cache Line,又包含了这行数据在内存里的位置等元数据信息。
处理器都实现了 Cache 一致性 (Cache Coherence)协议。如历史上 x86 曾实现了 MESI 协议 ,以及 MESIF 协议。
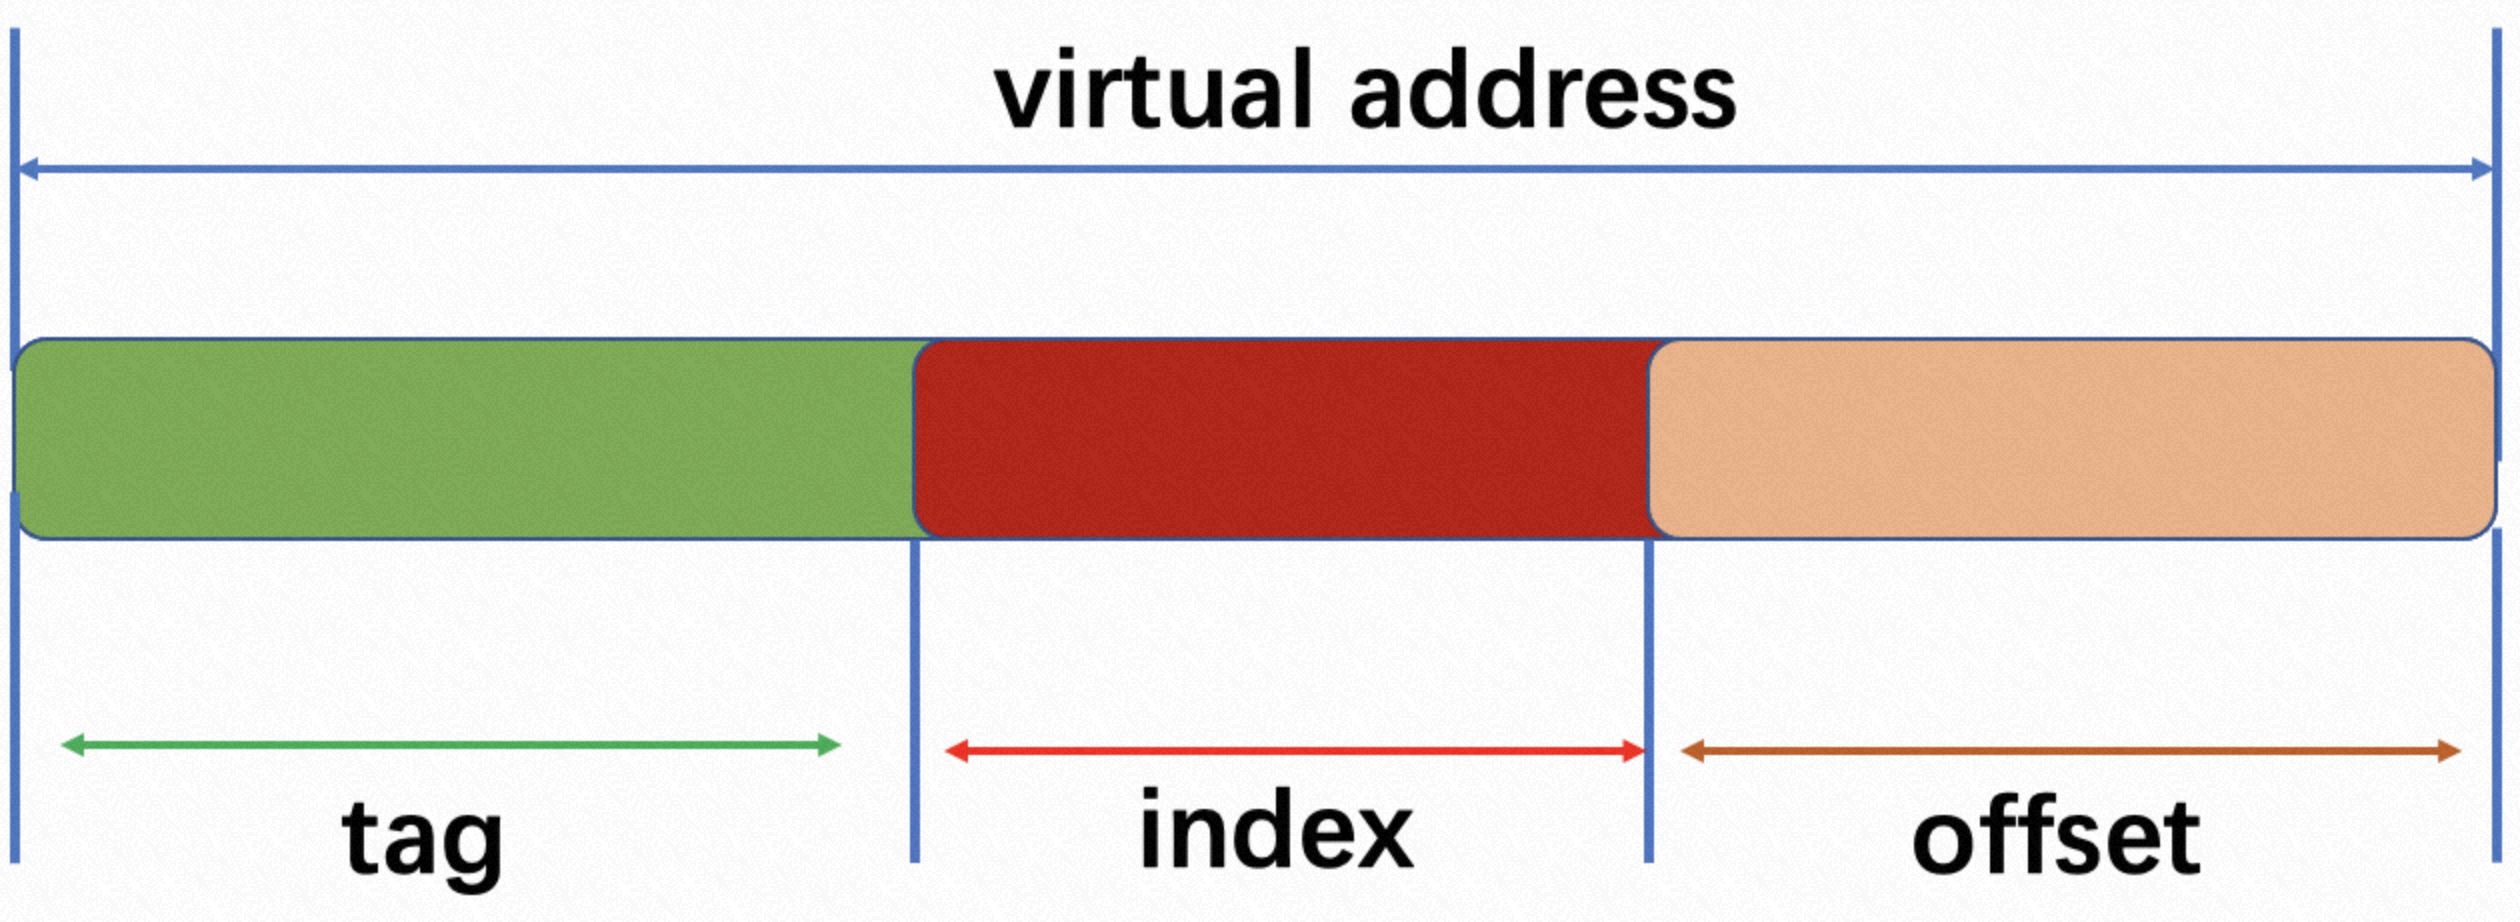
先看下如上一张图,其中
tag:一般虚拟地址高位多bit表示;
index: 虚拟地址中间多bit表示;
offset: 虚拟地址多bit表示;
但是这三者的值是多少呢,只能说和cache缓存的的大小息息相关。
举个例子,录入cache缓存大小为64K, 有4路, 服务器寻址为64bit。
offset的值为 2^ = 64; offset = 6;
index的值为 64k / (64 * 4) = 256 = 2 ^ 8; 所以index的值为8bit;
tag的值为 64 - 8 - 6 = 50bit;
注:此计算完全按照理论方式计算,实际情况需要考虑TLB别名以及其他情况影响。
了解以上概念后,此处用一张图去介绍TLB转换获取数据的过程。
cache 失效 假设两个处理器 A 和 B, 都在各自本地 Cache Line 里有同一个变量的拷贝时,此时该 Cache Line 处于 Shared 状态。当处理器 A 在本地修改了变量,除去把本地变量所属的 Cache Line 置为 Modified 状态以外,还必须在另一个处理器 B 读同一个变量前,对该变量所在的 B 处理器本地 Cache Line 发起 Invaidate 操作,标记 B 处理器的那条 Cache Line 为 Invalidate 状态。随后,若处理器 B 在对变量做读写操作时,如果遇到这个标记为 Invalidate 的状态的 Cache Line,即会引发 Cache Miss,从而将内存中最新的数据拷贝到 Cache Line 里,然后处理器 B 再对此 Cache Line 对变量做读写操作。
cache ping-pong(cache-line ping-ponging) 是指不同的CPU共享位于同一个cache-line里边的变量,当不同的CPU频繁的对该变量进行读写时,会导致其他CPU cache-line的失效。
显而易见的是一旦cache失效就需要访问内存重新从内存中读取数据到CPU cache中,这个过程会很慢。
查看 cache_line 如下 Linux getconf 命令的输出,除了 *_LINESIZE 指示了系统的 Cache Line 的大小是 64 字节外,还给出了 Cache 类别,大小。 其中 *_ASSOC 则指示了该 Cache 是几路关联 (Way Associative) 的。
1
2
3
4
5
6
7
8
9
10
11
12
13
14
15
16
$sudo getconf -a |grep CACHE LEVEL1_ICACHE_SIZE 32768 LEVEL1_ICACHE_ASSOC 8 LEVEL1_ICACHE_LINESIZE 64 LEVEL1_DCACHE_SIZE 32768 LEVEL1_DCACHE_ASSOC 8 LEVEL1_DCACHE_LINESIZE 64 LEVEL2_CACHE_SIZE 262144 LEVEL2_CACHE_ASSOC 4 LEVEL2_CACHE_LINESIZE 64 LEVEL3_CACHE_SIZE 3145728 LEVEL3_CACHE_ASSOC 12 LEVEL3_CACHE_LINESIZE 64 LEVEL4_CACHE_SIZE 0 LEVEL4_CACHE_ASSOC 0 LEVEL4_CACHE_LINESIZE 0
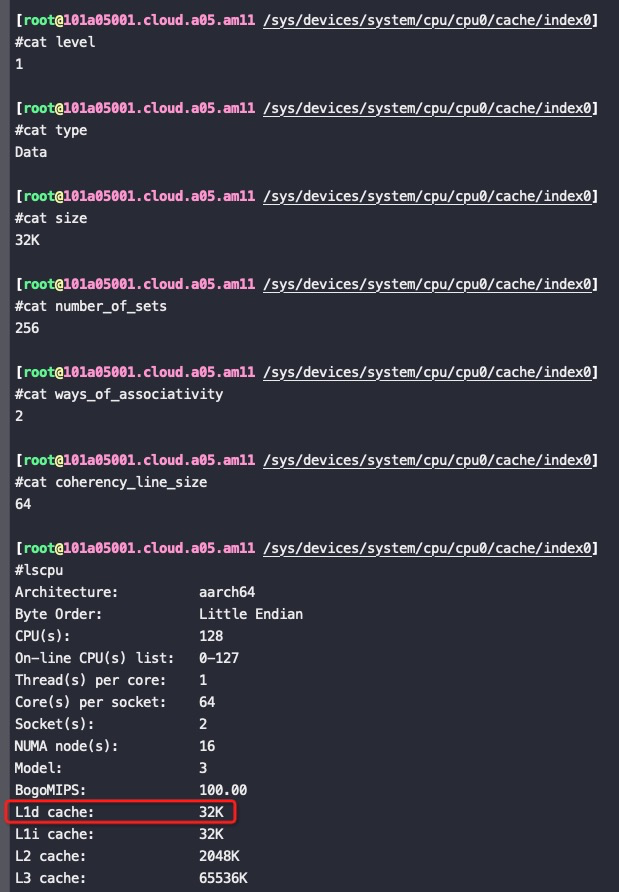
比如,对于下面的FT2500 ARM芯片下,L1D是32K,是因为32K=256*2*64(64就是cache_line大小,16个int), 这32K是256个组,每组2行(x86一般是每组8行),每行就是一个cache_line
cache_line 影响性能的案例 如下两个循环执行次数循环2是循环1的十六分之一。但是在x86和arm下执行时间都是循环2是循环1的四分之一左右。
之所以执行时间不是十六分之一是因为循环一重用了cache_line.
Xeon(R) Platinum 8260跑这个程序的性能是鲲鹏920的2倍左右。
1
2
3
4
5
6
7
8
9
10
11
12
13
14
15
16
17
18
19
20
21
22
23
24
25
26
27
28
29
30
31
32
33
34
#include "stdio.h" #include <stdlib.h> #include <time.h> long timediff(clock_t t1, clock_t t2) { long elapsed; elapsed = ((double)t2 - t1) / CLOCKS_PER_SEC * 1000; return elapsed; } int main(int argc, char *argv[]) { long length=64*1024*1024; int* arr=malloc(64*1024*1024 * sizeof(int)); long i=0; long j=0; for (i = 0; i < length; i++) arr[i] = i; clock_t start=clock(); // 循环1 for(j=0; j<10; j++){ for (i = 0; i < length; i++) arr[i] *= 3; //每取一次arr[i], 通过cache_line顺便把后面15个arr[i]都取过来了 } clock_t end =clock(); printf("%lu\n", timediff(start,end)); start=clock(); // 循环2 for(j=0; j<10; j++){ for (i = 0; i < length; i += 16) arr[i] *= 3; } end =clock(); printf("%lu\n", timediff(start,end)); }
鲲鹏920上循环一的perf结果:
1
2
3
4
5
6
7
8
9
10
11
12
13
14
15
16
17
18
19
20
21
#perf stat -- ./cache_line_loop.out 2790 failed to read counter branches Performance counter stats for './cache_line_loop.out': 3238.892820 task-clock (msec) # 1.000 CPUs utilized 4 context-switches # 0.001 K/sec 0 cpu-migrations # 0.000 K/sec 65,582 page-faults # 0.020 M/sec 8,420,900,487 cycles # 2.600 GHz 23,284,432 stalled-cycles-frontend # 0.28% frontend cycles idle 4,709,527,283 stalled-cycles-backend # 55.93% backend cycles idle 14,553,892,976 instructions # 1.73 insns per cycle # 0.32 stalled cycles per insn //因为有cache_line的命中,stall是循环二的四分之一 <not supported> branches 141,482 branch-misses # 0.00% of all branches 3.239729660 seconds time elapsed
鲲鹏920上循环二的perf结果:
1
2
3
4
5
6
7
8
9
10
11
12
13
14
15
16
17
18
19
#perf stat -- ./cache_line_loop.out 730 failed to read counter branches Performance counter stats for './cache_line_loop.out': 1161.126720 task-clock (msec) # 0.999 CPUs utilized 1 context-switches # 0.001 K/sec 0 cpu-migrations # 0.000 K/sec 65,583 page-faults # 0.056 M/sec 3,018,882,346 cycles # 2.600 GHz 21,846,222 stalled-cycles-frontend # 0.72% frontend cycles idle 2,456,150,941 stalled-cycles-backend # 81.36% backend cycles idle 1,970,906,199 instructions # 0.65 insns per cycle # 1.25 stalled cycles per insn <not supported> branches 138,051 branch-misses # 0.00% of all branches 1.161791340 seconds time elapsed
在Xeon(R) Platinum 8260 CPU @ 2.40GHz 上运行上面两个循环的时间:
1
2
3
#perf stat -- ./cache_line_loop.out 1770 370
更多案例请参考7个示例科普CPU CACHE:Gallery of Processor Cache Effects
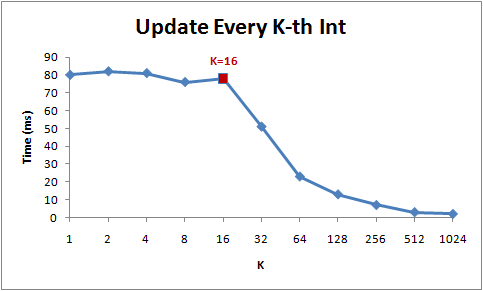
如下图,表示的是for循环每次跳K个int,在K小于16的时候虽然循环次数逐渐减少到原来的1/16, 但是总时间没变,因为一直是访问的同一个cache里面的数据。 到16个之后就会产生突变(跨了cache_line),再后面32、64、128的时间减少来源于循环次数的减少,因为如论如何每次循环都需要访问内存加载数据到cache_line中
1 for (int i = 0; i < arr.Length; i += K) arr[i] *= 3;
更典型的案例是对一个二维数组逐行遍历和逐列遍历的时间差异,变量次数一样,但是因为二维数组按行保存,所以逐行遍历对cache line 更友好
1
2
3
4
5
6
7
8
9
10
11
12
13
14
15
16
17
const int row = 1024; const int col = 512 int matrix[row][col]; //逐行遍历 0.081ms int sum_row=0; for(int _r=0; _r<row; _r++) { for(int _c=0; _c<col; _c++){ sum_row += matrix[_r][_c]; } } //逐列遍历 1.069ms int sum_col=0; for(int _c=0; _c<col; _c++) { for(int _r=0; _r<row; _r++){ sum_col += matrix[_r][_c]; } }
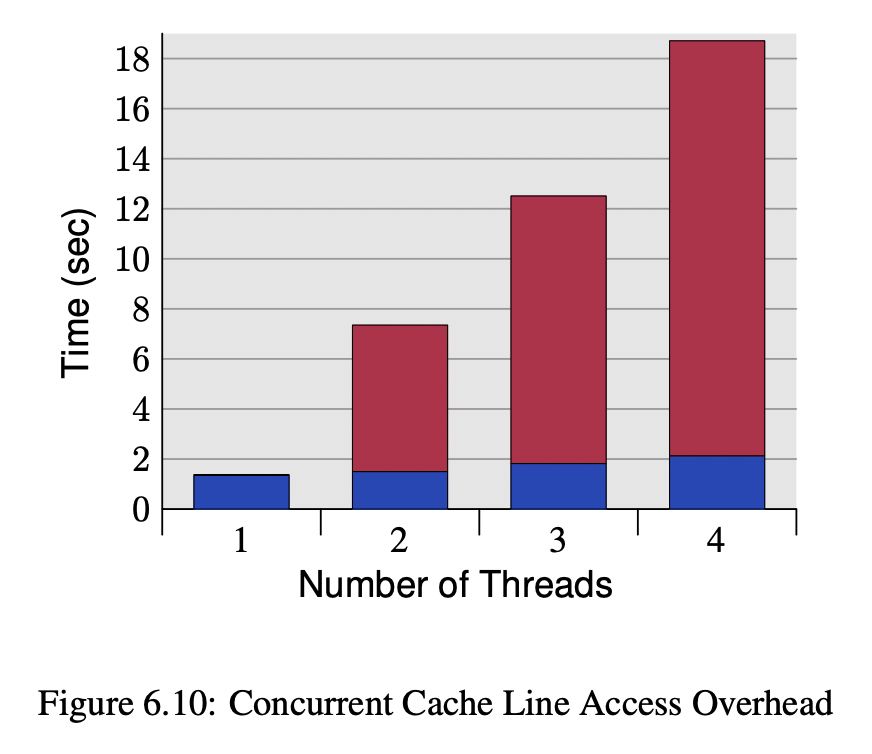
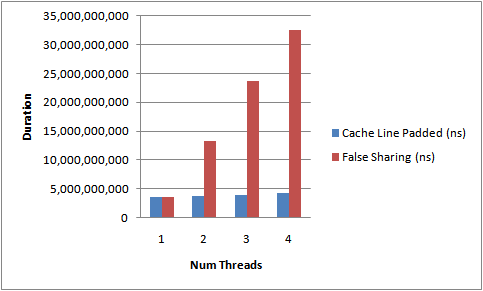
四线程竞争下的cache_line影响
上图是每个线程对内存中自己的int进行++ (每个线程绑定在自己的core上,机器有4个P4 core), 蓝色部分是每个线程的变量分配在线程内部,也就是每个变量有独立的cache_line,红色部分(含蓝色)是将变量放在一个cache_line(必然会出现伪共享)
Disruptor论文中讲述了我们所做的一个实验。这个测试程序调用了一个函数,该函数会对一个64位的计数器循环自增5亿次。当单线程无锁时,程序耗时300ms。如果增加一个锁(仍是单线程、没有竞争、仅仅增加锁),程序需要耗时10000ms,慢了两个数量级。更令人吃惊的是,如果增加一个线程(简单从逻辑上想,应该比单线程加锁快一倍),耗时224000ms。使用两个线程对计数器自增5亿次比使用无锁单线程慢1000倍。**并发很难而锁的性能糟糕。**单线程使用CAS耗时5700ms。所以它比使用锁耗时少,但比不需要考虑竞争的单线程耗时多。
We will illustrate the cost of locks with a simple demonstration. The focus of this experiment is to call a function which increments a 64-bit counter in a loop 500 million times. This can be executed by a single thread on a 2.4Ghz Intel Westmere EP in just 300ms if written in Java. The language is unimportant to this experiment and results will be similar across all languages with the same basic primitives.
Once a lock is introduced to provide mutual exclusion, even when the lock is as yet un-contended, the cost goes up significantly. The cost increases again, by orders of magnitude, when two or more threads begin to contend. The results of this simple experiment are shown in the table below:
Table 1. Comparative costs of contention
Method
Time (ms)
Single thread
300
Single thread with lock
10,000
Two threads with lock
224,000
Single thread with CAS
5,700
Two threads with CAS
30,000
Single thread with volatile write
4,700
如下测试代码:
1
2
3
4
5
6
7
8
9
10
11
12
13
14
15
16
17
18
19
20
21
22
23
24
25
26
27
28
29
30
31
32
33
34
35
36
37
38
39
40
41
42
43
44
45
46
47
48
49
50
51
52
53
54
55
56
57
58
59
60
61
62
63
64
65
66
67
68
69
70
71
72
73
74
75
76
77
78
79
80
81
82
83
84
85
86
87
88
89
90
91
package test; import java.util.concurrent.atomic.AtomicLong; import java.util.concurrent.locks.Lock; import java.util.concurrent.locks.ReentrantLock; public class LockBenchmark{ public static void runIncrement() { long counter = 0; long max = 50000000000L; long start = System.currentTimeMillis(); while (counter < max) { counter++; } long end = System.currentTimeMillis(); System.out.println("Time spent is " + (end-start) + "ms without lock"); } public static void runIncrementWithLock() { Lock lock = new ReentrantLock(); long counter = 0; long max = 500000000L; long start = System.currentTimeMillis(); while (counter < max) { if (lock.tryLock()){ counter++; lock.unlock(); } } long end = System.currentTimeMillis(); System.out.println("Time spent is " + (end-start) + "ms with lock"); } public static void main(String[] args) { runIncrement(); System.out.println("start runIncrementWithLock."); runIncrementWithLock(); } } [root@ARM 14:14 /root] #java test.LockBenchmark Time spent is 19261ms without lock start runIncrementWithLock. Time spent is 17267ms with lock //单线程加锁在没有任何竞争的情况下慢了两个数量级是因为加锁动作本身需要几十个指令 reentrantLock.tryLock()实现: 11 final boolean nonfairTryAcquire(int); 12 Code: 13 0: invokestatic #2 // Method java/lang/Thread.currentThread:()Ljava/lang/Thread; 14 3: astore_2 15 4: aload_0 16 5: invokevirtual #3 // Method getState:()I 17 8: istore_3 18 9: iload_3 19 10: ifne 29 20 13: aload_0 21 14: iconst_0 22 15: iload_1 23 16: invokevirtual #4 // Method compareAndSetState:(II)Z 24 19: ifeq 65 25 22: aload_0 26 23: aload_2 27 24: invokevirtual #5 // Method setExclusiveOwnerThread:(Ljava/lang/Thread;)V 28 27: iconst_1 29 28: ireturn 30 29: aload_2 31 30: aload_0 32 31: invokevirtual #6 // Method getExclusiveOwnerThread:()Ljava/lang/Thread; 33 34: if_acmpne 65 34 37: iload_3 35 38: iload_1 36 39: iadd 37 40: istore 4 38 42: iload 4 39 44: ifge 57 40 47: new #7 // class java/lang/Error 41 50: dup 42 51: ldc #8 // String Maximum lock count exceeded 43 53: invokespecial #9 // Method java/lang/Error."<init>":(Ljava/lang/String;)V 44 56: athrow 45 57: aload_0 46 58: iload 4 47 60: invokevirtual #10 // Method setState:(I)V 48 63: iconst_1 49 64: ireturn 50 65: iconst_0 51 66: ireturn
不加锁的循环执行500亿次循环,加锁的只执行5亿次,最终耗时差不多。对应两个阶段的IPC数据:
1
2
3
4
5
6
7
8
9
10
11
12
13
14
15
16
17
18
19
20
21
22
23
24
25
26
27
28
29
30
31
32
33
34
35
36
37
#perf stat -p 92098 Performance counter stats for process id '92098': 3978.381920 task-clock (msec) # 1.001 CPUs utilized 121 context-switches # 0.030 K/sec 7 cpu-migrations # 0.002 K/sec 71 page-faults # 0.018 K/sec 10,343,414,319 cycles # 2.600 GHz 2,091,748 stalled-cycles-frontend # 0.02% frontend cycles idle 11,011,682 stalled-cycles-backend # 0.11% backend cycles idle 41,311,635,225 instructions # 3.99 insns per cycle //不加锁循环++ # 0.00 stalled cycles per insn <not supported> branches 32,675 branch-misses # 0.00% of all branches 3.972534070 seconds time elapsed [root@ARM 13:55 /root] #perf stat -p 92098 ^Cfailed to read counter branches Performance counter stats for process id '92098': 10599.558340 task-clock (msec) # 1.001 CPUs utilized 292 context-switches # 0.028 K/sec 1 cpu-migrations # 0.000 K/sec 202 page-faults # 0.019 K/sec 27,557,631,981 cycles # 2.600 GHz 1,079,785,178 stalled-cycles-frontend # 3.92% frontend cycles idle 15,669,652,101 stalled-cycles-backend # 56.86% backend cycles idle 14,456,635,493 instructions # 0.52 insns per cycle //加锁循环++ # 1.08 stalled cycles per insn <not supported> branches 69,722 branch-misses # 0.00% of all branches 10.592190690 seconds time elapsed
可以看到最终时间差了100倍,IPC差了8倍,从指令数来看加锁后指令数会略多,但是加锁造成了stall(即使没有实际竞争)。
上述代码如果是在:Intel(R) Xeon(R) CPU E5-2682 v4 @ 2.50GHz 上运行,差距要小很多,也可以看出intel x86芯片优化比较好。不加锁的循环X86比ARM要慢一点点是因为ARM芯片的主频是2.6G,要高一点点。
1
2
3
4
#java test.LockBenchmark //x86 Time spent is 20135ms without lock start runIncrementWithLock. Time spent is 13056ms with lock
此时Intel CPU上对应的IPC分别是3.99和1.
这里加锁和不加锁最终性能差了将近2个数量级,但是IPC只差了8倍,另外的差异在加锁后增加了很多的指令、函数调用等。如果两个函数都增加每个循环里面的指令数量,那么他们的时间差距会缩小。如果增加的指令是乘法、除法会大幅降低IPC
比如代码改成如下:
1
2
3
4
5
6
7
8
9
10
11
12
13
14
15
16
17
18
19
20
21
22
23
24
25
26
27
28
29
30
31
32
33
34
35
36
37
38
39
40
41
42
43
44
45
46
47
48
49
50
51
52
#cat LockBenchmark.java package test; import java.util.concurrent.atomic.AtomicLong; import java.util.concurrent.locks.Lock; import java.util.concurrent.locks.ReentrantLock; public class LockBenchmark{ public static void runIncrement() { long counter = 0; long max = 500000000L; double sum =100.0; long start = System.currentTimeMillis(); while (counter < max) { counter++; sum=3.251; for(int i=0; i<10; ++i){ sum += sum*3.75/3; } } long end = System.currentTimeMillis(); System.out.println("Time spent is " + (end-start) + "ms without lock:"+sum); } public static void runIncrementWithLock() { Lock lock = new ReentrantLock(); long counter = 0; double sum=100.0; long max = 500000000L; long start = System.currentTimeMillis(); while (counter < max) { if (lock.tryLock()){ counter++; sum=3.253; for(int i=0; i<10; ++i){ sum += sum*3.75/3; } lock.unlock(); } } long end = System.currentTimeMillis(); System.out.println("Time spent is " + (end-start) + "ms with lock:"+sum); } public static void main(String[] args) { runIncrement(); System.out.println("start runIncrementWithLock."); runIncrementWithLock(); } }
在Intel芯片下,加锁运行时间慢了1倍,IPC差不多,运行时间和IPC 分别为:
1
2
3
4
5
6
7
8
9
10
11
12
13
14
15
16
17
18
19
20
21
22
23
24
25
26
27
28
29
30
31
32
33
34
35
36
37
38
39
#java test.LockBenchmark //如上代码循环次数都是5亿次, intel cpu Time spent is 11884ms without lock:10810.40962948895 start runIncrementWithLock. Time spent is 22662ms with lock:10817.060142949109 #perf stat -p `jps | grep LockBenchmark | awk '{ print $1 }'` ^C Performance counter stats for process id '117862': 7144.193030 task-clock (msec) # 1.002 CPUs utilized (100.00%) 227 context-switches # 0.032 K/sec (100.00%) 26 cpu-migrations # 0.004 K/sec (100.00%) 199 page-faults # 0.028 K/sec 17,842,543,877 cycles # 2.497 GHz (100.00%) <not supported> stalled-cycles-frontend <not supported> stalled-cycles-backend 17,153,665,963 instructions # 0.96 insns per cycle (100.00%) 2,408,676,080 branches # 337.152 M/sec (100.00%) 39,593 branch-misses # 0.00% of all branches 7.133030625 seconds time elapsed #perf stat -p `jps | grep LockBenchmark | awk '{ print $1 }'` ^C Performance counter stats for process id '117862': 3962.496661 task-clock (msec) # 1.002 CPUs utilized (100.00%) 123 context-switches # 0.031 K/sec (100.00%) 3 cpu-migrations # 0.001 K/sec (100.00%) 77 page-faults # 0.019 K/sec 9,895,900,342 cycles # 2.497 GHz (100.00%) <not supported> stalled-cycles-frontend <not supported> stalled-cycles-backend 10,504,412,147 instructions # 1.06 insns per cycle (100.00%) 1,925,721,763 branches # 485.987 M/sec (100.00%) 55,018 branch-misses # 0.00% of all branches 3.955251872 seconds time elapsed
在鲲鹏920下的运行时间和IPC,两个循环最终执行时间一样,但是加锁的循环 IPC 反而要高,应该是加锁指令简单,比乘法对流水线更友好
1
2
3
4
5
6
7
8
9
10
11
12
13
14
15
16
17
18
19
20
21
22
23
24
25
26
27
28
29
30
31
32
33
34
35
36
37
38
39
40
41
42
43
#java test.LockBenchmark //鲲鹏920 Time spent is 37037ms without lock:10810.40962948895 start runIncrementWithLock. Time spent is 37045ms with lock:10817.060142949109 //极低的概率这里能跑出来15秒,应该是偷鸡优化了 #perf stat -p `jps | grep LockBenchmark | awk '{ print $1 }'` ^Cfailed to read counter branches Performance counter stats for process id '104166': 3459.850580 task-clock (msec) # 1.002 CPUs utilized 122 context-switches # 0.035 K/sec 1 cpu-migrations # 0.000 K/sec 257 page-faults # 0.074 K/sec 8,995,482,376 cycles # 2.600 GHz 344,461,881 stalled-cycles-frontend # 3.83% frontend cycles idle 7,060,741,196 stalled-cycles-backend # 78.49% backend cycles idle 2,667,443,624 instructions # 0.30 insns per cycle //不带Lock 乘除法拉低了IPC # 2.65 stalled cycles per insn <not supported> branches 93,302,896 branch-misses # 0.00% of all branches 3.453102950 seconds time elapsed #perf stat -p `jps | grep LockBenchmark | awk '{ print $1 }'` ^Cfailed to read counter branches Performance counter stats for process id '100351': 3205.548380 task-clock (msec) # 1.002 CPUs utilized 97 context-switches # 0.030 K/sec 0 cpu-migrations # 0.000 K/sec 93 page-faults # 0.029 K/sec 8,334,345,888 cycles # 2.600 GHz 10,217,474 stalled-cycles-frontend # 0.12% frontend cycles idle 6,389,615,752 stalled-cycles-backend # 76.67% backend cycles idle 4,374,642,352 instructions # 0.52 insns per cycle //带lock # 1.46 stalled cycles per insn <not supported> branches 2,053,478 branch-misses # 0.00% of all branches 3.199261610 seconds time elapsed
这个代码加锁后指令多了1倍,所以intel CPU下体现出来的时间就差了一倍(IPC一样的);鲲鹏 CPU下时间差不多是因为没加锁的IPC太低了(乘除法对流水线没优化好),最终IPC差了一倍,就把执行时间拉平了。另外就就是Intel和鲲鹏的执行时间对比和IPC也是一致的,IPC高执行就快。
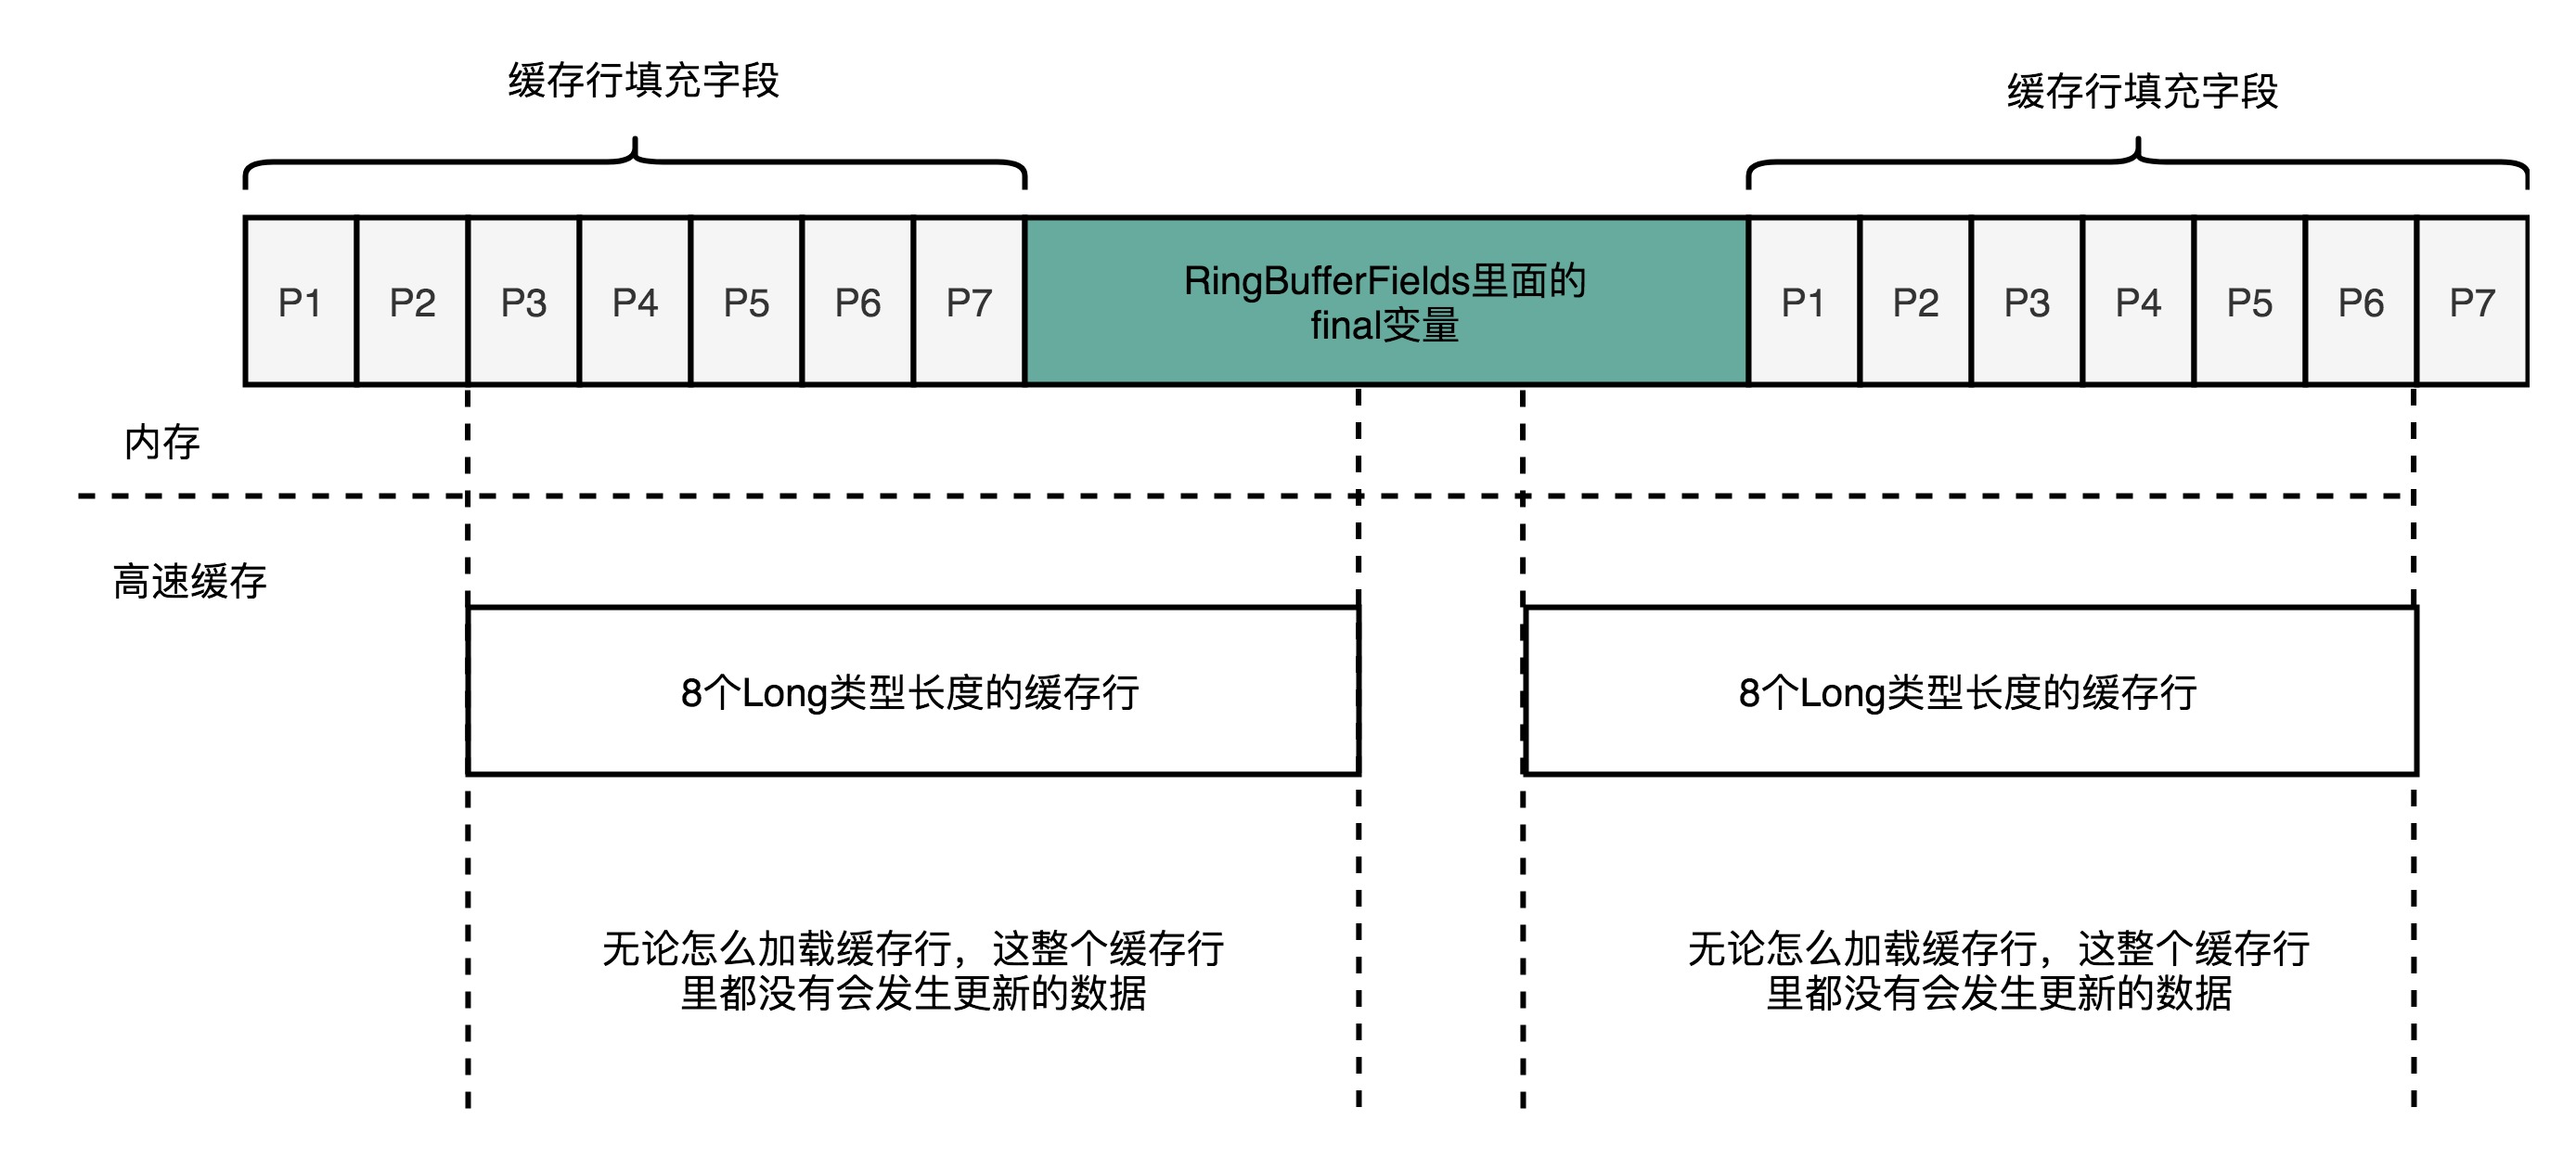
Disruptor中对cache_line的使用 1 2 3 4 5 6 7 8 9 10 11 12 13 14 15 16 17 18 19 20 21 abstract class RingBufferPad { protected long p1, p2, p3, p4, p5, p6, p7; } abstract class RingBufferFields<E> extends RingBufferPad { ...... private final long indexMask; private final Object[] entries; protected final int bufferSize; protected final Sequencer sequencer; ...... } public final class RingBuffer<E> extends RingBufferFields<E> implements Cursored, EventSequencer<E>, EventSink<E> { ...... protected long p1, p2, p3, p4, p5, p6, p7; ...... }
重点留意上述代码中的p1-p7这几个没有用的long变量,实际使用来占位,占住实际变量前后的位置,这样避免这些变量被其他变量的修改而失效。
队列大部分时候都是空的(head挨着tail),也就导致head 和 tail在一个cache line中,读和写会造成没必要的cache ping-pong,一般可以通过将head 和 tail 中间填充其它内容来实现错开到不同的cache line中
数组(RingBuffer)基本能保证元素在内存中是连续的,但是Queue(链表)就不一定了,连续的话更利于CPU cache
Intel PAUSE指令变化是如何影响自旋锁以及MySQL的性能的 MySQL利用Intel 的Pause指令在spinlock(自旋锁)的时候尽量避免cache line ping-pong,但是不同的Intel芯片每个Pause指令背后实际执行的circle是不一样的,从而导致MySQL性能差异很大
详细请看:
[《Intel PAUSE指令变化是如何影响自旋锁以及MySQL的性能的》 从一个参数引起的rt抖动定位到OS锁等待再到CPU Pause指令,以及不同CPU型号对Pause使用cycles不同的影响,最终反馈到应用层面的rt全过程。在MySQL内核开发的时候考虑了Pause,但是没有考虑不同的CPU型号,所以换了CPU型号后性能差异比较大](/2019/12/16/Intel PAUSE指令变化是如何影响自旋锁以及MySQL的性能的/)
pause 和 spinlock spinlock(自旋锁) 是内核中最常见的锁,它的特点是:等待锁的过程中不休眠,而是占着CPU空转,优点是避免了上下文切换的开销,缺点是该CPU空转属于浪费, 同时还有可能导致cache ping-pong,spinlock适合用来保护快进快出的临界区 。持有spinlock的CPU不能被抢占,持有spinlock的代码不能休眠
ECS cache_line miss导致整个物理机响应慢 如果一台ECS运行大量的cache_line miss逻辑 ,也就是利用spinlock所保护的区域没有按照cacheline对齐的时候,CPU为了保证数据一致性,会触发Super Queue lock splits,将总线锁住,哪怕是其他socket,而这个时候,其他CPU CORE访问L2cache、L3cahe、以及内存就会阻塞,直到Super Queue lock splits释放。
这个影响不是socket、node内部,而是整个物理机总线被锁,所以影响的是整个物理机。
Intel CPU微架构允许不对齐的内存访问,但ARM、RISC-V等架构却不允许。在众多的不对齐中,一个特殊的场景是:原子操作的操作数(由于地址不对齐)跨越两个cache lines,Intel将之叫做split lock。 它有两个特征:
原子操作,即汇编指令包含Lock前缀;
操作数地址不对齐,还跨越两个cache lines;
其实大部分吃瓜群众都不知道这个特性,但是它却对应用性能影响极大。Intel工程师Fenghua Yu同学正在开发一组内核补丁,用于检测和处理split lock,现在已经发出了第8版code review 。阿里巴巴在多年前就意识到split lock的危害,在线上实施了大规模监控,并采取必要隔离措施。
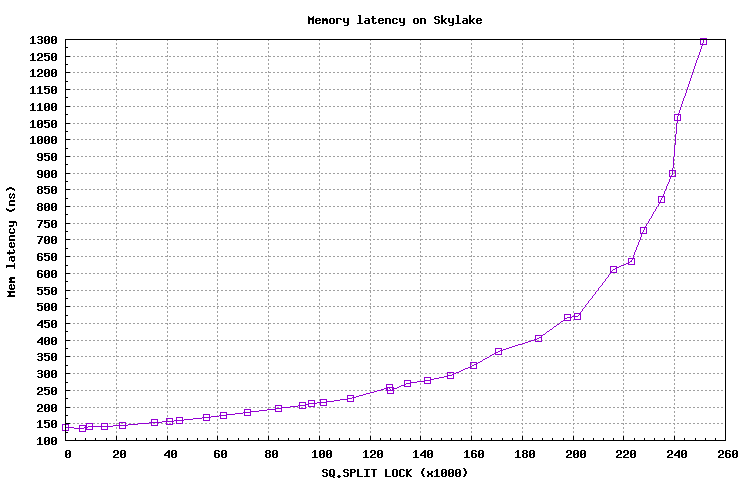
学过体系结构的同学都应该知道,缓存一制性协议MESI只能保证cache line粒度的一致性。同时访问两个cache lines不是常见操作,为保证split lock的原子性,设计硬件时使用特殊逻辑(冷路径)来处理:锁住整个访存总线,阻止其它逻辑cpu访存 。
从原理出发,我们很容易想到,锁住总线将导致其它core上访存操作受阻,宏观表现为平均访存延时显著上升。为不让各位看官白走一趟,小编在自己的skylake机器上测了一组数据,随着split lock速率的增加,访存延迟呈指数恶化。
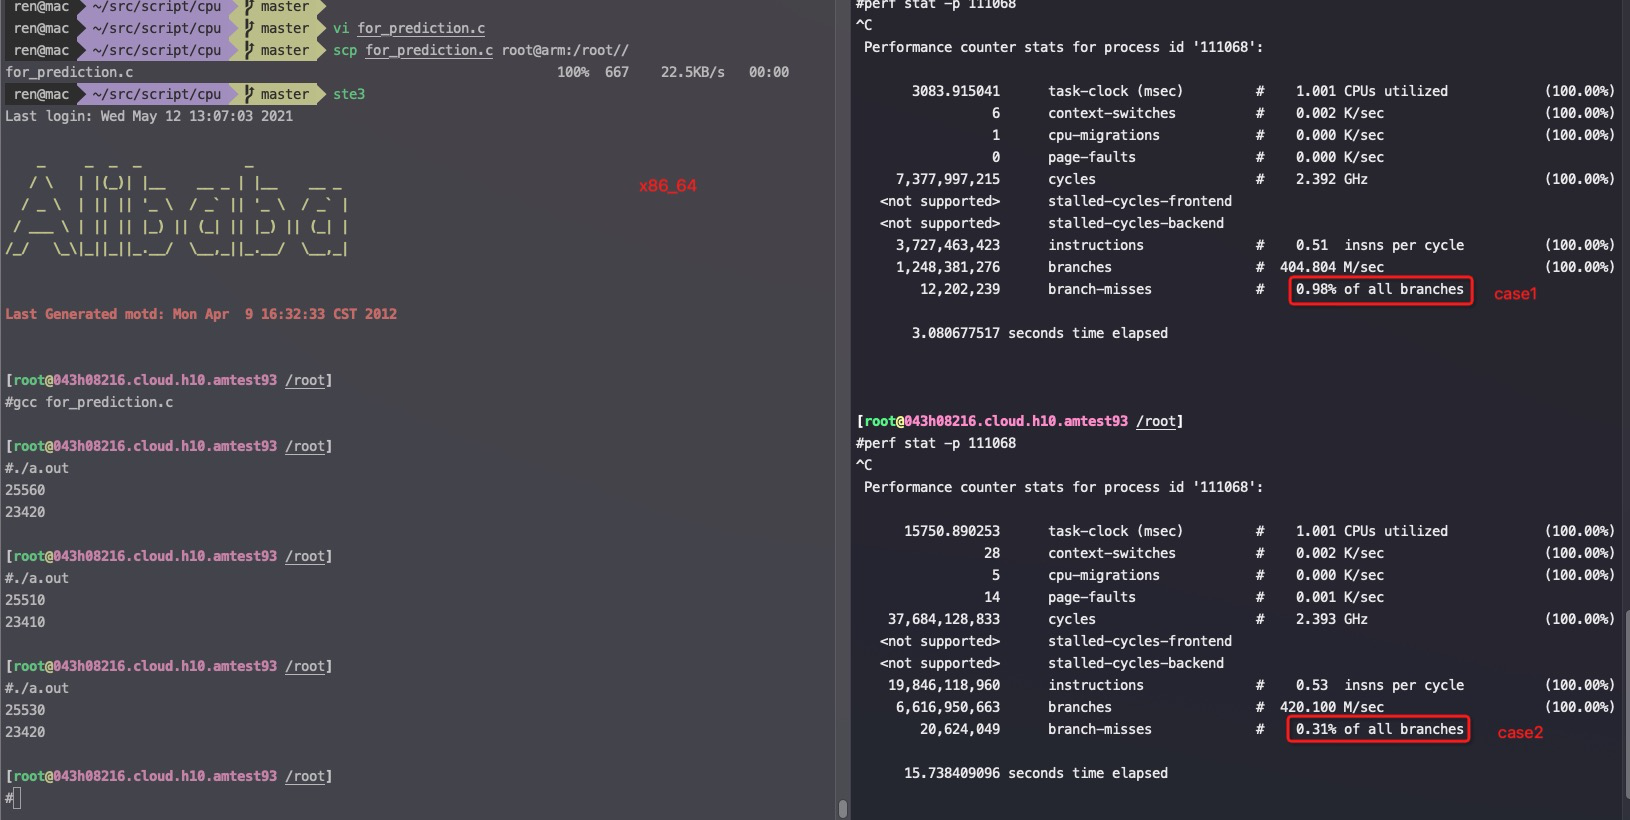
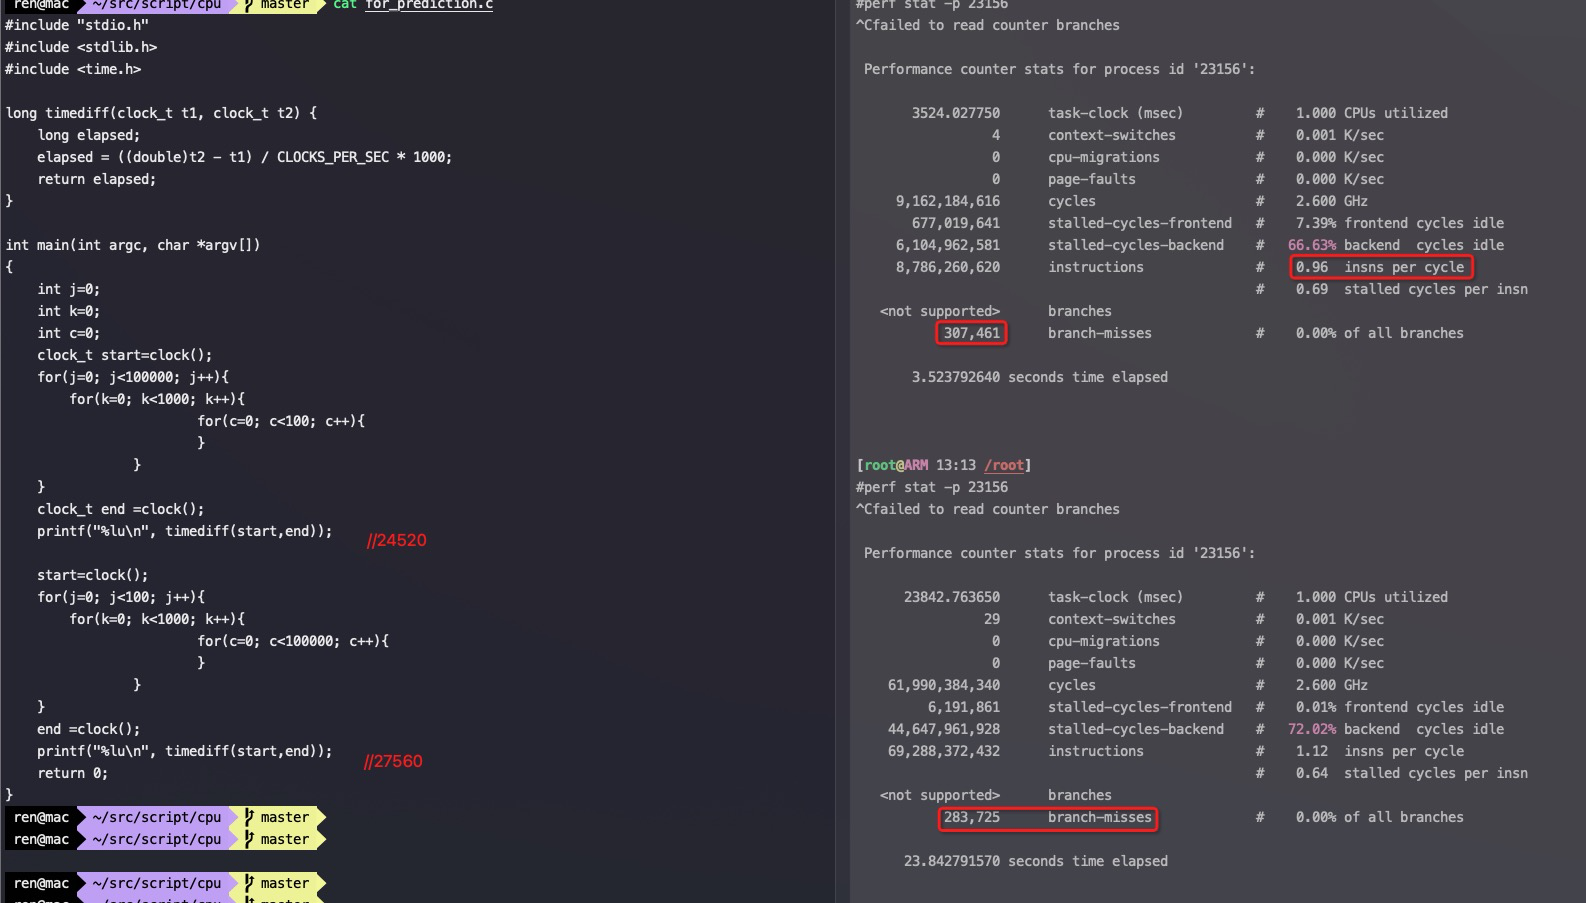
分支预测案例 这个案例总循环次数一样多,但是里外循环次数不一样:
1 2 3 4 5 6 7 8 9 10 11 12 13 14 15 16 17 18 19 20 21 22 23 24 25 26 27 28 29 30 31 32 33 34 35 36 #include "stdio.h" #include <stdlib.h> #include <time.h> long timediff(clock_t t1, clock_t t2) { long elapsed; elapsed = ((double)t2 - t1) / CLOCKS_PER_SEC * 1000; return elapsed; } int main(int argc, char *argv[]) { int j=0; int k=0; int c=0; clock_t start=clock(); for(j=0; j<100000; j++){ for(k=0; k<1000; k++){ for(c=0; c<100; c++){ } } } clock_t end =clock(); printf("%lu\n", timediff(start,end)); //case1 start=clock(); for(j=0; j<100; j++){ for(k=0; k<1000; k++){ for(c=0; c<100000; c++){ } } } end =clock(); printf("%lu\n", timediff(start,end)); //case2 return 0; }
x86_64下的执行结果,确实是case2略快
1
2
3
4
5
6
7
#taskset -c 0 ./for_prediction.out 25560 23420 #taskset -c 0 ./for_prediction.out 25510 23410
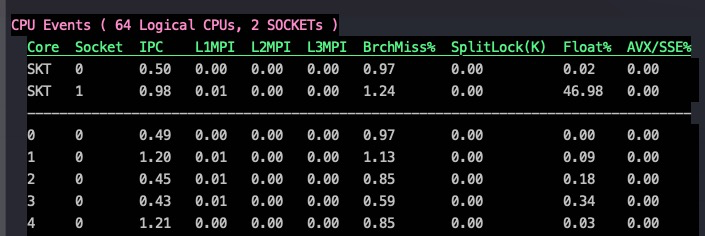
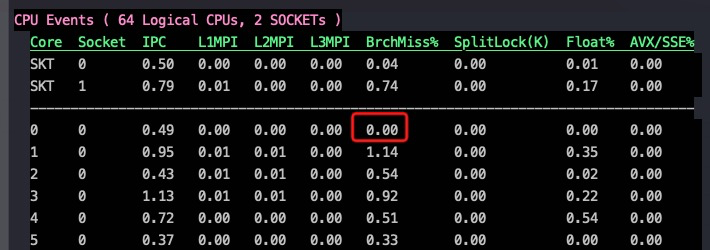
case1的branch miss大概接近1%(看0 core上的 BrchMiss%, 数据由 xperf 1.3.8采集)
case2的branch miss降到了0,不过两者在x86上的IPC都是0.49,所以最终的执行时间差异不大
在arm下case1反而更快,如截图
系列文章 CPU的制造和概念
[CPU 性能和Cache Line](/2021/05/16/CPU Cache Line 和性能/)
[Perf IPC以及CPU性能](/2021/05/16/Perf IPC以及CPU利用率/)
Intel、海光、鲲鹏920、飞腾2500 CPU性能对比
飞腾ARM芯片(FT2500)的性能测试
十年后数据库还是不敢拥抱NUMA?
一次海光物理机资源竞争压测的记录
[Intel PAUSE指令变化是如何影响自旋锁以及MySQL的性能的](/2019/12/16/Intel PAUSE指令变化是如何影响自旋锁以及MySQL的性能的/)
参考资料 Analysis of False Cache Line Sharing Effects on Multicore CPUs
Avoiding and Identifying False Sharing Among Threads
Gallery of Processor Cache Effects
7个示例科普CPU CACHE
Why is transposing a matrix of 512×512 much slower than transposing a matrix of 513×513 ? 矩阵倒置的时候因为同一个cache_line的数据频繁被update导致cache_line失效,也就是FALSE share
CPU时间都去哪了:一步步定位数据库代码中的性能瓶颈(SAP)
与程序员相关的CPU缓存知识