Intel、海光、鲲鹏920、飞腾2500 CPU性能对比
Intel 海光 鲲鹏920 飞腾2500 CPU性能对比
为了让程序能快点,特意了解了CPU的各种原理,比如多核、超线程、NUMA、睿频、功耗、GPU、大小核再到分支预测、cache_line失效、加锁代价、IPC等各种指标(都有对应的代码和测试数据)都会在这系列文章中得到答案。当然一定会有程序员最关心的分支预测案例、Disruptor无锁案例、cache_line伪共享案例等等。
这次让我们从最底层的沙子开始用8篇文章来回答各种疑问以及大量的实验对比案例和测试数据。
大的方面主要是从这几个疑问来写这些文章:
- 同样程序为什么CPU跑到800%还不如CPU跑到200%快?
- IPC背后的原理和和程序效率的关系?
- 为什么数据库领域都爱把NUMA关了,这对吗?
- 几个国产芯片的性能到底怎么样?
系列文章
[Perf IPC以及CPU性能](/2021/05/16/Perf IPC以及CPU利用率/)
[CPU 性能和Cache Line](/2021/05/16/CPU Cache Line 和性能/)
[Intel PAUSE指令变化是如何影响自旋锁以及MySQL的性能的](/2019/12/16/Intel PAUSE指令变化是如何影响自旋锁以及MySQL的性能的/)
本篇是收尾篇,横向对比一下x86和ARM芯片,以及不同方案权衡下的性能比较
CPU基本信息
海光
1 | #lscpu |
这CPU据说是胶水核,也就是把两个die拼一块封装成一块CPU,所以一块CPU内跨die之间延迟还是很高的。
64 个 core 的分配策略
1 | physical core processor |
Intel CPU
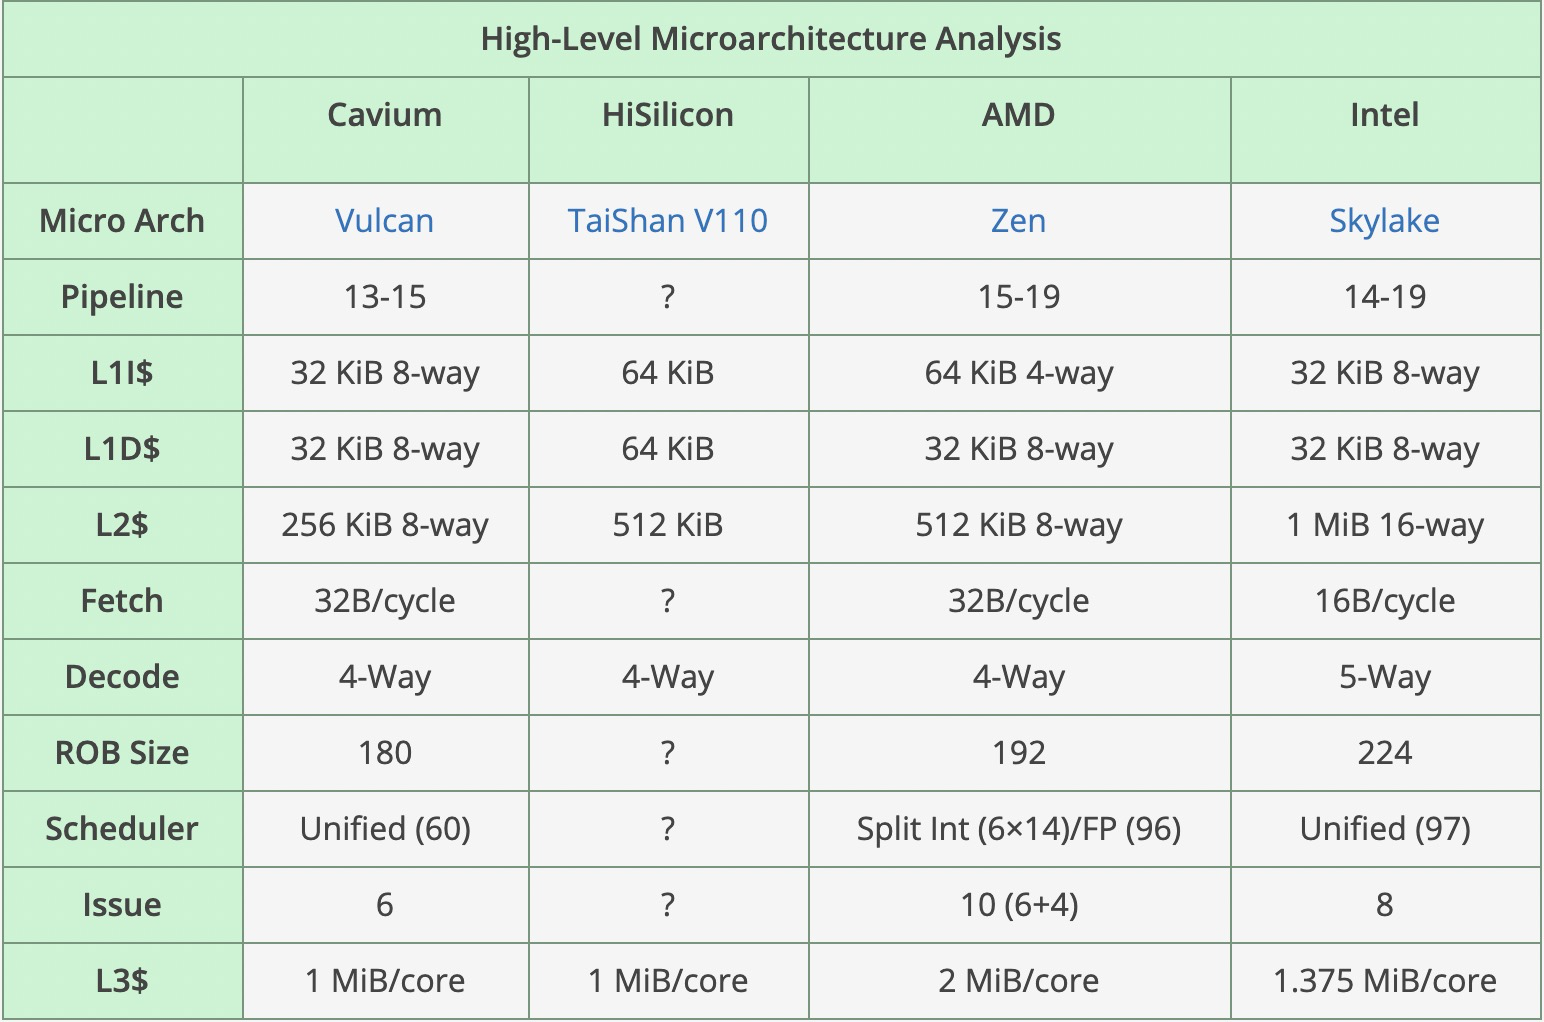
Cascade Lake架构相对Broadwell L1没变,L2从256K增加到1M增加了4倍,L3从2.5下降到1.38M每core
1 | #lscpu |
鲲鹏920
鲲鹏920-4826的L1比8269C 大一倍,但是L2小一倍。L3鲲鹏为1M/core 8269为1.38M/core(物理core)
1 | #lscpu |
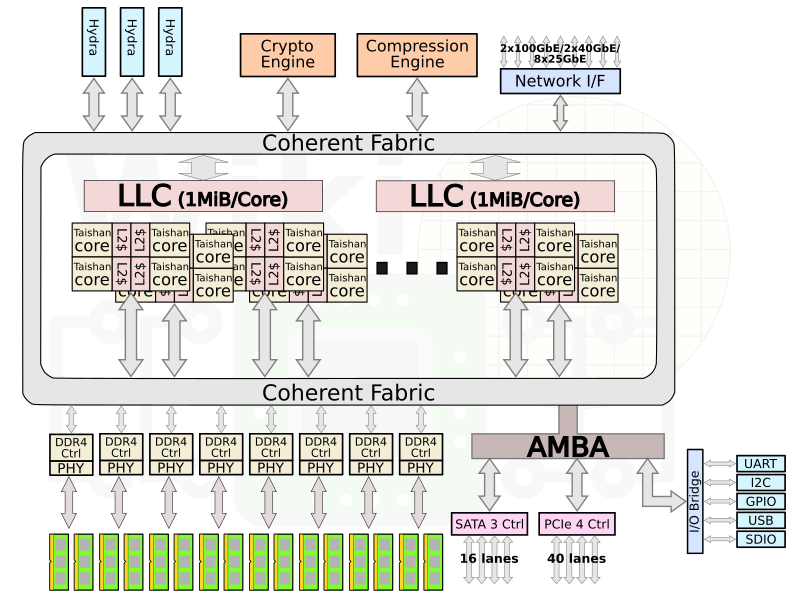
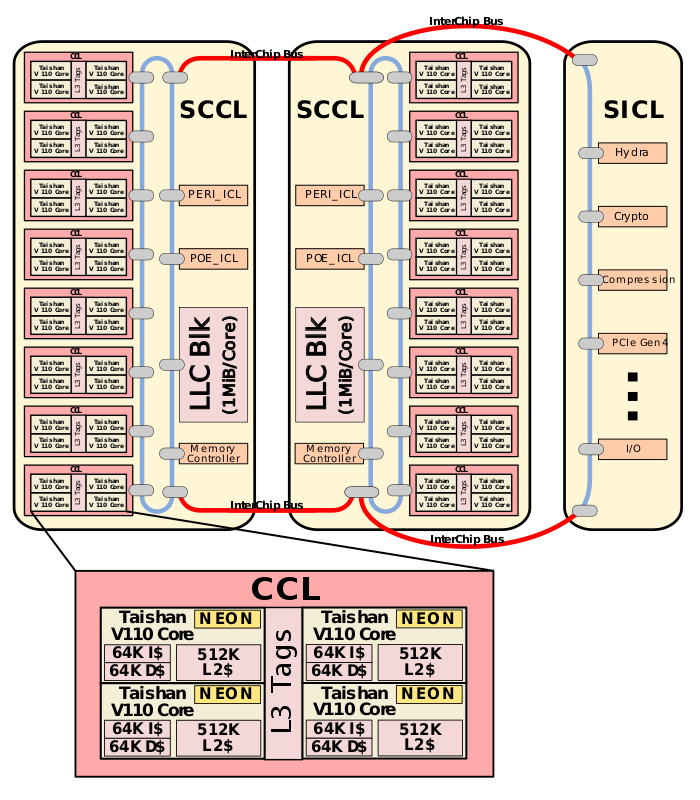
Though Huawei has been keeping a tight lip on the chip design itself, the Hi1620 is actually a multi-chip design. Actually, we believe are three dies. The chip itself comprise two compute dies called the Super CPU cluster (SCCL), each one packing 32 cores. It’s also possible the SCCL only have 24 cores, in which case there are three such dies with a theoretical maximum core count of 72 cores possible but are not offered for yield reasons. Regardless of this, there are at least two SCCL dies for sure. Additionally, there is also an I/O die called the Super IO Cluster (SICL) which contains all the high-speed SerDes and low-speed I/Os.
下图是6426型号,我测试用的是4826型号,也就是一个CPU内是48core,一个CPU封装3个Die,两个Die是 core,还有一个是Super IO Cluster
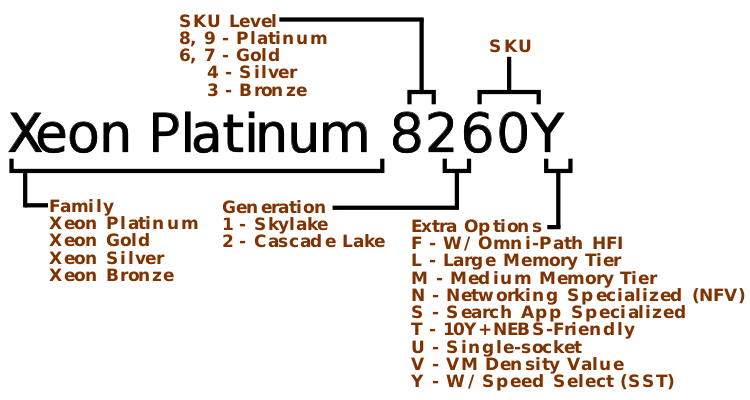
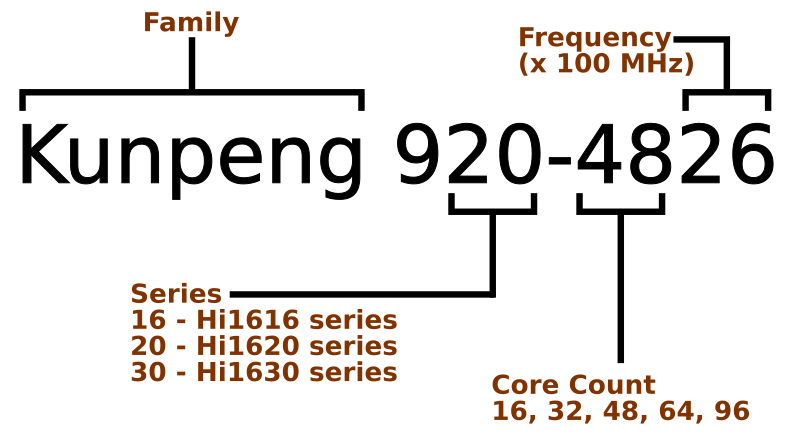
鲲鹏命令规范:
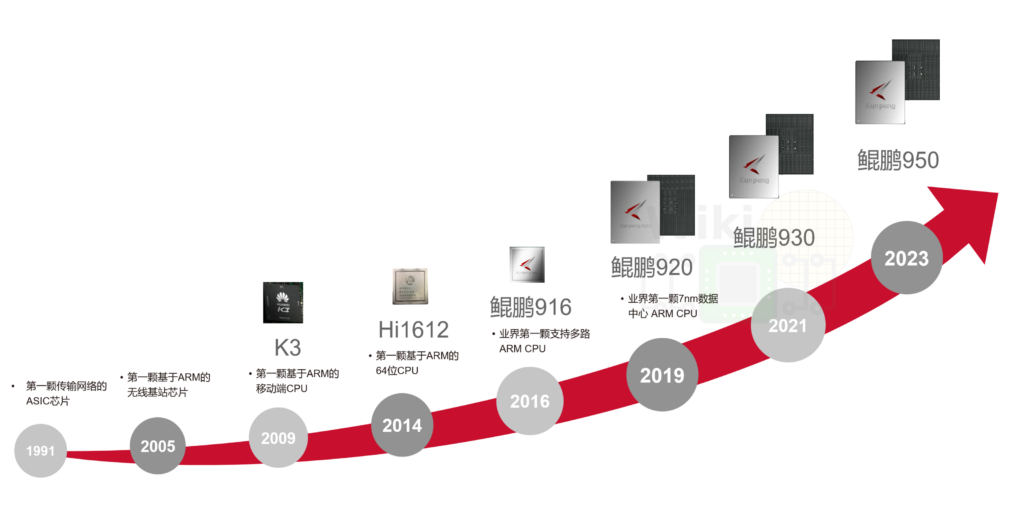
鲲鹏 RoadMap
鲲鹏 Kunpeng 920-4826 跨numa性能比较
绑24core,跨numa0、numa3,是numactl -H看到的比较远距离。两分钟的 Current tpmC: 69660
1 | #taskset -a -cp 12-23,72-83 20799 |
绑72-95core,在同一个numa下,但是没有重启进程,导致有一半内存仍然在numa0上,2分钟的Current tpmC: 75900
1 | #taskset -a -cp 72-95 20799 |
重启进程后继续绑72-95core,在同一个numa下,先进成充分热身,然后2分钟的 Current tpmC: 77880
1 | #perf stat -e branch-misses,bus-cycles,cache-misses,cache-references,cpu-cycles,instructions,stalled-cycles-backend,stalled-cycles-frontend,L1-dcache-load-misses,L1-dcache-loads,L1-dcache-store-misses,L1-dcache-stores,L1-icache-load-misses,L1-icache-loads,branch-load-misses,branch-loads,dTLB-load-misses,dTLB-loads,iTLB-load-misses,iTLB-loads,cpu-migrations -p 49512 |
IPC从0.42到0.44再到0.46,tpmC也不断增加,整体压力都不大只压了25%的CPU,所以跨NUMA大概有10%的性能差异. IPC也是0.42 VS 0.46 。测试场景是DRDS Server服务。
如果跨4core绑定core的话最好和最差绑法性能会下降25-30%,四个core绑不同numa的性能比较
| 被压进程绑定的core id | tpmC |
|---|---|
| 72,73,74,75 | 14460 |
| 48,49,72,73 | 13800 |
| 24,25,72,73 | 11760 |
| 0,1,72,73 | 11940 |
| 0,24,48,72 | 10800 |
飞腾2500
1 | #lscpu |
申威3231
申威系列微处理器的开发主要是被中华人民共和国用于军事方面[来源请求]。根据部分公开信息表明,此系列的微体系架构基于DEC Alpha派生而来。[1][2]而SW-3/SW1600处理器则是基于Alpha 21164。[3]
不过申威系列最新的SW26010处理器,目前没有详细的信息表明它是基于DEC Alpha微架构的派生品。[4][5]不过处理器的处理器核心结构布局,则是类似于基于POWER指令集架构的Cell微架构。
申威 3231处理器是基于第三代“申威 64” 二次优化版核心(C3B)的国产高性能多核处理器。3231的内核与1621属于同一代,采用新一代工艺,最高主频2.5Ghz,32核心,3231基本上可以视为1621换工艺后的32核版本,主要面向高性能计算和高端服务器应用。
申威 3231采用“申威64”自主指令系统;
基于第三代“申威 64”二次优化版核心(C3B)的32核64位通用处理器;
采用CC-NUMA多核结构和SoC技术,片内包含8路DDR4存储控制器接口以及40lane的PCI-E 4.0标准I/O接口;
集成3路直连接口,可构建2路或4路服务器系统;
计算性能:双精度浮点性能可达1280GFlops,整数性能可达880Gops;
访存性能:最大传输率为3200Mbps,最大总存储器容量2TB;
I/O性能:双向聚合有效带宽可达到160GB/s,支持I/O虚拟化。
3232推出的时间会比3231迟一些,采用新一代CPU核,IPC会非常惊人,保底10/G,争取12/G,考虑倒申威团队一向严谨,以及过去基本没有让大家失望过,因而对3232的IPC,可以采用就高原则。
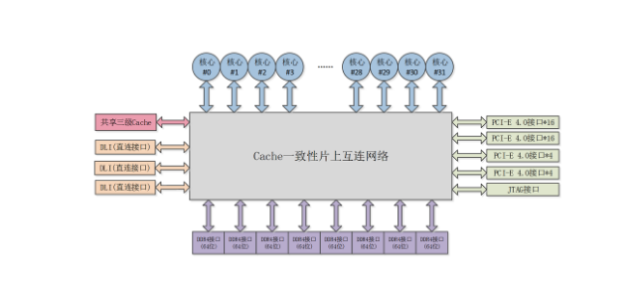
申威 3231架构
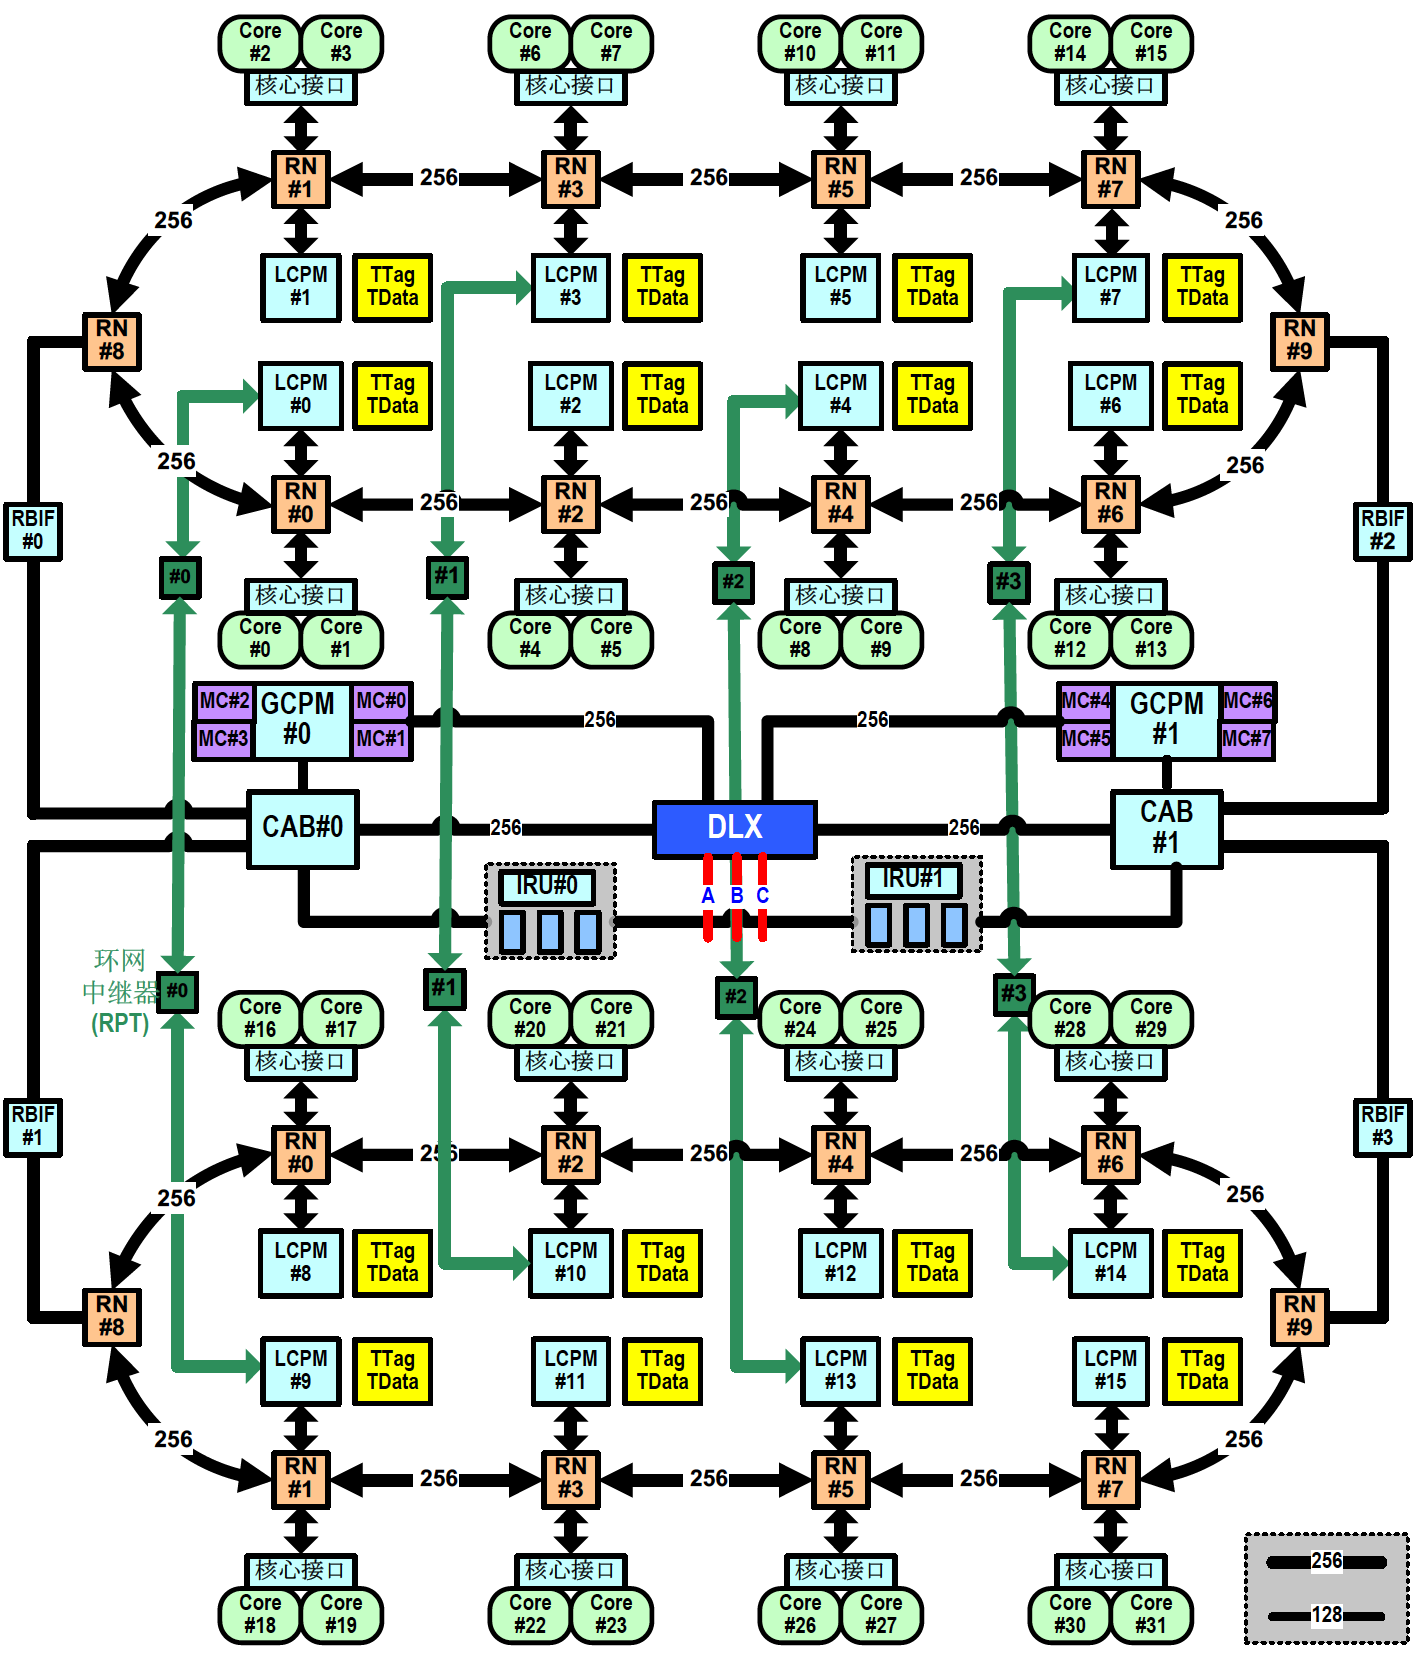
申威 6B 芯片结构的主要特点如下:
全芯片集成 32 个物理核心,每个物理核心支持 1 个线程,软件可见 32 个逻辑核心;
每个物理核心集成 32KB L1 指令 Cache(ICache)、32KB L1 数据 Cache(DCache)和 512KB 的 L2 Cache(SCache),核心内的所有 Cache 为核心私有 Cache;
全芯片集成 64MB 的 L3 Cache(TCache),本芯片内所有核心分布共享,TCache 由16 个体组成,每个体跟2 个物理核心及其对应的管理部件(LCPM)一起组成一个核组,连接在环网节点上,核心访问不同 TCache 体中的副本延迟略有不同;
存储器接口:全芯片集成 8 个 DDR4 存储器通道,每个通道数据宽度为 72bit(含 8 位 ECC),支持 UDIMM、RDIMM 和 LRDIMM,单通道内存容量最大支持 256GB 容量,单通道带宽可达 25.6GB/s(DDR4-3200);每4 个存储器通道对应一个主存代理部件(GCPM),所有核心和 IO 设备都可访问;
PCIe 接口:全芯片集成 40 Lane 的 PCIe 4.0 链路,支持 x4、x8 和 x16 灵活配置,最大支持 6 个 RC;
直连接口:全芯片集成 3 路直连接口,可构建 2 路或 4 路服务器系统,每路直连接口为9 个lane的serdes 接口,接口速率为28Gbps;
维护调试测试接口:维护控制部件实现芯片配置、初始引导以及提供各种维护和调试支持。维护控制部件支持芯片的上电初始化、配置加载、存储器读写或 IO 读写、维护中断以及内部状态的扫描观测等。支持外部维护通过 Jtag 接口进行初始引导;支持通过 SPI Master 接口从 SPI Flash中进行自举引导;
集成三套 I2C 接口、一套 Uart、GPIO 和 LPC 低速接口。
申威1621处理器是基于第三代“申威64”核心(增强版)的国产高性能多核处理器,主要面向高性能计算和中高端服务器应用。目前,该处理器已经实现量产。
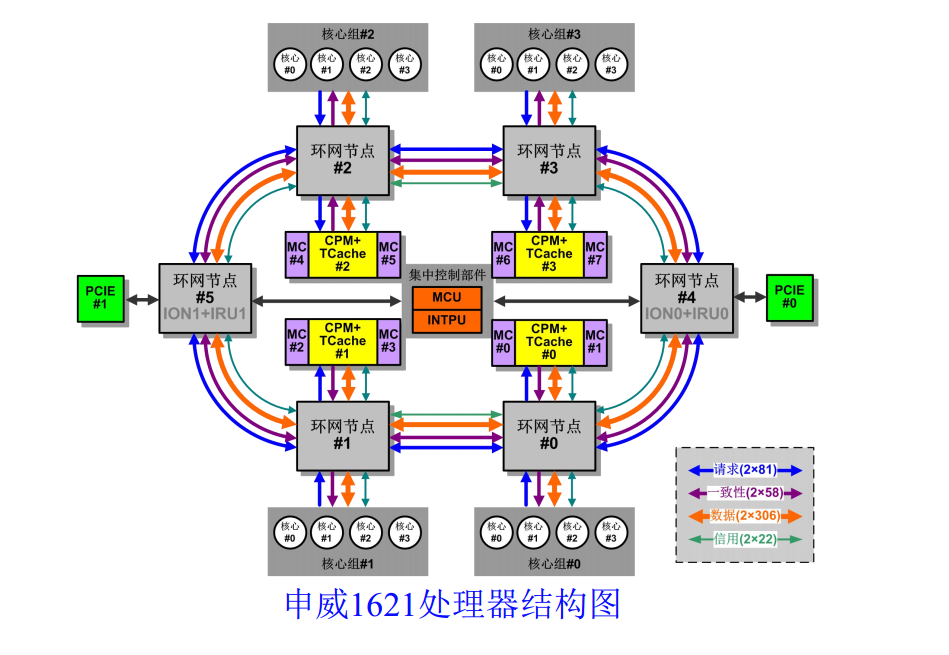 申威1621采用对称多核结构和SoC技术,单芯片集成了16个64位RISC结构的申威处理器核心,目标设计主频为2GHz。芯片还集成八路DDR3存储控制器和双路PCI-E3.0标准I/O接口。
1 | #dmidecode -t processor |
openssl speed aes-256-ige性能比较
测试脚本
openssl speed aes-256-ige -multi 1
单核能力
| Intel (52物理core) | aes-256 ige 89602.86k 97498.37k 98271.49k 98399.91k 89101.65k |
|---|---|
| 海光(32物理core) | aes-256 ige 76919.66k 77935.81k 79201.88k 79529.30k 79555.24k |
| 鲲鹏920(96物理core) | aes-256 ige 133174.89k 140578.99k 142156.46k 142663.34k 143196.16k |
测试32个线程并行
| Intel (52物理core) | aes-256 ige 2642742.25k 2690638.98k 2703860.74k 2734114.82k 2680422.40 |
|---|---|
| 海光(32物理core) | aes-256 ige 2464568.75k 2499381.80k 2528665.34k 2544845.14k 2550723.93k |
| 鲲鹏920(96物理core) | aes-256 ige 4261589.92k 4501245.55k 4552731.56k 4570456.75k 4584330.58k |
将所有核跑满包括HT
| Intel (52物理core) | aes-256 ige 4869950.82k 5179884.71k 5135412.14k 5211367.08k 5247858.60k |
|---|---|
| 海光(32物理core) | aes-256 ige 2730195.74k 2836759.53k 2865252.35k 2857900.71k 2884302.17k |
| 鲲鹏920(96物理core) | aes-256 ige 12788358.79k 13502288.53k 13657385.98k 13710908.76k 13751432.53k |
单核计算 7^999999” 的性能对比
测试命令:bash -c ‘echo “7^999999” | bc > /dev/null’
| 执行时间(秒) | IPC | 主频 | |
|---|---|---|---|
| 海光 | 26.729972414 | 0.92 | 2.5G |
| 鲲鹏920 | 24.604603640 | 1.84 | 2.6G |
| 飞腾2500 | 39.654819568 | 0.43 | 2.1G |
| Intel | 18.603323495 | 2.19 | 2.5G |
| 710 | 15.832394912 | 2.64 | 2.75G |
当然也可以通过计算pi值来测试
bash -c ‘ echo “scale=5000; 4*a(1)” | bc -l -q >/dev/null ‘
| 执行时间(秒) | 主频 | |
|---|---|---|
| 海光 | 31.061s | 2.5G |
| 鲲鹏920 | 23.521s | 2.6G |
| 飞腾2500 | 2.1G | |
| Intel | 22.979s(8163) | 2.5G |
| 710 | 15.570s | 2.75G |
多核一起跑的话可以这样:
for i in {0..95}; do time echo “scale=5000; 4*a(1)” | bc -l -q >/dev/null & done
perf stat -e branch-misses,bus-cycles,cache-misses,cache-references,cpu-cycles,instructions,stalled-cycles-backend,stalled-cycles-frontend,L1-dcache-load-misses,L1-dcache-loads,L1-dcache-store-misses,L1-dcache-stores,L1-icache-load-misses,L1-icache-loads,branch-load-misses,branch-loads,dTLB-load-misses,dTLB-loads,iTLB-load-misses,iTLB-loads –
710
耗时15.83秒,ipc 2.64
1 | perf stat -e branch-misses,bus-cycles,cache-misses,cache-references,cpu-cycles,instructions,stalled-cycles-backend,stalled-cycles-frontend,alignment-faults,bpf-output,context-switches,cpu-clock,cpu-migrations,dummy,emulation-faults,major-faults,minor-faults,page-faults,task-clock,L1-dcache-load-misses,L1-dcache-loads,L1-icache-load-misses,L1-icache-loads,LLC-load-misses,LLC-loads,branch-load-misses,branch-loads,dTLB-load-misses,dTLB-loads,iTLB-load-misses,iTLB-loads -- bash -c 'echo "7^999999" | bc > /dev/null' |
intel
耗时18.60秒,ipc 2.19
1 | # sudo perf stat -e branch-instructions,branch-misses,bus-cycles,cache-misses,cache-references,cpu-cycles,instructions,ref-cycles,L1-dcache-load-misses,L1-dcache-loads,L1-dcache-stores,L1-icache-load-misses,LLC-load-misses,LLC-loads,LLC-store-misses,LLC-stores,branch-load-misses,branch-loads,dTLB-load-misses,dTLB-loads,dTLB-store-misses,dTLB-stores,iTLB-load-misses,iTLB-loads,node-load-misses,node-loads,node-store-misses,node-stores -- bash -c 'echo "7^999999" | bc > /dev/null' |
鲲鹏920
耗时24.6秒, IPC 1.84
1 | #perf stat -e branch-misses,bus-cycles,cache-misses,cache-references,cpu-cycles,instructions,stalled-cycles-backend,stalled-cycles-frontend,L1-dcache-load-misses,L1-dcache-loads,L1-dcache-store-misses,L1-dcache-stores,L1-icache-load-misses,L1-icache-loads,branch-load-misses,branch-loads,dTLB-load-misses,dTLB-loads,iTLB-load-misses,iTLB-loads -- bash -c 'echo "7^999999" | bc > /dev/null' |
海光
耗时 26.73秒, IPC 0.92
1 | sudo perf stat -e branch-instructions,branch-misses,cache-references,cpu-cycles,instructions,stalled-cycles-backend,stalled-cycles-frontend,L1-dcache-load-misses,L1-dcache-loads,L1-dcache-prefetches,L1-icache-load-misses,L1-icache-loads,branch-load-misses,branch-loads,dTLB-load-misses,dTLB-loads,iTLB-load-misses,iTLB-loads -a -- bash -c 'echo "7^999999" | bc > /dev/null' |
飞腾
1 | time perf stat -e branch-misses,bus-cycles,cache-misses,cache-references,cpu-cycles,instructions,L1-dcache-load-misses,L1-dcache-loads,L1-dcache-store-misses,L1-dcache-stores,L1-icache-load-misses,L1-icache-loads,branch-load-misses,branch-loads,dTLB-load-misses,iTLB-load-misses -a -- bash -c 'echo "7^999999" | bc > /dev/null' |
perf 数据对比
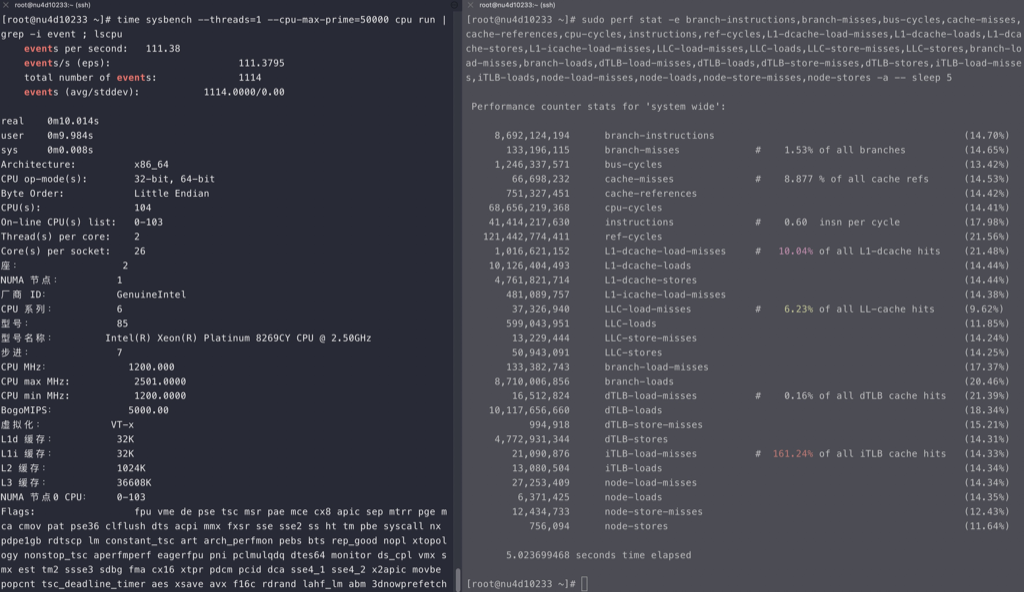
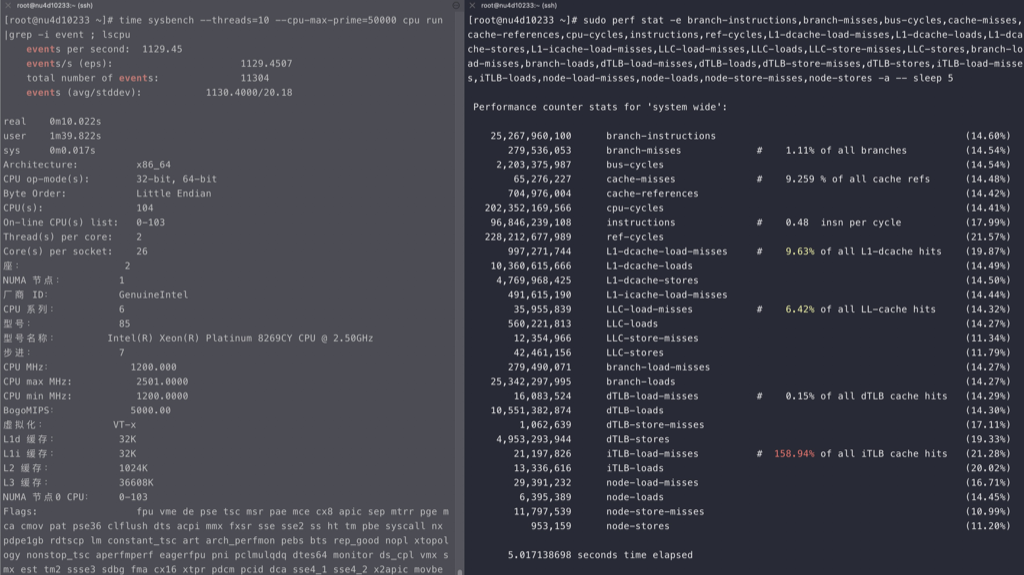
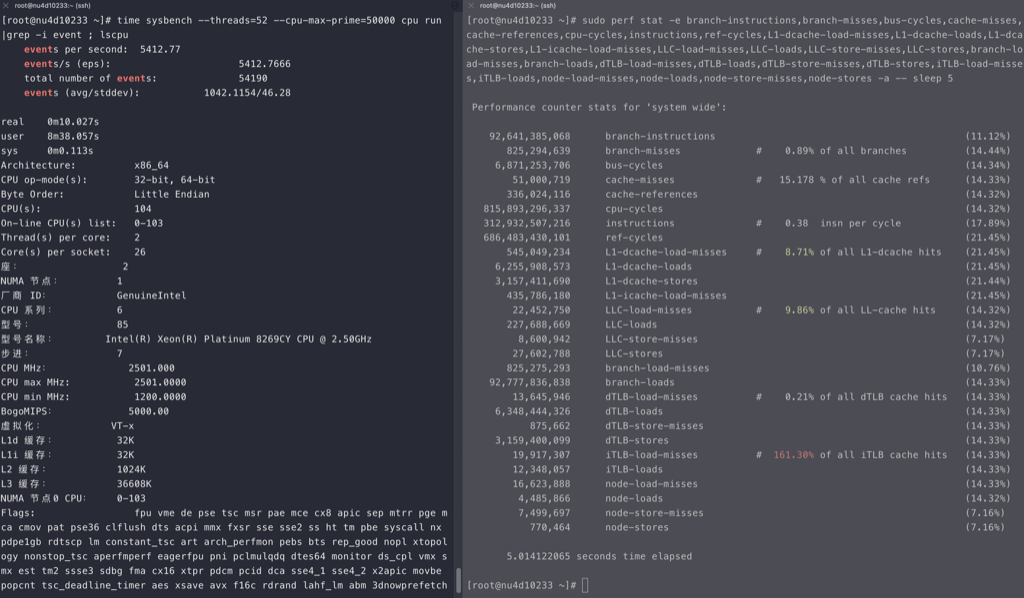
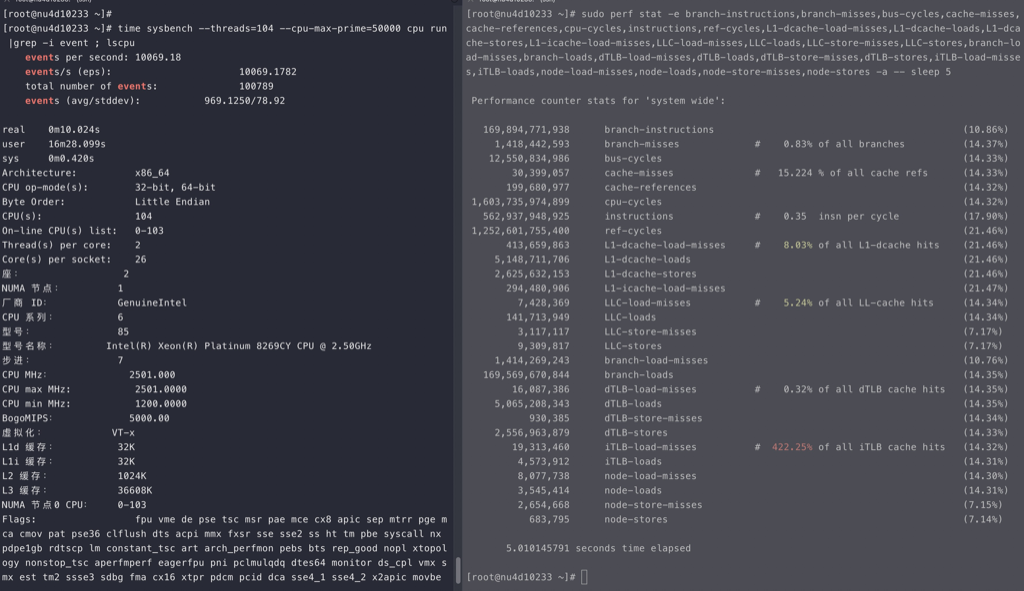
Intel
intel的cpu随着线程的增加,ipc稳定减少,但不是线性的
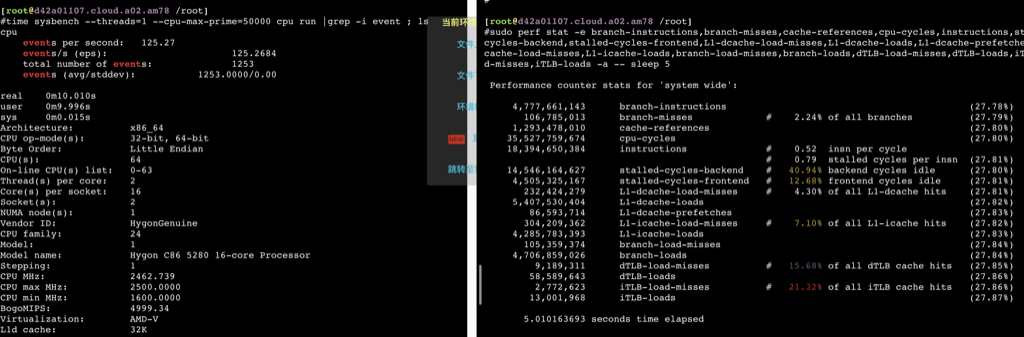
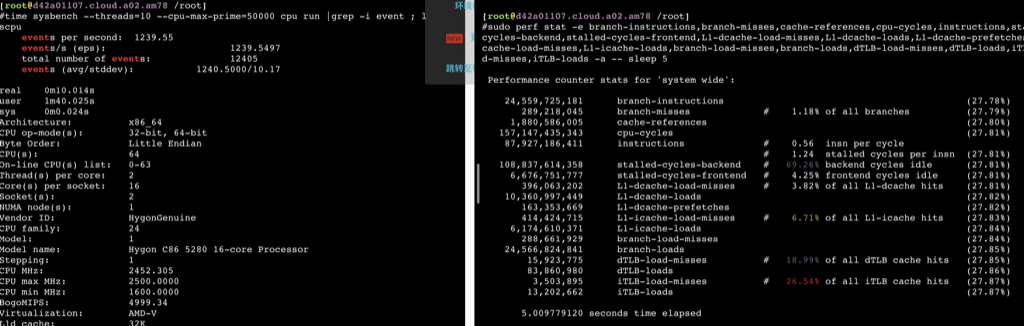
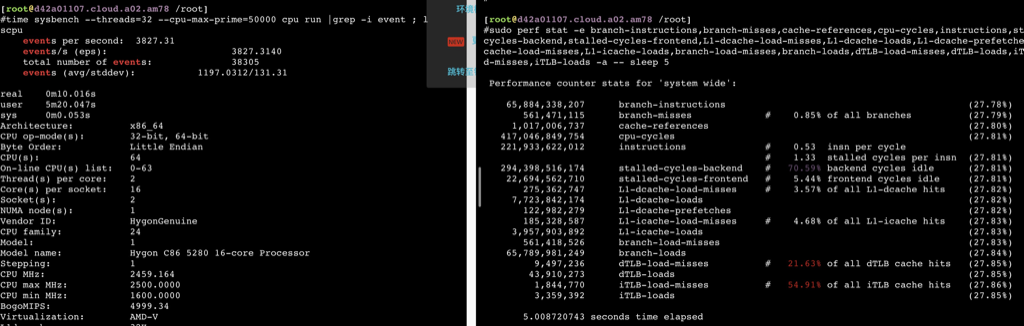
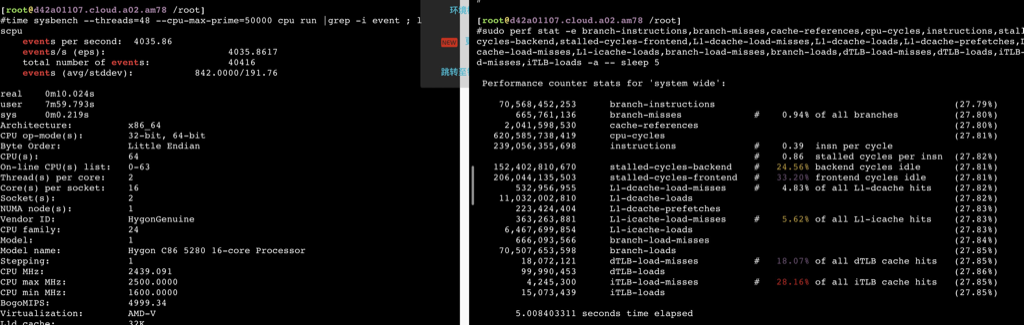
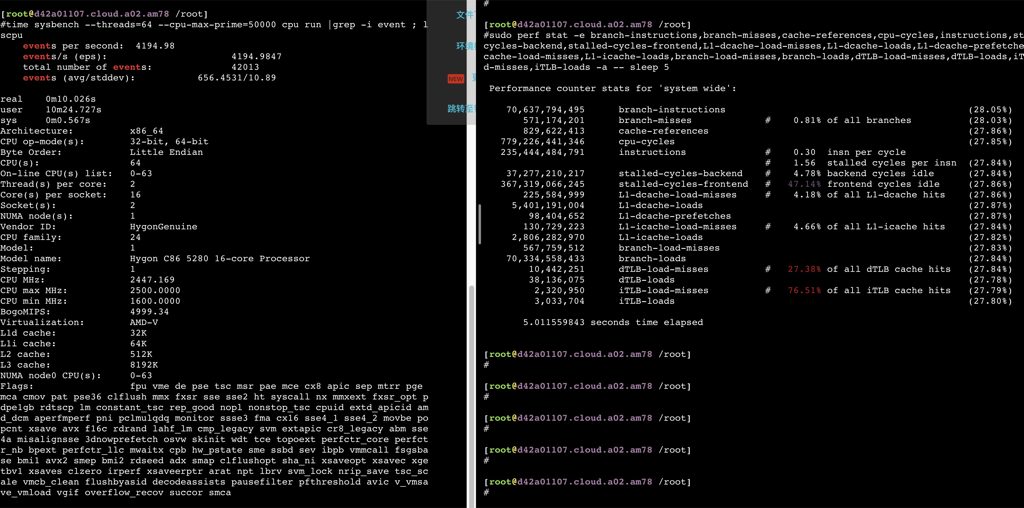
海光
如下数据可以看到在用满32个物理core之前,ipc保持稳定,超过32core后随着并发增加ipc相应减少,性能再也上不去了。
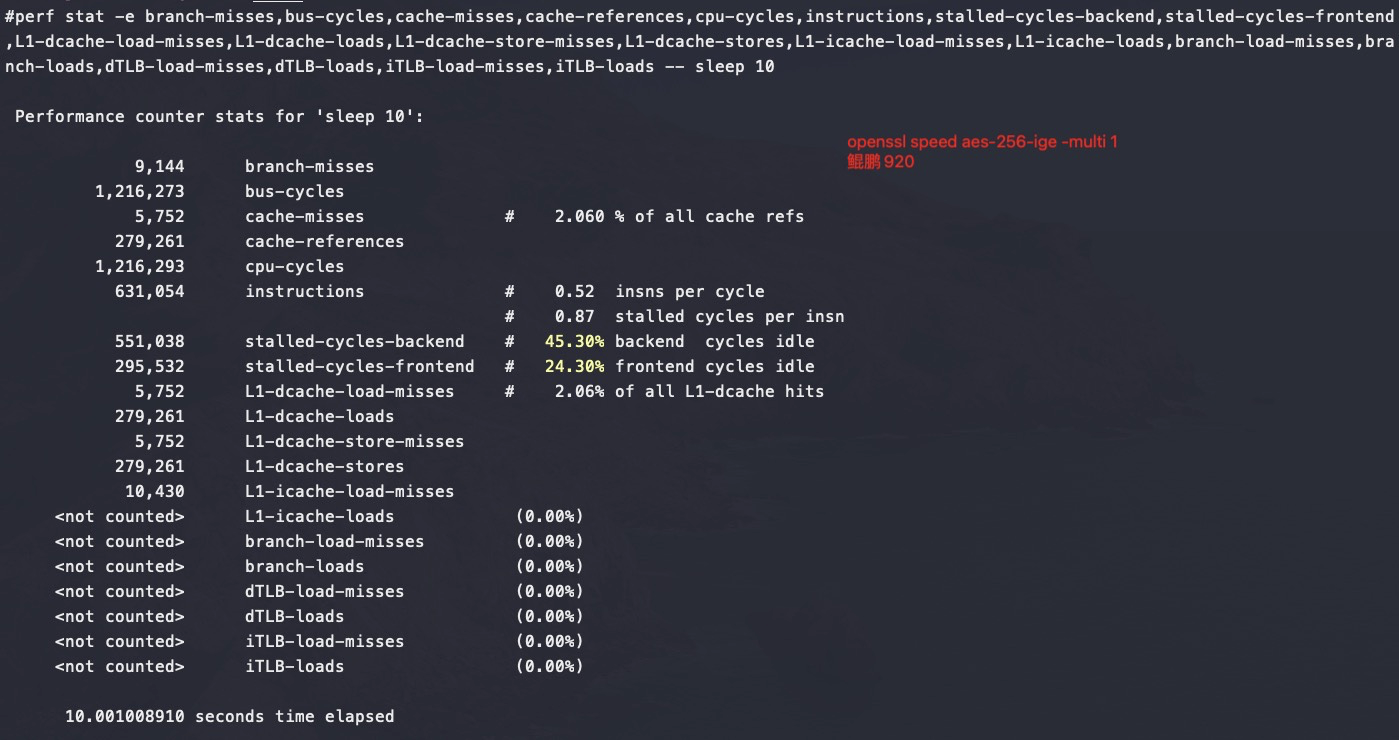
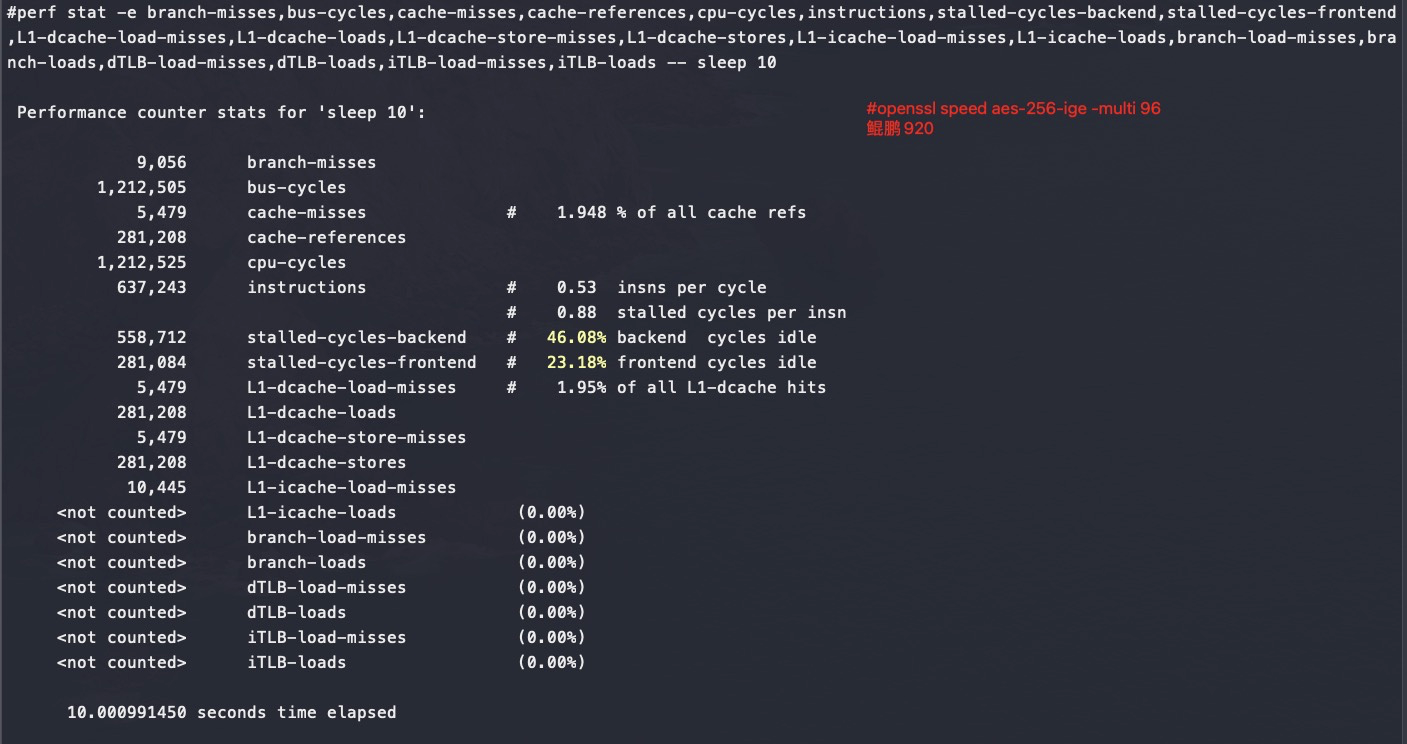
鲲鹏920
可以看到鲲鹏920多核跑openssl是没有什么争抢的,所以还能保证完全线性
小结
intel的流水线适合跑高带宽应用,不适合跑密集计算应用,也就是intel的pipeline数量少,但是内存读写上面优化好,乱序优化好。跑纯计算,不是intel的强项。
数据库场景下鲲鹏920大概相当于X86的70%的能力
prime计算一般走的fpu,不走cpu
intel x86 cpu bound和memory bond数据
测试代码
1 |
|
测试结果
cpu_bound部分飞腾只有intel性能的30%
如下测试perf数据可以看到IPC的明显差异
1 | sudo perf stat -e branch-instructions,branch-misses,bus-cycles,cache-misses,cache-references,cpu-cycles,instructions,ref-cycles,L1-dcache-load-misses,L1-dcache-loads,L1-dcache-stores,L1-icache-load-misses,LLC-load-misses,LLC-loads,LLC-store-misses,LLC-stores,branch-load-misses,branch-loads,dTLB-load-misses,dTLB-loads,dTLB-store-misses,dTLB-stores,iTLB-load-misses,iTLB-loads,node-load-misses,node-loads,node-store-misses,node-stores -a ./memory_bound |
飞腾
ipc 大概是intel的30%,加上主频也要差一些,
1 | time perf stat -e branch-misses,bus-cycles,cache-misses,cache-references,cpu-cycles,instructions,L1-dcache-load-misses,L1-dcache-loads,L1-dcache-store-misses,L1-dcache-stores,L1-icache-load-misses,L1-icache-loads,branch-load-misses,branch-loads,dTLB-load-misses,iTLB-load-misses -a ./cpu_bound |
unixBench 5.1.3 性能对比
测试命令: ./Run -c 1 -c 4
| 芯片 | 架构 | 逻辑核数 | 单核能力 | 4核能力 | 单核比值 | 4核比值 | 整机对比 |
|---|---|---|---|---|---|---|---|
| Intel 4114 | x86 | 40 | 1150 | 3095 | 100% | 100% | 100% |
| 海光 7165 | x86 | 48 | 1586 | 2533 | 138% | 82% | 98% |
| 华为鲲鹏920 | arm | 96 | 1168 | 2066 | 102% | 67% | 160% |
| 飞腾2000 | arm | 64 | 731 | 1902 | 64% | 61% | 98% |
| 申威1621 | alpha | 16 | 445 | 1065 | 39% | 34% | 14% |
以上CPU除了Intel,其它都没有HT,也就是Intel 4114实际是20个物理核。以上数据来自ata,仅供参考
ARM 和 X86的总结
对比硬件:
ARM:泰山ARM 双路 128核心64核心/路),2.5G,4指令/周期,8个内存通道/路,mips体系架构。
X86: intel 8163服务器 双路 48核心(24核心/路),2.5GHZ, 6指令/周期,96smt, 6个内存通道
用 Geabase(C++) 测试所得 ARM是X86 性能的1.36倍,接近理论值的1.4倍
理论值的计算公式:
CPU性能验证公式:频率 x 核数 x 发射数/周期 x 1.3/1.5(smt2/smt4) (smt是指超线程数量)
ARM 优势的来源主要是工艺领先一代(7nm VS 14nm)
总结
- 对纯CPU 运算场景,并发不超过物理core时,比如Prime运算,比如DRDS(CPU bound,IO在网络,可以加并发弥补)
- 海光的IPC能保持稳定;
- intel的IPC有所下降,但是QPS在IPC下降后还能完美线性
- 在openssl和MySQL oltp_read_only场景下
- 如果并发没超过物理core数时,海光和Intel都能随着并发的翻倍性能能增加80%
- 如果并发超过物理core数后,Intel还能随着并发的翻倍性能增加50%,海光增加就只有20%了
- 简单理解在这两个场景下Intel的HT能发挥半个物理core的作用,海光的HT就只能发挥0.2个物理core的作用了
- 海光zen1的AMD 架构,每个core只有一个fpu,综上在多个场景下HT基本上都可以忽略
- 飞腾2500性能比较差
- 国产CPU:飞腾、鲲鹏、龙芯、申威、海光(AMD授权)、兆芯(威盛via 授权x86)
- CPU性能验证公式:频率 x 核数 x 发射数/周期 x 1.3/1.5(smt2/smt4) (smt是指超线程数量)
- 大吞吐量计算由多核CPU数量决定,多核CPU数量由制程工艺决定,制程工艺由资本决定,制程工艺资本由主流消费电子决定, 摩尔定律仍在持续
系列文章
[CPU 性能和Cache Line](/2021/05/16/CPU Cache Line 和性能/)
[Perf IPC以及CPU性能](/2021/05/16/Perf IPC以及CPU利用率/)
[Intel PAUSE指令变化是如何影响自旋锁以及MySQL的性能的](/2019/12/16/Intel PAUSE指令变化是如何影响自旋锁以及MySQL的性能的/)