//打开 coredump $gdb /opt/taobao/java/bin/java core.24086 [New LWP 27184] [New LWP 27186] [New LWP 24086] [Thread debugging using libthread_db enabled] Using host libthread_db library "/lib64/libthread_db.so.1". Core was generated by `/opt/tt/java_coroutine/bin/java'. #0 0x00007f2fa4fada35 in pthread_cond_wait@@GLIBC_2.3.2 () from /lib64/libpthread.so.0 Missing separate debuginfos, use: debuginfo-install jdk-8.9.14-20200203164153.alios7.x86_64 (gdb) info threads //查看所有thread Id Target Id Frame 583 Thread 0x7f2fa56177c0 (LWP 24086) 0x00007f2fa4fab017 in pthread_join () from /lib64/libpthread.so.0 582 Thread 0x7f2f695f3700 (LWP 27186) 0x00007f2fa4fada35 in pthread_cond_wait@@GLIBC_2.3.2 () from /lib64/libpthread.so.0 581 Thread 0x7f2f6cbfb700 (LWP 27184) 0x00007f2fa4fada35 in pthread_cond_wait@@GLIBC_2.3.2 () from /lib64/libpthread.so.0 580 Thread 0x7f2f691ef700 (LWP 27176) 0x00007f2fa4fada35 in pthread_cond_wait@@GLIBC_2.3.2 () from /lib64/libpthread.so.0 579 Thread 0x7f2f698f6700 (LWP 27174) 0x00007f2fa4fada35 in pthread_cond_wait@@GLIBC_2.3.2 () from /lib64/libpthread.so.0
(gdb) thread apply all bt //查看所有线程堆栈 Thread 583 (Thread 0x7f2fa56177c0 (LWP 24086)): #0 0x00007f2fa4fab017 in pthread_join () from /lib64/libpthread.so.0 #1 0x00007f2fa4b85085 in ContinueInNewThread0 (continuation=continuation@entry=0x7f2fa4b7fd70 <JavaMain>, stack_size=1048576, args=args@entry=0x7ffe529432d0) at /ssd1/jenkins_home/workspace/ajdk.8.build.master/jdk/src/solaris/bin/java_md_solinux.c:1044 #2 0x00007f2fa4b81877 in ContinueInNewThread (ifn=ifn@entry=0x7ffe529433d0, threadStackSize=<optimized out>, argc=<optimized out>, argv=0x7f2fa3c163a8, mode=mode@entry=1, what=what@entry=0x7ffe5294be17 "com.taobao.tddl.server.TddlLauncher", ret=0) at /ssd1/jenkins_home/workspace/ajdk.8.build.master/jdk/src/share/bin/java.c:2033 #3 0x00007f2fa4b8513b in JVMInit (ifn=ifn@entry=0x7ffe529433d0, threadStackSize=<optimized out>, argc=<optimized out>, argv=<optimized out>, mode=mode@entry=1, what=what@entry=0x7ffe5294be17 "com.taobao.tddl.server.TddlLauncher", ret=ret@entry=0) at /ssd1/jenkins_home/workspace/ajdk.8.build.master/jdk/src/solaris/bin/java_md_solinux.c:1091 #4 0x00007f2fa4b8254d in JLI_Launch (argc=0, argv=0x7f2fa3c163a8, jargc=<optimized out>, jargv=<optimized out>, appclassc=1, appclassv=0x0, fullversion=0x400885 "1.8.0_232-b604", dotversion=0x400881 "1.8", pname=0x40087c "java", lname=0x40087c "java", javaargs=0 '\000', cpwildcard=1 '\001', javaw=0 '\000', ergo=0) at /ssd1/jenkins_home/workspace/ajdk.8.build.master/jdk/src/share/bin/java.c:304 #5 0x0000000000400635 in main ()
Thread 582 (Thread 0x7f2f695f3700 (LWP 27186)): #0 0x00007f2fa4fada35 in pthread_cond_wait@@GLIBC_2.3.2 () from /lib64/libpthread.so.0 #1 0x00007f2fa342d863 in Parker::park(bool, long) () from /opt/taobao/install/ajdk-8_9_14-b604/jre/lib/amd64/server/libjvm.so #2 0x00007f2fa35ba3c3 in Unsafe_Park () from /opt/taobao/install/ajdk-8_9_14-b604/jre/lib/amd64/server/libjvm.so #3 0x00007f2f9343b44a in ?? () #4 0x000000008082e778 in ?? () #5 0x0000000000000003 in ?? () #6 0x00007f2f88e32758 in ?? () #7 0x00007f2f6f532800 in ?? ()
Attaching to core core.24086 from executable /opt/taobao/java/bin/java, please wait... Debugger attached successfully. Server compiler detected. JVM version is 25.232-b604 Deadlock Detection:
$cat /etc/pam.d/system-auth #%PAM-1.0 # This file is auto-generated. # User changes will be destroyed the next time authconfig is run. auth required pam_env.so auth required pam_faildelay.so delay=2000000 auth sufficient pam_unix.so nullok try_first_pass auth requisite pam_succeed_if.so uid >= 1000 quiet_success auth required pam_deny.so
If dmesg does not show any information about NUMA, then increase the Ring Buffer size: Boot with ‘log_buf_len=16M’ (or some other big value). Refer the following kbase article How do I increase the kernel log ring buffer size? for steps on how to increase the ring buffer
Please install a package which provides this module, or verify that the module is installed correctly.
It's possible that the above module doesn't match the current version of Python, which is: 2.6.6 (r266:84292, Sep 4 2013, 07:46:00) [GCC 4.4.7 20120313 (Red Hat 4.4.7-3)]
If you cannot solve this problem yourself, please go to the yum faq at: http://yum.baseurl.org/wiki/Faq
Check and fix the related library paths or remove 3rd party libraries, usually libcurl or libssh2. On a x86_64 system, the standard paths for those libraries are /usr/lib64/libcurl.so.4 and /usr/lib64/libssh2.so.1
PROCESS STATE CODES Here are the different values that the s, stat and state output specifiers(header "STAT" or "S") will display to describe the state of a process: D uninterruptible sleep (usually IO) #不可中断睡眠 不接受任何信号,因此kill对它无效,一般是磁盘io,网络io读写时出现 R running or runnable (on run queue) #可运行状态或者运行中,可运行状态表明进程所需要的资源准备就绪,待内核调度 S interruptible sleep (waiting for an event to complete) #可中断睡眠,等待某事件到来而进入睡眠状态 T stopped by job control signal #进程暂停状态 平常按下的ctrl+z,实际上是给进程发了SIGTSTP 信号 (kill -l可查看系统所有的信号量) t stopped by debugger during the tracing #进程被ltrace、strace attach后就是这种状态 W paging (not valid since the 2.6.xx kernel) #没有用了 X dead (should never be seen) #进程退出时的状态 Z defunct ("zombie") process, terminated but not reaped by its parent #进程退出后父进程没有正常回收,俗称僵尸进程
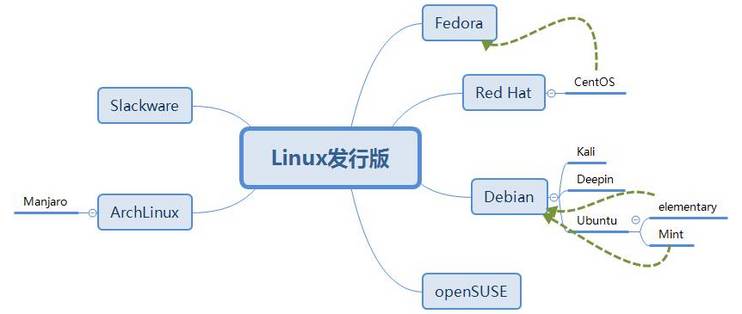
Fedora:基于Red Hat Linux,在Red Hat Linux终止发行后,红帽公司计划以Fedora来取代Red Hat Linux在个人领域的应用,而另外发行的Red Hat Enterprise Linux取代Red Hat Linux在商业应用的领域。Fedora的功能对于用户而言,它是一套功能完备、更新快速的免费操作系统,而对赞助者Red Hat公司而言,它是许多新技术的测试平台,被认为可用的技术最终会加入到Red Hat Enterprise Linux中。Fedora大约每六个月发布新版本。
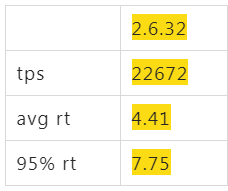
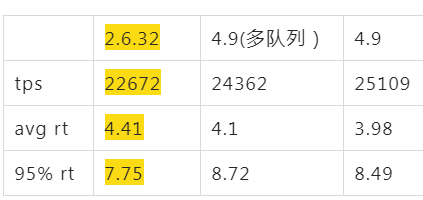
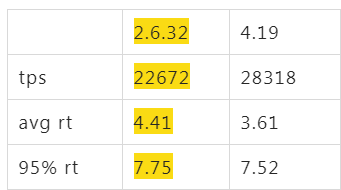
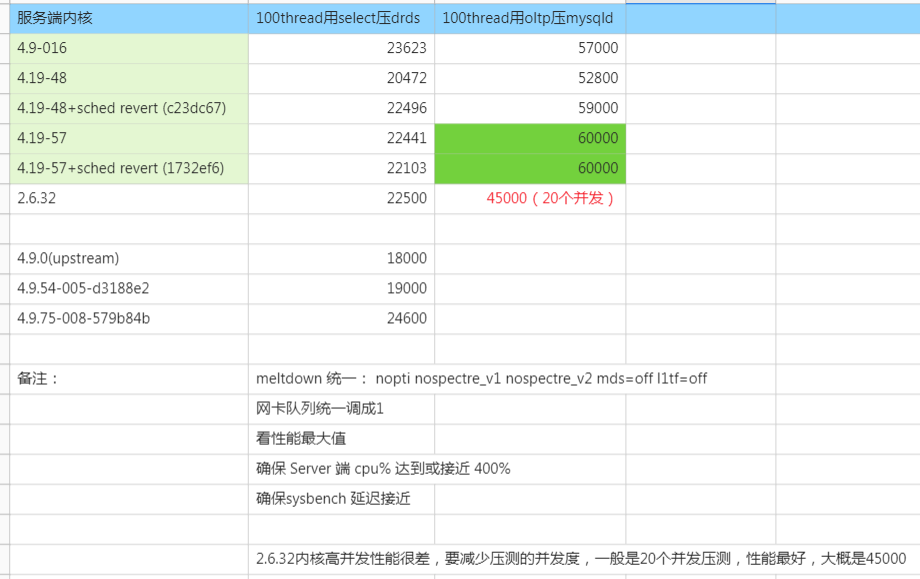
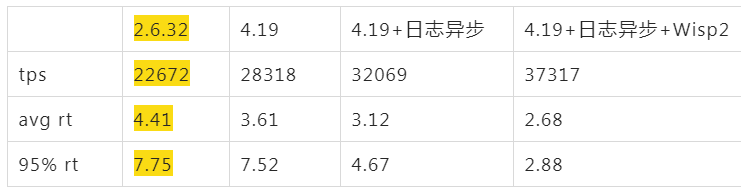
阿里云上默认买到的ALinux2 OS(4.19),同样配置跑起来后,tps只有16000,比2.6.32的22000差了不少,心里只能暗暗骂几句坑爹的货,看了下各项指标,看不出来什么问题,就像是CPU能力不行一样。如果这个时候直接找内核同学,估计他们心里会说 X 是个什么东西?是不是你们测试有问题,是不是你们配置的问题,不要来坑我,内核性能我们每次发布都在实验室里跑过了,肯定是你们的应用问题。
$~/tools/async-profiler/profiler.sh -e lock -d 5 1560
--- 1687260767618 ns (100.00%), 91083 samples
[ 0] ch.qos.logback.classic.sift.SiftingAppender
[ 1] ch.qos.logback.core.AppenderBase.doAppend
[ 2] ch.qos.logback.core.spi.AppenderAttachableImpl.appendLoopOnAppenders
[ 3] ch.qos.logback.classic.Logger.appendLoopOnAppenders
[ 4] ch.qos.logback.classic.Logger.callAppenders
[ 5] ch.qos.logback.classic.Logger.buildLoggingEventAndAppend
[ 6] ch.qos.logback.classic.Logger.filterAndLog_0_Or3Plus
[ 7] ch.qos.logback.classic.Logger.info
[ 8] com.*****.logger.slf4j.Slf4jLogger.info
[ 9] com.*****.utils.logger.support.FailsafeLogger.info
[10] com.*****.util.LogUtils.recordSql
"ServerExecutor-3-thread-480" #753 daemon prio=5 os_prio=0 tid=0x00007f8265842000 nid=0x26f1 waiting for monitor entry [0x00007f82270bf000]
java.lang.Thread.State: BLOCKED (on object monitor)
at ch.qos.logback.core.AppenderBase.doAppend(AppenderBase.java:64)
- waiting to lock <0x00007f866dcec208> (a ch.qos.logback.classic.sift.SiftingAppender)
at ch.qos.logback.core.spi.AppenderAttachableImpl.appendLoopOnAppenders(AppenderAttachableImpl.java:48)
at ch.qos.logback.classic.Logger.appendLoopOnAppenders(Logger.java:282)
at ch.qos.logback.classic.Logger.callAppenders(Logger.java:269)
at ch.qos.logback.classic.Logger.buildLoggingEventAndAppend(Logger.java:470)
at ch.qos.logback.classic.Logger.filterAndLog_0_Or3Plus(Logger.java:424)
at ch.qos.logback.classic.Logger.info(Logger.java:628)
at com.****.utils.logger.slf4j.Slf4jLogger.info(Slf4jLogger.java:42)
at com.****.utils.logger.support.FailsafeLogger.info(FailsafeLogger.java:102)
at com.****.util.LogUtils.recordSql(LogUtils.java:115)
ns percent samples top
---------- ------- ------- ---
160442633302 99.99% 38366 ch.qos.logback.classic.sift.SiftingAppender
12480081 0.01% 19 java.util.Properties
3059572 0.00% 9 com.***.$$$.common.IdGenerator
244394 0.00% 1 java.lang.Object
堆栈中也可以看到大量的:
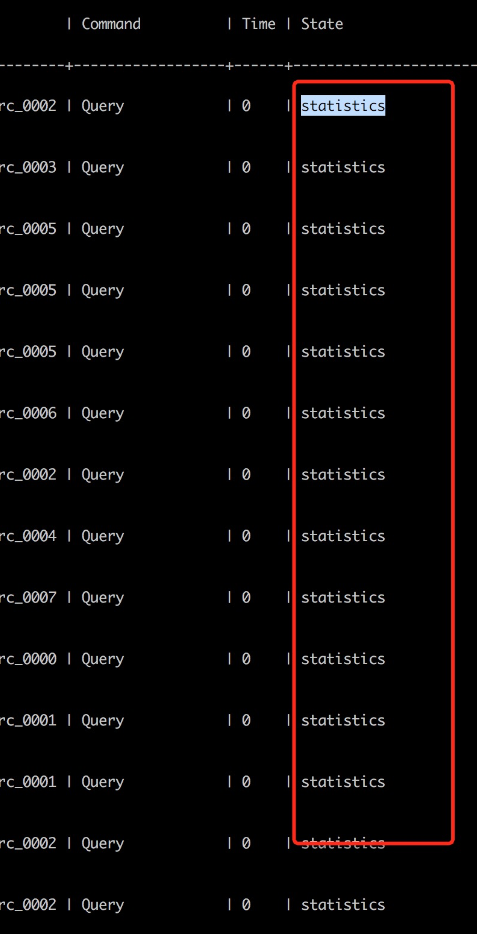
- waiting to lock <0x00007f866dcec208> (a ch.qos.logback.classic.sift.SiftingAppender) - waiting to lock <0x00007f866dcec208> (a ch.qos.logback.classic.sift.SiftingAppender) - waiting to lock <0x00007f866dcec208> (a ch.qos.logback.classic.sift.SiftingAppender) - waiting to lock <0x00007f866dcec208> (a ch.qos.logback.classic.sift.SiftingAppender) - waiting to lock <0x00007f866dcec208> (a ch.qos.logback.classic.sift.SiftingAppender) - waiting to lock <0x00007f866dcec208> (a ch.qos.logback.classic.sift.SiftingAppender) - waiting to lock <0x00007f866dcec208> (a ch.qos.logback.classic.sift.SiftingAppender) - locked <0x00007f866dcec208> (a ch.qos.logback.classic.sift.SiftingAppender) - waiting to lock <0x00007f866dcec208> (a ch.qos.logback.classic.sift.SiftingAppender) - waiting to lock <0x00007f866dcec208> (a ch.qos.logback.classic.sift.SiftingAppender) - waiting to lock <0x00007f866dcec208> (a ch.qos.logback.classic.sift.SiftingAppender) - waiting to lock <0x00007f866dcec208> (a ch.qos.logback.classic.sift.SiftingAppender) - waiting to lock <0x00007f866dcec208> (a ch.qos.logback.classic.sift.SiftingAppender) - waiting to lock <0x00007f866dcec208> (a ch.qos.logback.classic.sift.SiftingAppender) - waiting to lock <0x00007f866dcec208> (a ch.qos.logback.classic.sift.SiftingAppender) - waiting to lock <0x00007f866dcec208> (a ch.qos.logback.classic.sift.SiftingAppender)
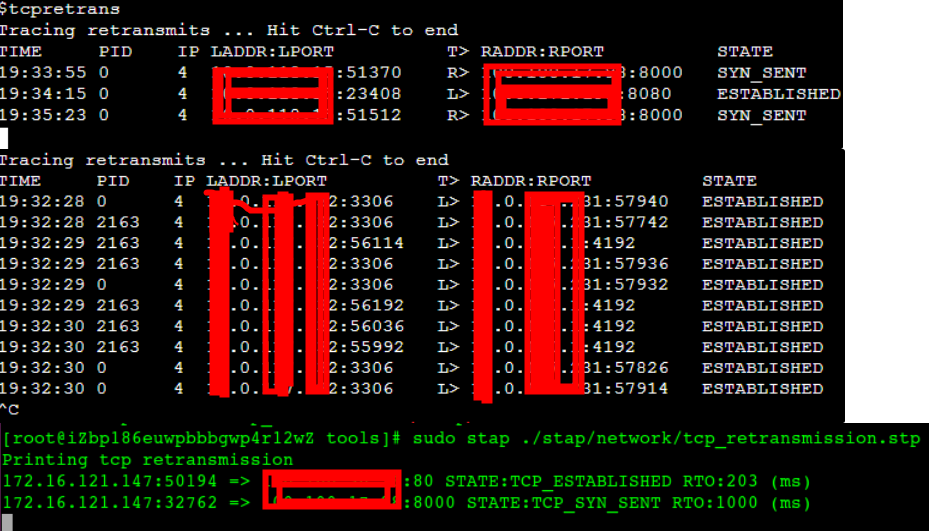
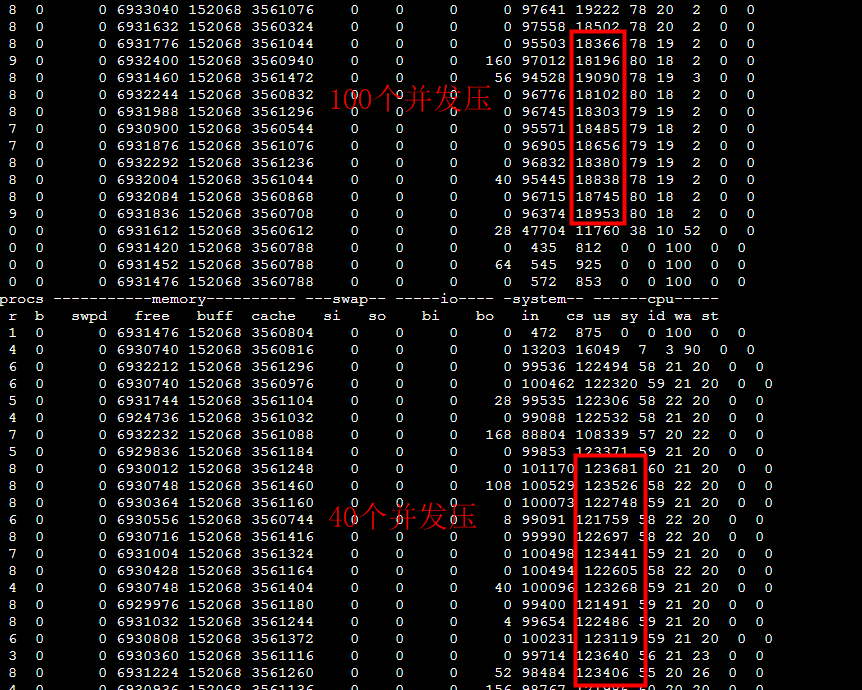
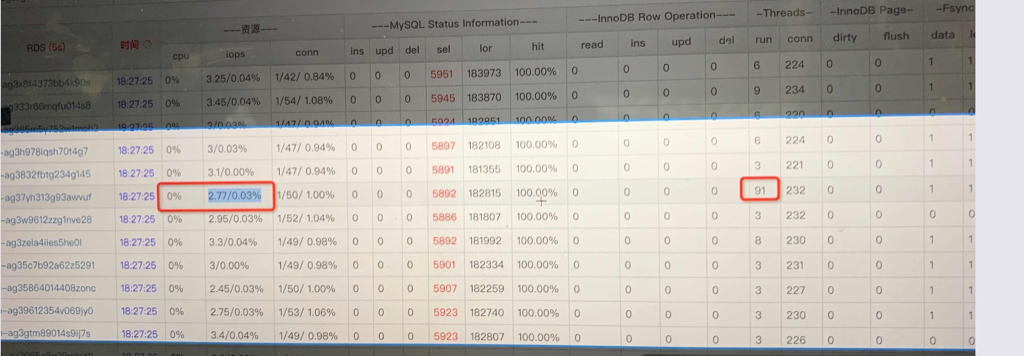
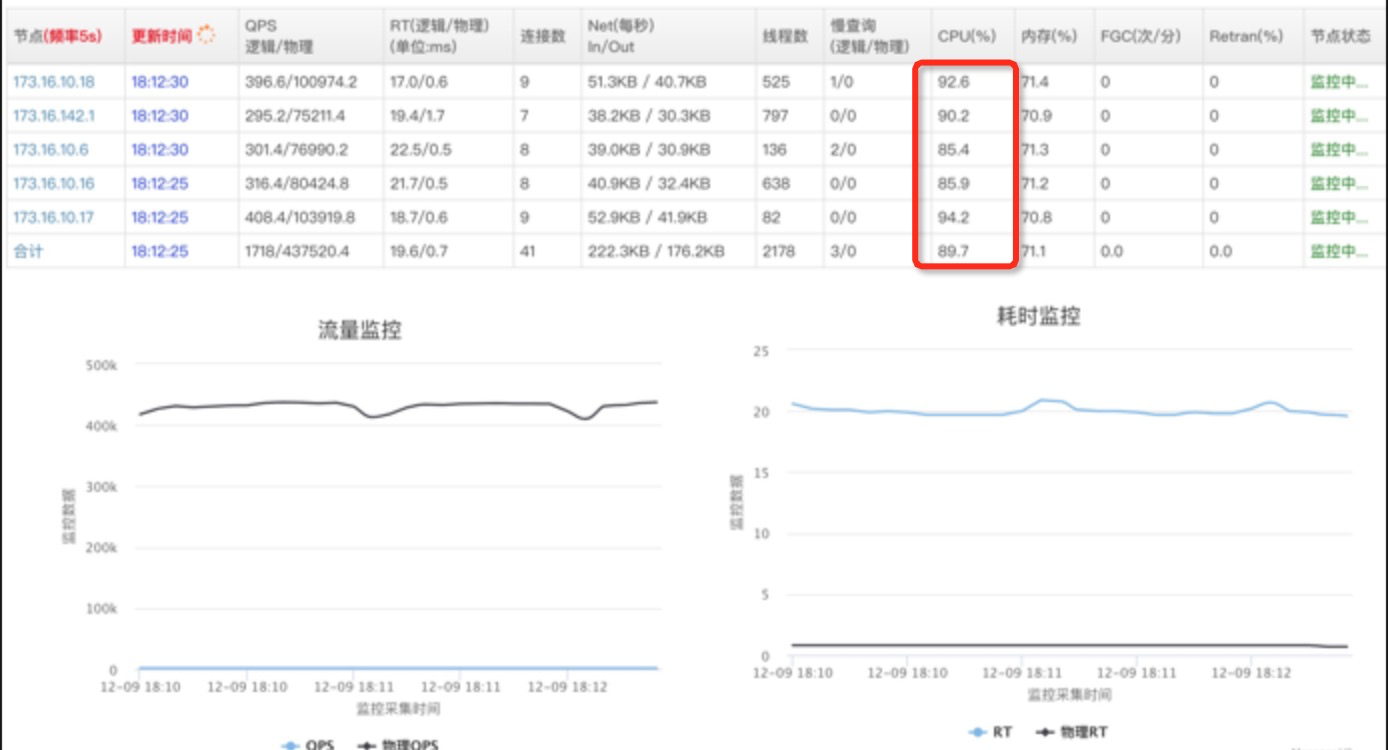
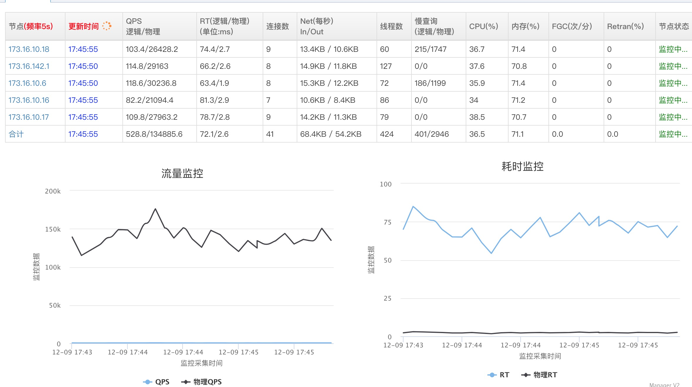
现场DBA通过监控看到MySQL CPU不到20%,没有慢查询,并且尝试用client越过所有中间环节直接压其中一个MySQL,可以将 MySQL CPU 跑满,这时的QPS大概是38000(对应上面的场景client QPS为700的时候,单个MySQL上的QPS才跑到6000) 所以排除了MySQL的嫌疑(这个推理不够严谨为后面排查埋下了大坑)。
多线程竞争锁的时候,加锁失败的线程会“忙等待”,直到它拿到锁。什么叫“忙等待”呢?它并不意味着一直执行 CAS 函数,而是会与 CPU 紧密配合 ,它通过 CPU 提供的 PAUSE 指令,减少循环等待时的cache ping-pong和耗电量;对于单核 CPU,忙等待并没有意义,此时它会主动把线程休眠。
X86 PAUSE 指令
X86设计了Pause指令,也就是调用 Pause 指令的代码会抢着 CPU 不释放,但是CPU 会打个盹,比如 10个时钟周期,相对一次上下文切换是大几千个时钟周期。
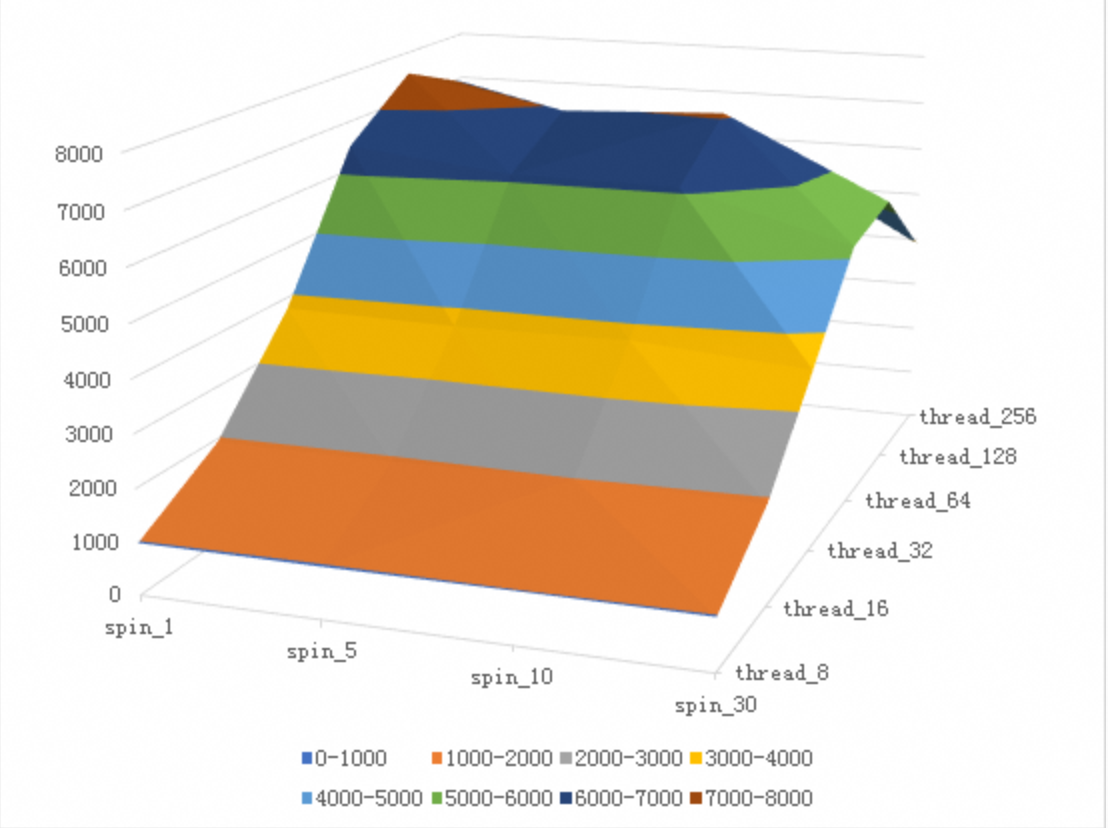
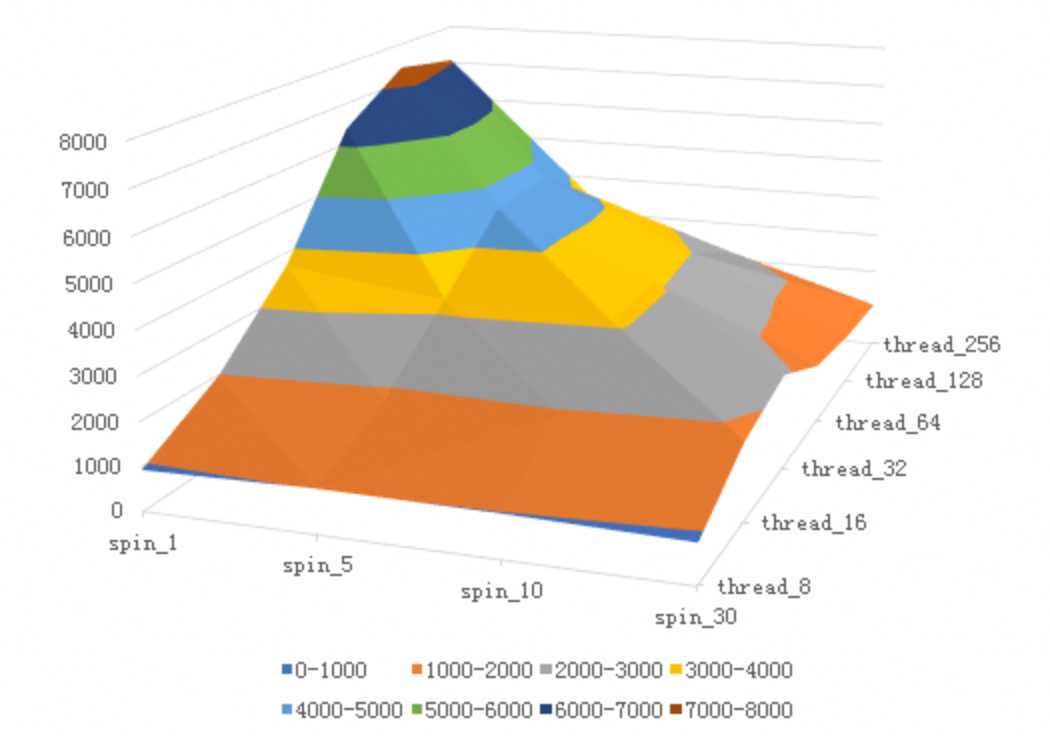
这样应用一旦自旋抢锁失败可以先 Pause 一下,只是这个Pause 时间对于 MySQL 来说还不够久,所以需要增加参数 innodb_spin_wait_delay 来将休息时间放大一些。
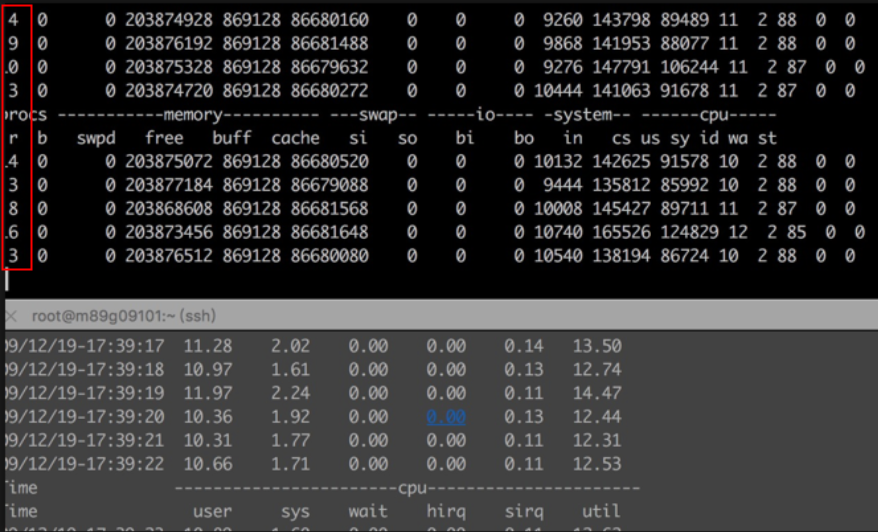
节能(CPU可以休息、但是不让出来),CPU Pause 的时候你从 top 能看到 CPU 100%,但是不耗能。
所以有了 Pause 指令后能够提高超线程的利用率,节能,减少上下文切换提高自旋锁的效率。
The PAUSE instruction is first introduced for Intel Pentium 4 processor to improve the performance of “spin-wait loop”. The PAUSE instruction is typically used with software threads executing on two logical processors located in the same processor core, waiting for a lock to be released. Such short wait loops tend to last between tens and a few hundreds of cycles. When the wait loop is expected to last for thousands of cycles or more, it is preferable to yield to the operating system by calling one of the OS synchronization API functions, such as WaitForSingleObject on Windows OS.
An Intel® processor suffers a severe performance penalty when exiting the loop because it detects a possible memory order violation. The PAUSE instruction provides a hint to the processor that the code sequence is a spin-wait loop. The processor uses this hint to avoid the memory order violation in most situations. The PAUSE instruction can improve the performance of the processors supporting Intel Hyper-Threading Technology when executing “spin-wait loops”. With Pause instruction, processors are able to avoid the memory order violation and pipeline flush, and reduce power consumption through pipeline stall.
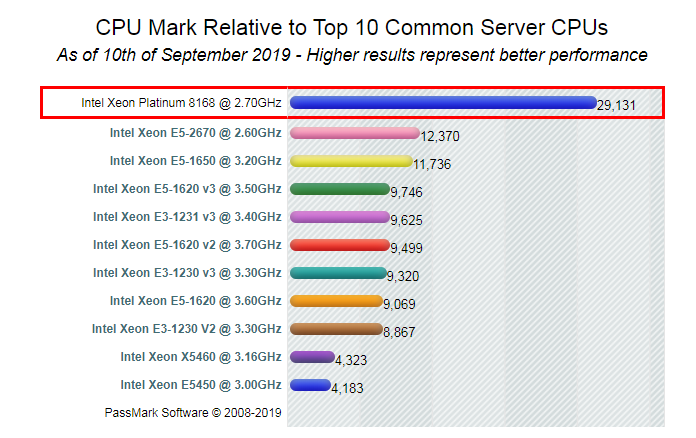
The latency of the PAUSE instruction in prior generation microarchitectures is about 10 cycles, whereas in Skylake microarchitecture it has been extended to as many as 140 cycles.
The PAUSE instruction can improves the performance of processors supporting Intel Hyper-Threading Technology when executing “spin-wait loops” and other routines where one thread is accessing a shared lock or semaphore in a tight polling loop. When executing a spin-wait loop, the processor can suffer a severe performance penalty when exiting the loop because it detects a possible memory order violation and flushes the core processor’s pipeline. The PAUSE instruction provides a hint to the processor that the code sequence is a spin-wait loop. The processor uses this hint to avoid the memory order violation and prevent the pipeline flush. In addition, the PAUSE instruction de- pipelines the spin-wait loop to prevent it from consuming execution resources excessively and consume power needlessly. (See Section 8.10.6.1, “Use the PAUSE Instruction in Spin-Wait Loops,” for more information about using the PAUSE instruction with IA-32 processors supporting Intel Hyper-Threading Technology.)
现场DBA通过监控看到MySQL CPU不到20%,没有慢查询,并且尝试用client越过所有中间环节直接压其中一个MySQL,可以将 MySQL CPU 跑满,这时的QPS大概是38000(对应上面的场景client QPS为700的时候,单个MySQL上的QPS才跑到6000) 所以排除了MySQL的嫌疑(这个推理不够严谨为后面排查埋下了大坑)。
多线程竞争锁的时候,加锁失败的线程会“忙等待”,直到它拿到锁。什么叫“忙等待”呢?它并不意味着一直执行 CAS 函数,而是会与 CPU 紧密配合 ,它通过 CPU 提供的 PAUSE 指令,减少循环等待时的cache ping-pong和耗电量;对于单核 CPU,忙等待并没有意义,此时它会主动把线程休眠。
X86 PAUSE 指令
X86设计了Pause指令,也就是调用 Pause 指令的代码会抢着 CPU 不释放,但是CPU 会打个盹,比如 10个时钟周期,相对一次上下文切换是大几千个时钟周期。
这样应用一旦自旋抢锁失败可以先 Pause 一下,只是这个Pause 时间对于 MySQL 来说还不够久,所以需要增加参数 innodb_spin_wait_delay 来将休息时间放大一些。
节能(CPU可以休息、但是不让出来),CPU Pause 的时候你从 top 能看到 CPU 100%,但是不耗能。
所以有了 Pause 指令后能够提高超线程的利用率,节能,减少上下文切换提高自旋锁的效率。
The PAUSE instruction is first introduced for Intel Pentium 4 processor to improve the performance of “spin-wait loop”. The PAUSE instruction is typically used with software threads executing on two logical processors located in the same processor core, waiting for a lock to be released. Such short wait loops tend to last between tens and a few hundreds of cycles. When the wait loop is expected to last for thousands of cycles or more, it is preferable to yield to the operating system by calling one of the OS synchronization API functions, such as WaitForSingleObject on Windows OS.
An Intel® processor suffers a severe performance penalty when exiting the loop because it detects a possible memory order violation. The PAUSE instruction provides a hint to the processor that the code sequence is a spin-wait loop. The processor uses this hint to avoid the memory order violation in most situations. The PAUSE instruction can improve the performance of the processors supporting Intel Hyper-Threading Technology when executing “spin-wait loops”. With Pause instruction, processors are able to avoid the memory order violation and pipeline flush, and reduce power consumption through pipeline stall.
The latency of the PAUSE instruction in prior generation microarchitectures is about 10 cycles, whereas in Skylake microarchitecture it has been extended to as many as 140 cycles.
The PAUSE instruction can improves the performance of processors supporting Intel Hyper-Threading Technology when executing “spin-wait loops” and other routines where one thread is accessing a shared lock or semaphore in a tight polling loop. When executing a spin-wait loop, the processor can suffer a severe performance penalty when exiting the loop because it detects a possible memory order violation and flushes the core processor’s pipeline. The PAUSE instruction provides a hint to the processor that the code sequence is a spin-wait loop. The processor uses this hint to avoid the memory order violation and prevent the pipeline flush. In addition, the PAUSE instruction de- pipelines the spin-wait loop to prevent it from consuming execution resources excessively and consume power needlessly. (See Section 8.10.6.1, “Use the PAUSE Instruction in Spin-Wait Loops,” for more information about using the PAUSE instruction with IA-32 processors supporting Intel Hyper-Threading Technology.)
On arm64 we have seen on several databases that ISB (instruction synchronization barrier) is better to use than yield in a spin loop. The yield instruction is a nop. The isb instruction puts the processor to sleep for some short time. isb is a good equivalent to the pause instruction on x86.
Below is an experiment that shows the effects of yield and isb on Arm64 and the time of a pause instruction on x86 Intel processors. The micro-benchmarks use https://github.com/google/benchmark.git
测试代码
1 2 3 4 5 6 7 8 9 10 11 12 13 14 15 16 17 18
$ cat a.cc
static void BM_scalar_increment(benchmark::State& state) {
  int i = 0;
  for (auto _ : state)
    benchmark::DoNotOptimize(i++);
}
BENCHMARK(BM_scalar_increment);
static void BM_yield(benchmark::State& state) {
  for (auto _ : state)
    asm volatile("yield"::);
}
BENCHMARK(BM_yield);
static void BM_isb(benchmark::State& state) {
  for (auto _ : state)
    asm volatile("isb"::);
}
BENCHMARK(BM_isb);
BENCHMARK_MAIN();