include /etc/nginx/mime.types; default_type application/octet-stream;
# Load modular configuration files from the /etc/nginx/conf.d directory. # See http://nginx.org/en/docs/ngx_core_module.html#include # for more information. include /etc/nginx/conf.d/*.conf;
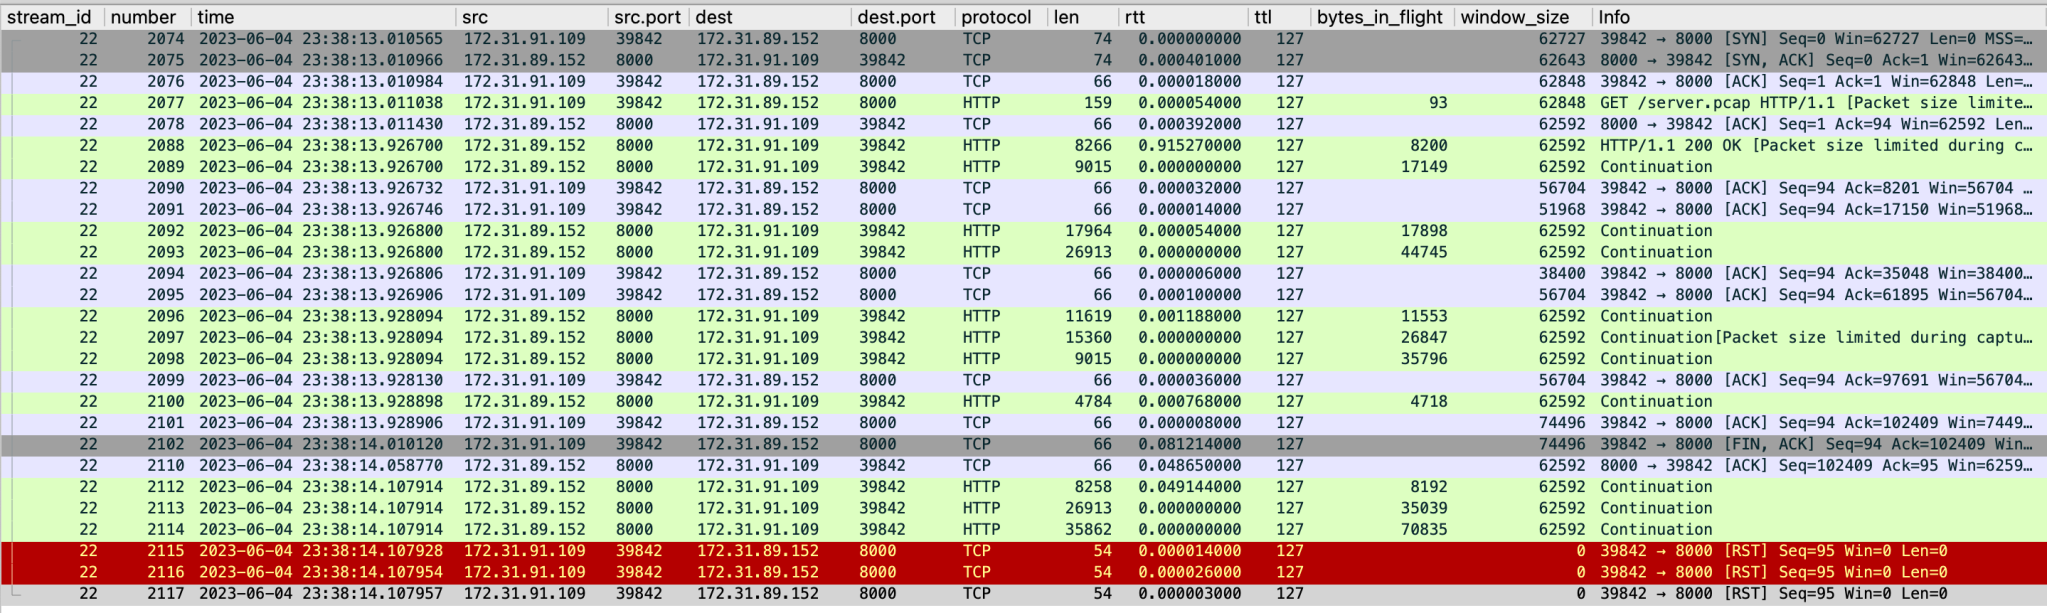
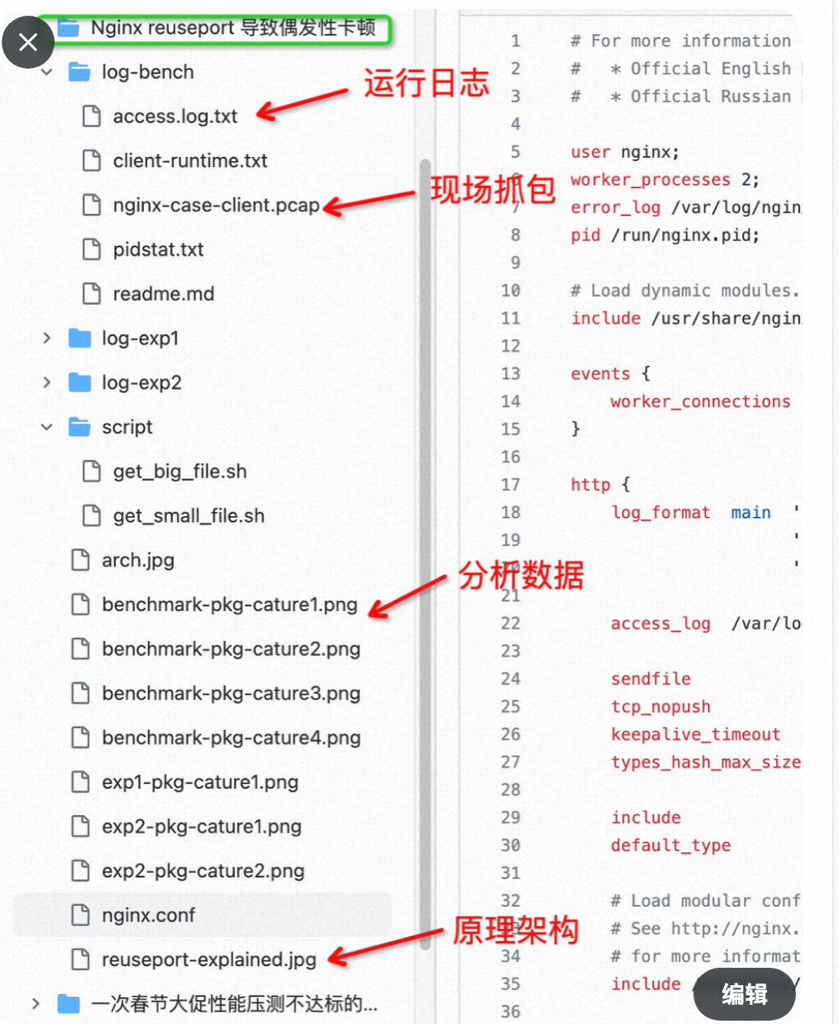
server { listen 8000 reuseport; server_name server1; root /usr/share/nginx/html;
# Load configuration files for the default server block. include /etc/nginx/default.d/*.conf; location / { proxy_pass http://172.31.86.252:8000; # server ip proxy_set_header Host $host; proxy_set_header X-Real-IP $remote_addr; }
To clarify, the thread_pool_oversubscribe system variable does not play any part in the creation of new worker threads. The thread_pool_oversubscribe system variable is only used to determine how many worker threads should remain active in a thread group, once a thread group is already oversubscribed due to stalls.
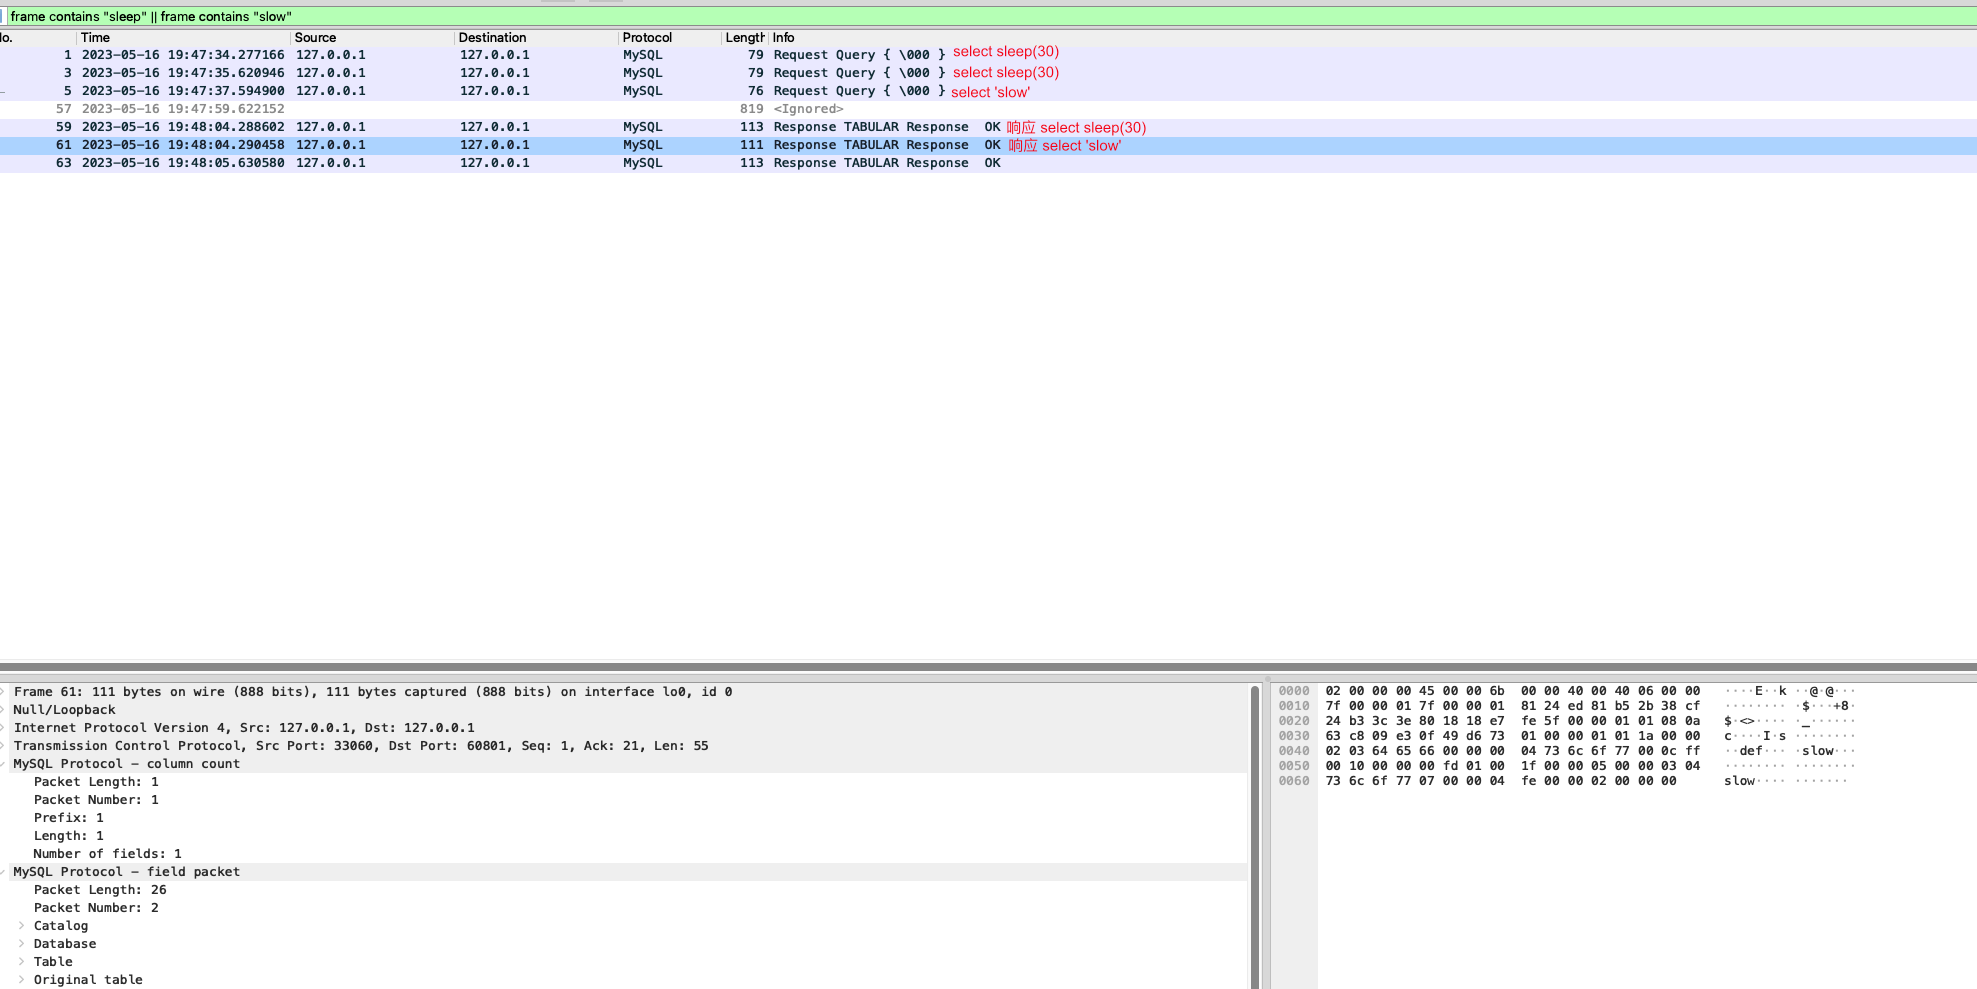
2023-05-16T11:27:09.997916Z 406 [ERROR] [MY-000000] [Server] Threadpool could not create additional thread to handle queries, because the number of allowed threads was reached. Increasing ‘thread_pool_max_threads’ parameter can help in this situation. If ‘admin_port’ parameter is set, you can still connect to the database with superuser account (it must be TCP connection using admin_port as TCP port) and troubleshoot the situation. A likely cause of pool blocks are clients that lock resources for long time. ‘show processlist’ or ‘show engine innodb status’ can give additional hints.
#perf stat -e branch-misses,bus-cycles,cache-misses,cache-references,cpu-cycles,instructions,stalled-cycles-backend,stalled-cycles-frontend,alignment-faults,bpf-output,context-switches,cpu-clock,cpu-migrations,dummy,emulation-faults,major-faults,minor-faults,page-faults,task-clock,L1-dcache-load-misses,L1-dcache-loads,L1-dcache-store-misses,L1-dcache-stores,L1-icache-load-misses,L1-icache-loads,branch-load-misses,branch-loads,dTLB-load-misses,dTLB-loads,iTLB-load-misses,iTLB-loads ./aftersort 11.44 sum = 314931600000
#perf stat -e branch-misses,bus-cycles,cache-misses,cache-references,cpu-cycles,instructions,stalled-cycles-backend,stalled-cycles-frontend,alignment-faults,bpf-output,context-switches,cpu-clock,cpu-migrations,dummy,emulation-faults,major-faults,minor-faults,page-faults,task-clock,L1-dcache-load-misses,L1-dcache-loads,L1-icache-load-misses,L1-icache-loads,LLC-load-misses,LLC-loads,branch-load-misses,branch-loads,dTLB-load-misses,dTLB-loads,iTLB-load-misses,iTLB-loads ./aftersort 8.20237 sum = 314931600000
#perf stat -e branch-misses,bus-cycles,cache-misses,cache-references,cpu-cycles,instructions,stalled-cycles-backend,stalled-cycles-frontend,alignment-faults,bpf-output,context-switches,cpu-clock,cpu-migrations,dummy,emulation-faults,major-faults,minor-faults,page-faults,task-clock,L1-dcache-load-misses,L1-dcache-loads,L1-icache-load-misses,L1-icache-loads,LLC-load-misses,LLC-loads,branch-load-misses,branch-loads,dTLB-load-misses,dTLB-loads,iTLB-load-misses,iTLB-loads ./beforesort 16.8872 sum = 314931600000
#perf stat -e branch-misses,bus-cycles,cache-misses,cache-references,cpu-cycles,instructions,alignment-faults,context-switches,cpu-clock,cpu-migrations,dummy,emulation-faults,major-faults,minor-faults,page-faults,task-clock,L1-dcache-load-misses,L1-dcache-loads,L1-dcache-store-misses,L1-dcache-stores,L1-icache-load-misses,L1-icache-loads,branch-load-misses,branch-loads,dTLB-load-misses,iTLB-load-misses ./aftersort 16.63 sum = 314931600000
#perf stat -e branch-misses,bus-cycles,cache-misses,cache-references,cpu-cycles,instructions,alignment-faults,context-switches,cpu-clock,cpu-migrations,dummy,emulation-faults,major-faults,minor-faults,page-faults,task-clock,L1-dcache-load-misses,L1-dcache-loads,L1-dcache-store-misses,L1-dcache-stores,L1-icache-load-misses,L1-icache-loads,branch-load-misses,branch-loads,dTLB-load-misses,iTLB-load-misses ./beforesort 39.8 sum = 314931600000
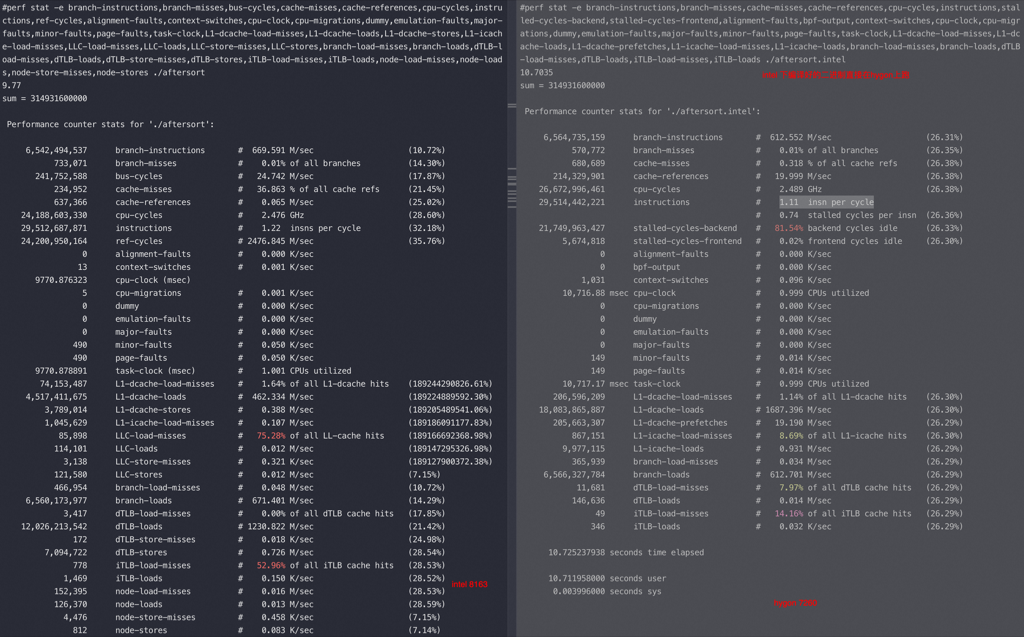
#perf stat -e branch-instructions,branch-misses,bus-cycles,cache-misses,cache-references,cpu-cycles,instructions,ref-cycles,alignment-faults,context-switches,cpu-clock,cpu-migrations,dummy,emulation-faults,major-faults,minor-faults,page-faults,task-clock,L1-dcache-load-misses,L1-dcache-loads,L1-dcache-stores,L1-icache-load-misses,LLC-load-misses,LLC-loads,LLC-store-misses,LLC-stores,branch-load-misses,branch-loads,dTLB-load-misses,dTLB-loads,dTLB-store-misses,dTLB-stores,iTLB-load-misses,iTLB-loads,node-load-misses,node-loads,node-store-misses,node-stores ./aftersort 9.77 sum = 314931600000
排序后去掉了 branch miss 差异,M710 比 intel 快了 10%,只要是因为主频的差异
on 8269 3.2GHz
1 2 3 4 5 6 7 8 9 10 11 12 13 14
#perf stat -e branch-instructions,branch-misses,cpu-cycles,instructions,branch-load-misses,branch-loads,task-clock,cpu-clock ./beforesort 22.96 sum = 314931600000
#perf stat -e branch-instructions,branch-misses,bus-cycles,cache-misses,cache-references,cpu-cycles,instructions,ref-cycles,alignment-faults,context-switches,cpu-clock,cpu-migrations,dummy,emulation-faults,major-faults,minor-faults,page-faults,task-clock,L1-dcache-load-misses,L1-dcache-loads,L1-dcache-stores,L1-icache-load-misses,LLC-load-misses,LLC-loads,LLC-store-misses,LLC-stores,branch-load-misses,branch-loads,dTLB-load-misses,dTLB-loads,dTLB-store-misses,dTLB-stores,iTLB-load-misses,iTLB-loads,node-load-misses,node-loads,node-store-misses,node-stores ./beforesort 2.94 sum = 314931600000
#perf stat -e branch-misses,bus-cycles,cache-misses,cache-references,cpu-cycles,instructions,stalled-cycles-backend,stalled-cycles-frontend,alignment-faults,bpf-output,context-switches,cpu-clock,cpu-migrations,dummy,emulation-faults,major-faults,minor-faults,page-faults,task-clock,L1-dcache-load-misses,L1-dcache-loads,L1-icache-load-misses,L1-icache-loads,LLC-load-misses,LLC-loads,branch-load-misses,branch-loads,dTLB-load-misses,dTLB-loads,iTLB-load-misses,iTLB-loads ./beforesort 1.19468 sum = 314931600000
#perf stat -e branch-misses,bus-cycles,cache-misses,cache-references,cpu-cycles,instructions,stalled-cycles-backend,stalled-cycles-frontend,alignment-faults,bpf-output,context-switches,cpu-clock,cpu-migrations,dummy,emulation-faults,major-faults,minor-faults,page-faults,task-clock,L1-dcache-load-misses,L1-dcache-loads,L1-icache-load-misses,L1-icache-loads,LLC-load-misses,LLC-loads,branch-load-misses,branch-loads,dTLB-load-misses,dTLB-loads,iTLB-load-misses,iTLB-loads ./aftersort 1.1949 sum = 314931600000
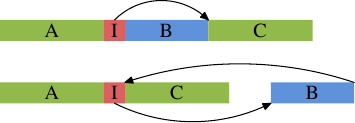
如上图的上面部分代表通常情况下的简单代码布局。如果区域 B(这里是内联函数 inlfct 生成的代码)经常由于条件 I 被跳过,而不会执行,处理器的预取将拉入很少使用的包含块 B 的高速缓存行。使用块重新排序可以改变这种局面,改变之后的效果可以在图的下半部分看到。经常执行的代码在内存中是线性的,而很少执行的代码被移动到不会损害预取和 L1i 效率的位置。
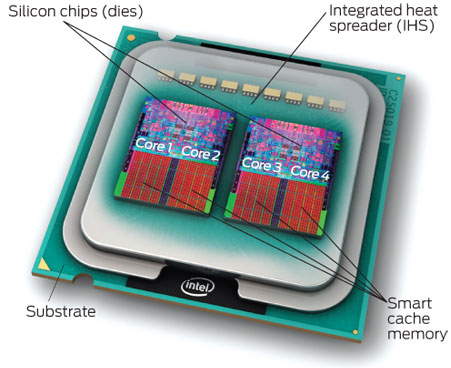
举个例子,如果一个线程运行过程中,必须要等到一些数据加载到缓存中以后才能继续执行,此时 CPU 就可以切换到另一个线程,去执行其他指令,而不用去处于空闲状态,等待当前线程的数据加载完毕。通常,一个传统的处理器在线程之间切换,可能需要几万个时钟周期。而一个具有 HT 超线程技术的处理器只需要 1 个时钟周期。因此就大大减小了线程之间切换的成本,从而最大限度地让处理器满负荷运转。
ARM芯片基本不做超线程,另外请思考为什么有了应用层的多线程切换还需要CPU层面的超线程?
超线程(Hyper-Threading)物理实现: 在CPU内部增加寄存器等硬件设施,但是ALU、译码器等关键单元还是共享。在一个物理 CPU 核心内部,会有双份的 PC 寄存器、指令寄存器乃至条件码寄存器。超线程的目的,是在一个线程 A 的指令,在流水线里停顿的时候,让另外一个线程去执行指令。因为这个时候,CPU 的译码器和 ALU 就空出来了,那么另外一个线程 B,就可以拿来干自己需要的事情。这个线程 B 可没有对于线程 A 里面指令的关联和依赖。
#程序员的螺丝刀# tc(traffic control) 模拟丢包率、设置时延等等简直太香了。我不知道不会用的程序员是怎么搞的 延时设置: give packets from eth0 a delay of 2ms bash$ tc qdisc add dev eth0 root netem delay 2ms
change the delay to 300ms bash$ tc qdisc change dev eth0 root netem delay 3ms
display eth0 delay setting bash$ tc qdisc show dev eth0
比较不忍看到大多新同事刚一进来被丢到了错误的位置上,新同事还不敢拒绝。第一种是要面对新公司一大坨内部产品和术语,没有人带,这种太不人道;第二种因为错配而要面对新技术领域,大体还是能 Google 到,不过对他们压力太大,这种我一般会带一次,再多也没精力,毕竟跨了团队;几个月下来新同事肯定觉得被 PUA了


![[中国赞]](/images/951413iMgBlog/2018new_zhongguozan_org.png) ,比我厉害1万倍
,比我厉害1万倍