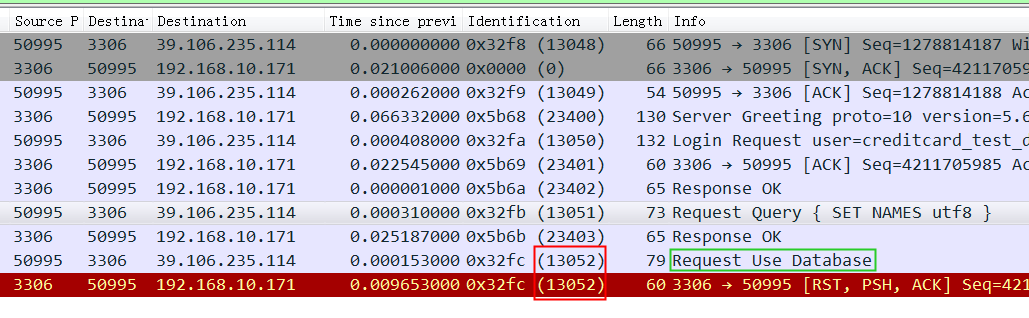
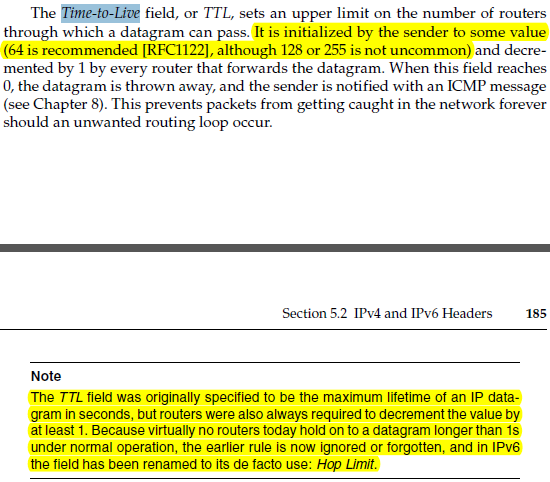
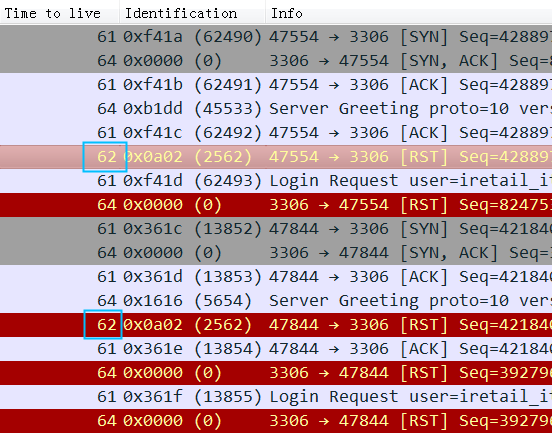
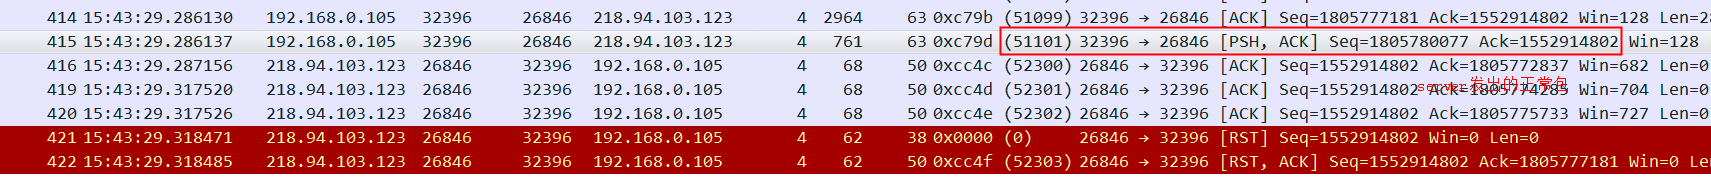
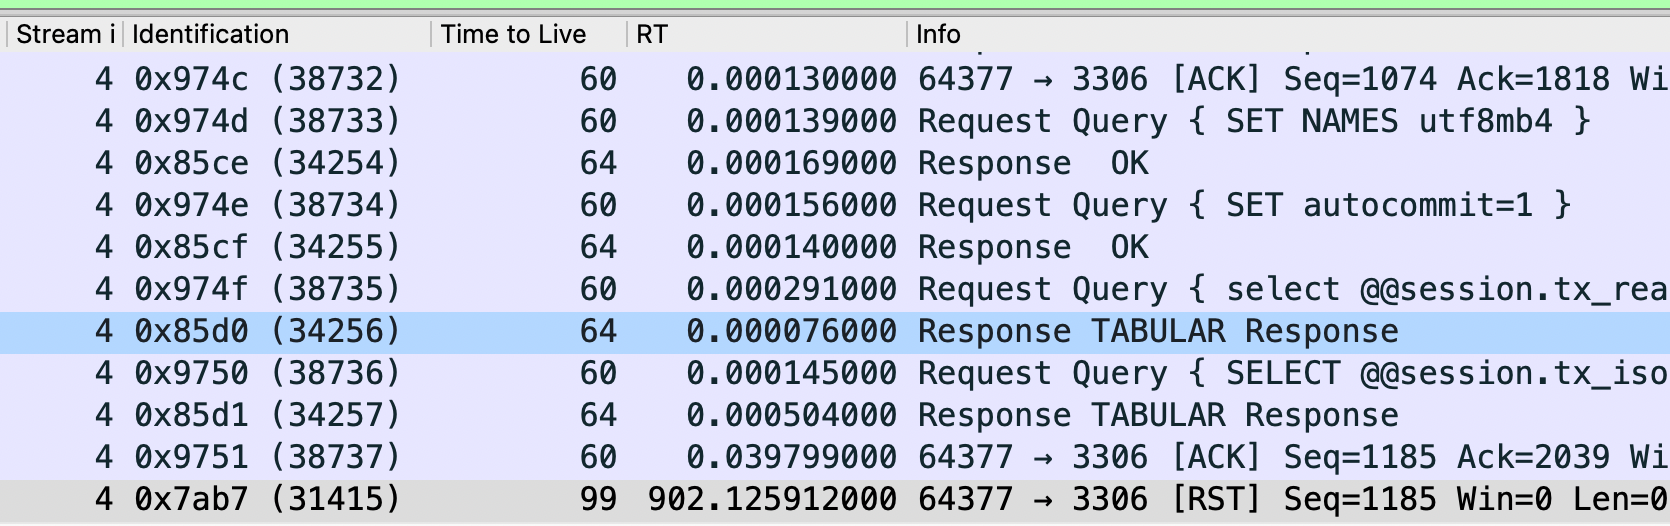
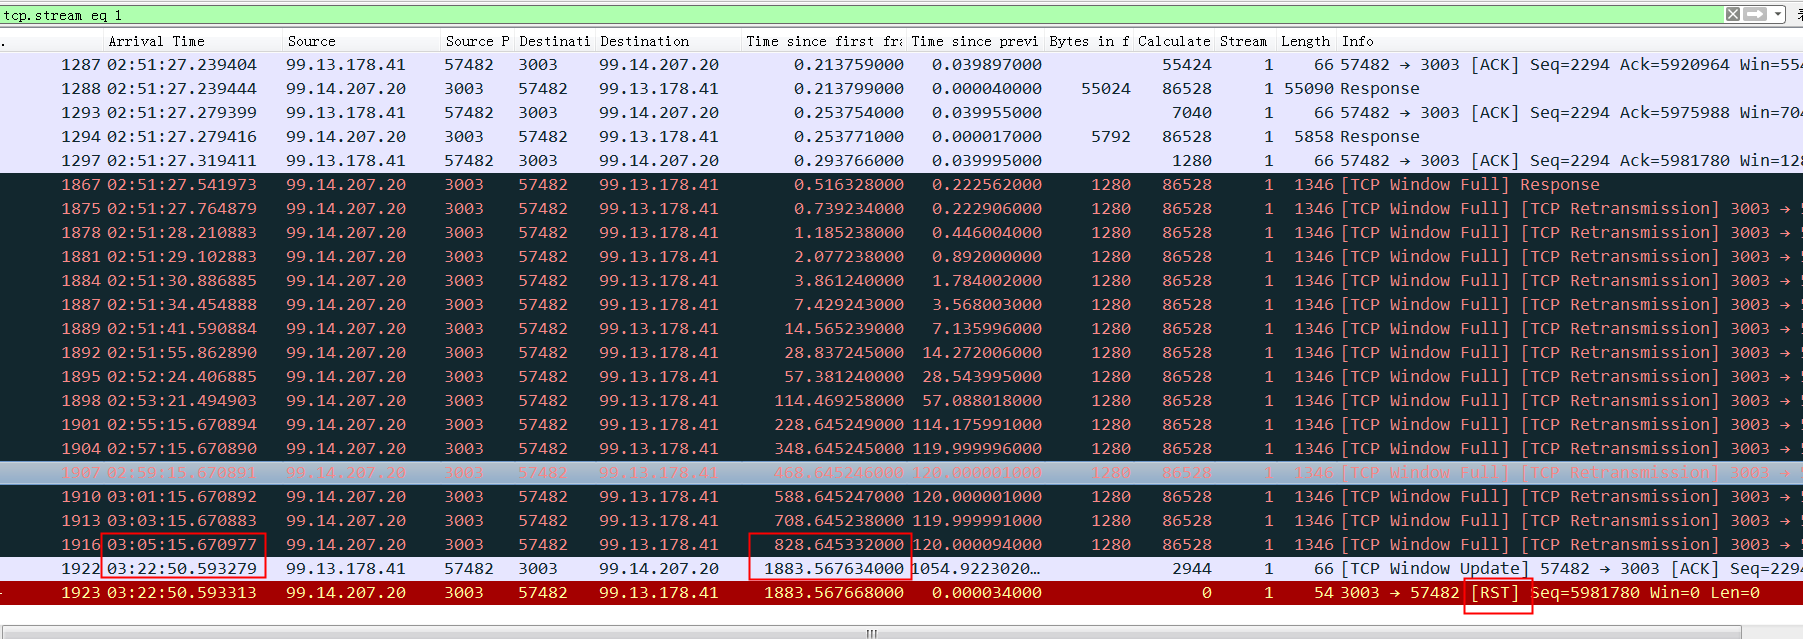
所以如果这个reset是MySQL发出来的话,因为MySQL发出的前一个包的 identification 是23403,所以这个必须是23404,实际上居然是13502(而且还和Navicat发出的 Use Database包是同一个 identification),这是非常不对的。
所以可以大胆猜测,这里有个中间设备收到 Use Database后触发了不放行的逻辑,于是冒充 Navicat给 MySQL Server发了reset包,src ip/src port/seq等都直接用Navicat的,identification也用Navicat的,所以 MySQL Server收到的 Reset看起来很正常(啥都是对的,没留下一点冒充的痕迹)。
[ren@vb 18:14 /home/ren]
$sudo mkdir /media/ren/hd

[ren@vb 18:15 /home/ren]
$sudo mount /dev/sd
sda   sda1  sda2  sda5  sdb   sdb1  sdb2  sdb5  sdc   sdc1  sdc2  sdc5

[ren@vb 18:15 /home/ren]
$sudo mount /dev/sdc1 /media/ren/hd
mount: /dev/sdc1 is write-protected, mounting read-only
mount: wrong fs type, bad option, bad superblock on /dev/sdc1,
       missing codepage or helper program, or other error

       In some cases useful info is found in syslog - try
       dmesg | tail or so.
The new socket option allows multiple sockets on the same host to bind to the same port, and is intended to improve the performance of multithreaded network server applications running on top of multicore systems.
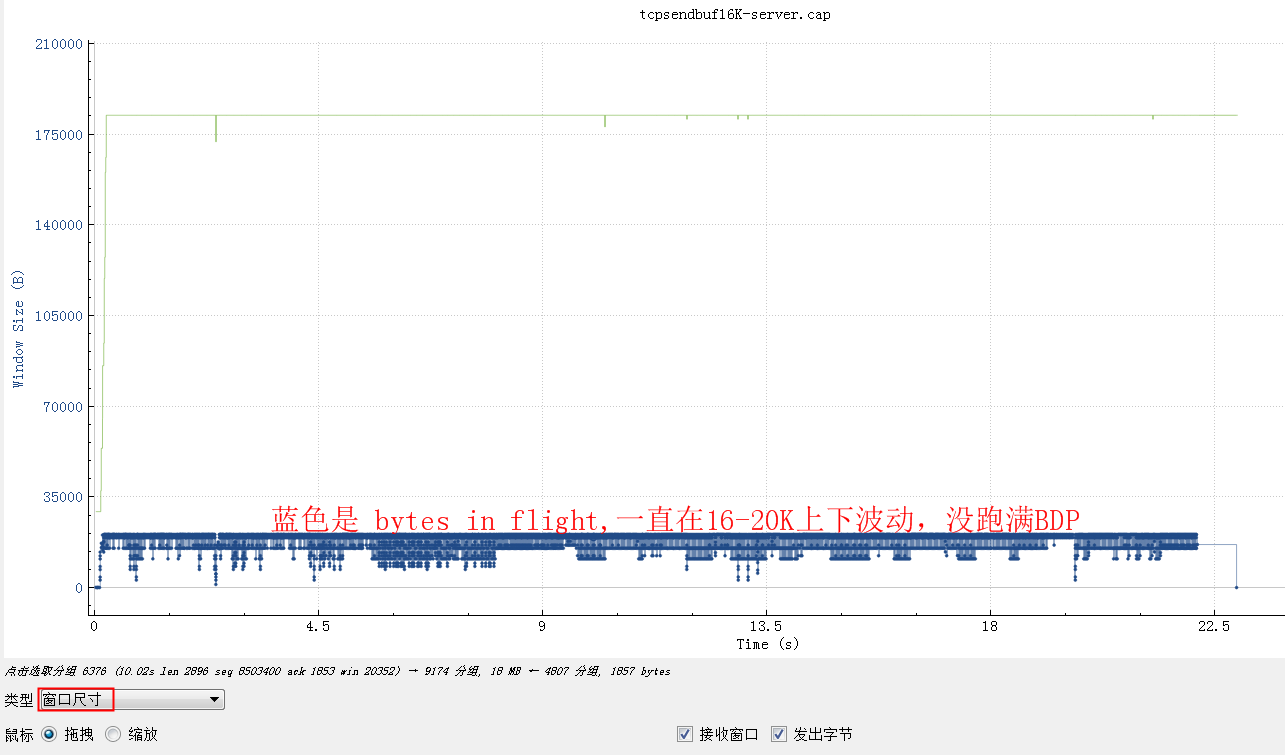
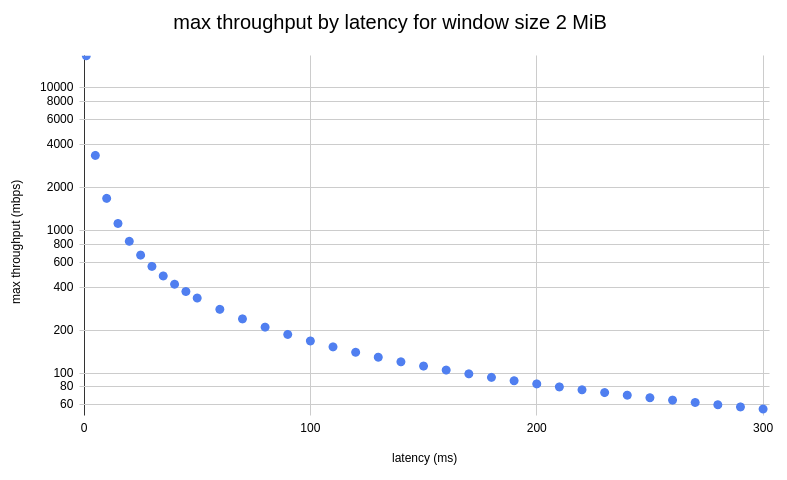
Product of data link’s capacity and its end-to-end delay. The result is the maximum amount of unacknowledged data that can be in flight at any point in time.
ss -itmpn dst "10.81.212.8"
State Recv-Q Send-Q Local Address:Port Peer Address:Port
ESTAB 0 0 10.xx.xx.xxx:22 10.yy.yy.yyy:12345 users:(("sshd",pid=1442,fd=3))
skmem:(r0,rb369280,t0,tb87040,f4096,w0,o0,bl0,d92)
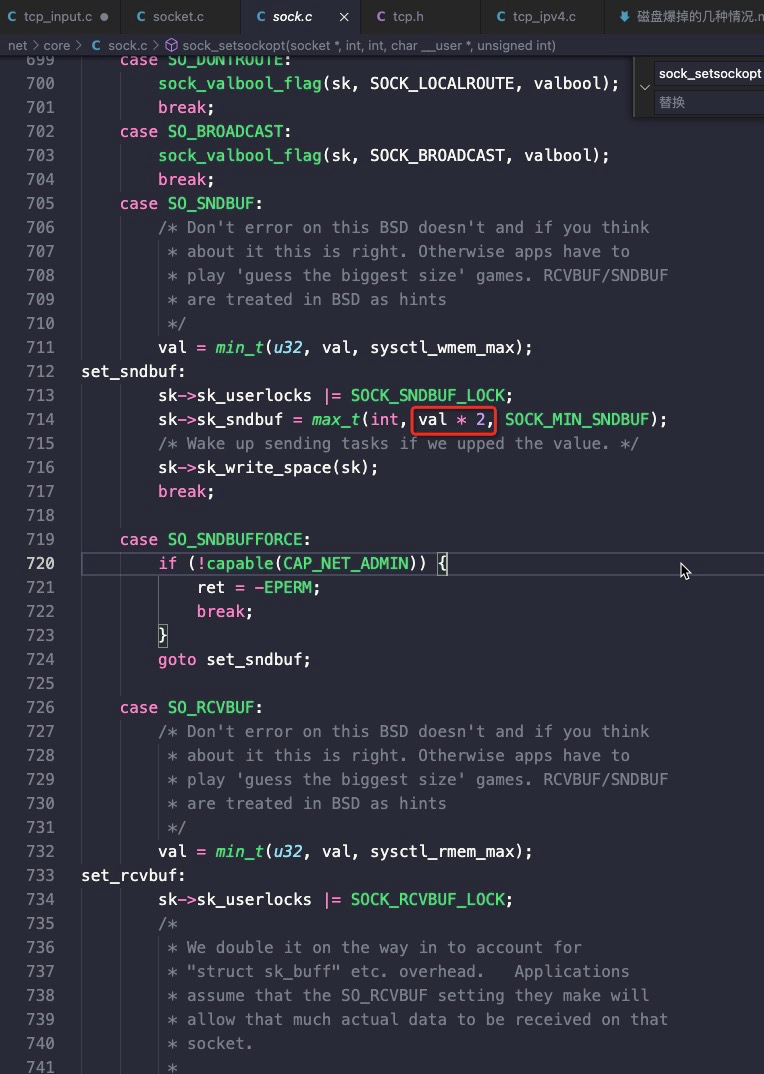
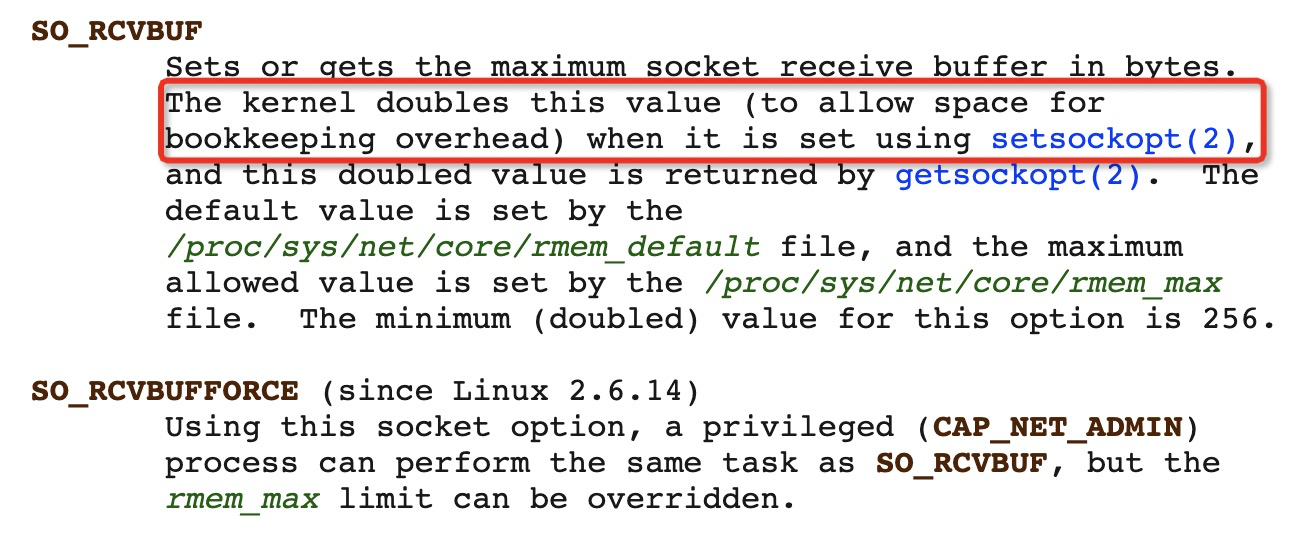
Here we can see this socket has Receive Buffer 369280 bytes, and Transmit Buffer 87040 bytes.Keep in mind the kernel will double any socket buffer allocation for overhead.
So a process asks for 256 KiB buffer with setsockopt(SO_RCVBUF) then it will get 512 KiB buffer space. This is described on man 7 tcp.
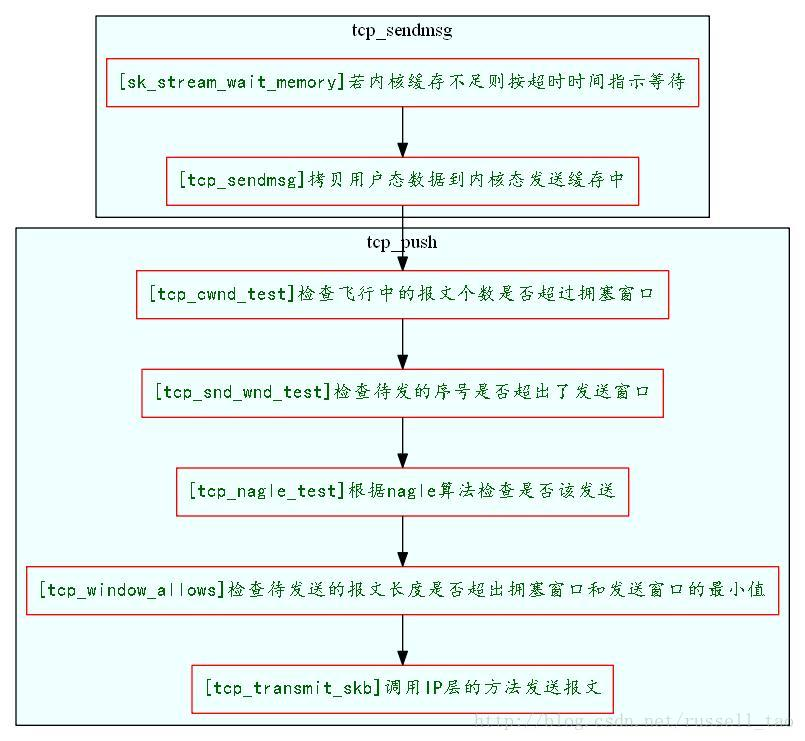
初始窗口计算的代码逻辑,重点在17行:
    /* TCP initial congestion window as per rfc6928 */
    #define TCP_INIT_CWND           10
    /* 3. Try to fixup all. It is made immediately after connection enters

       established state.
             */
            void tcp_init_buffer_space(struct sock *sk)
            {
          int tcp_app_win = sock_net(sk)->ipv4.sysctl_tcp_app_win;
          struct tcp_sock *tp = tcp_sk(sk);
          int maxwin;

        if (!(sk->sk_userlocks & SOCK_SNDBUF_LOCK))
                tcp_sndbuf_expand(sk);

		//初始最大接收窗口计算过程
        tp->rcvq_space.space = min_t(u32, tp->rcv_wnd, TCP_INIT_CWND * tp->advmss);
        tcp_mstamp_refresh(tp);
        tp->rcvq_space.time = tp->tcp_mstamp;
        tp->rcvq_space.seq = tp->copied_seq;

        maxwin = tcp_full_space(sk);

        if (tp->window_clamp >= maxwin) {
                tp->window_clamp = maxwin;

                if (tcp_app_win && maxwin > 4 * tp->advmss)
                        tp->window_clamp = max(maxwin -
                                               (maxwin >> tcp_app_win),
                                               4 * tp->advmss);
        }

        /* Force reservation of one segment. */
        if (tcp_app_win &&
            tp->window_clamp > 2 * tp->advmss &&
            tp->window_clamp + tp->advmss > maxwin)
                tp->window_clamp = max(2 * tp->advmss, maxwin - tp->advmss);

        tp->rcv_ssthresh = min(tp->rcv_ssthresh, tp->window_clamp);
        tp->snd_cwnd_stamp = tcp_jiffies32;
}
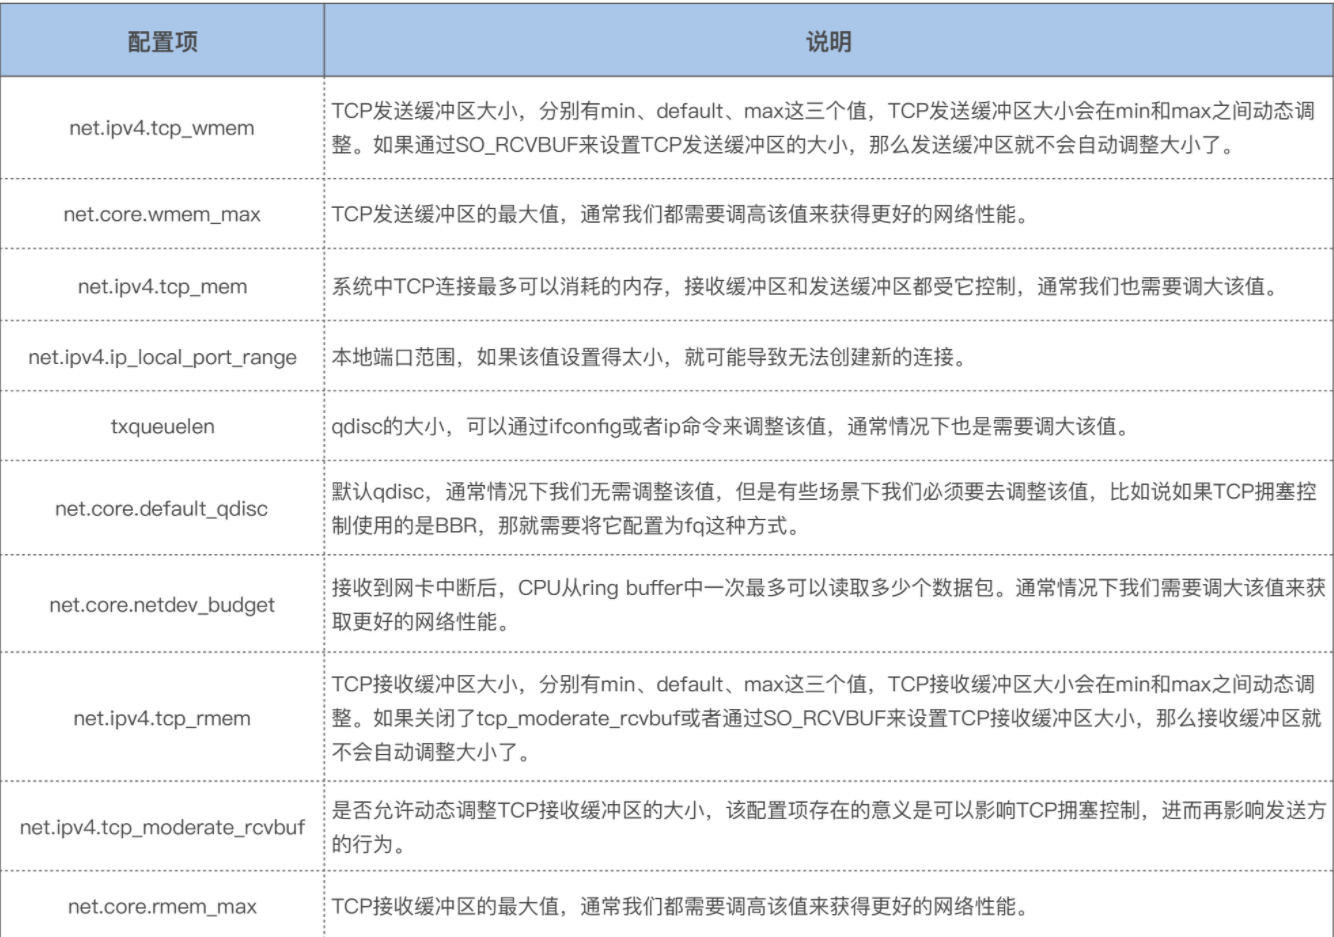
protected int socketRecvBuffer = 32 * 1024;   //接收32K
protected int socketSendBuffer = 64 * 1024;   //发送64K,实际会分配128K

     // If bufs set 0, using '/etc/sysctl.conf' system settings on default
     // refer: net.ipv4.tcp_wmem / net.ipv4.tcp_rmem
     if (socketRecvBuffer > 0) {
         socket.setReceiveBufferSize(socketRecvBuffer);
     }
     if (socketSendBuffer > 0) {
         socket.setSendBufferSize(socketSendBuffer);
     }
 #!/usr/bin/stap
    # Simple probe to detect when a process is waiting for more socket send
    # buffer memory. Usually means the process is doing writes larger than the
    # socket send buffer size or there is a slow receiver at the other side.
    # Increasing the socket's send buffer size might help decrease application
    # latencies, but it might also make it worse, so buyer beware.

probe kernel.function("sk_stream_wait_memory")
{
    printf("%u: %s(%d) blocked on full send buffern",
        gettimeofday_us(), execname(), pid())
}

probe kernel.function("sk_stream_wait_memory").return
{
    printf("%u: %s(%d) recovered from full send buffern",
        gettimeofday_us(), execname(), pid())
}

# Typical output: timestamp in microseconds: procname(pid) event
#
# 1218230114875167: python(17631) blocked on full send buffer
# 1218230114876196: python(17631) recovered from full send buffer
# 1218230114876271: python(17631) blocked on full send buffer
# 1218230114876479: python(17631) recovered from full send buffer
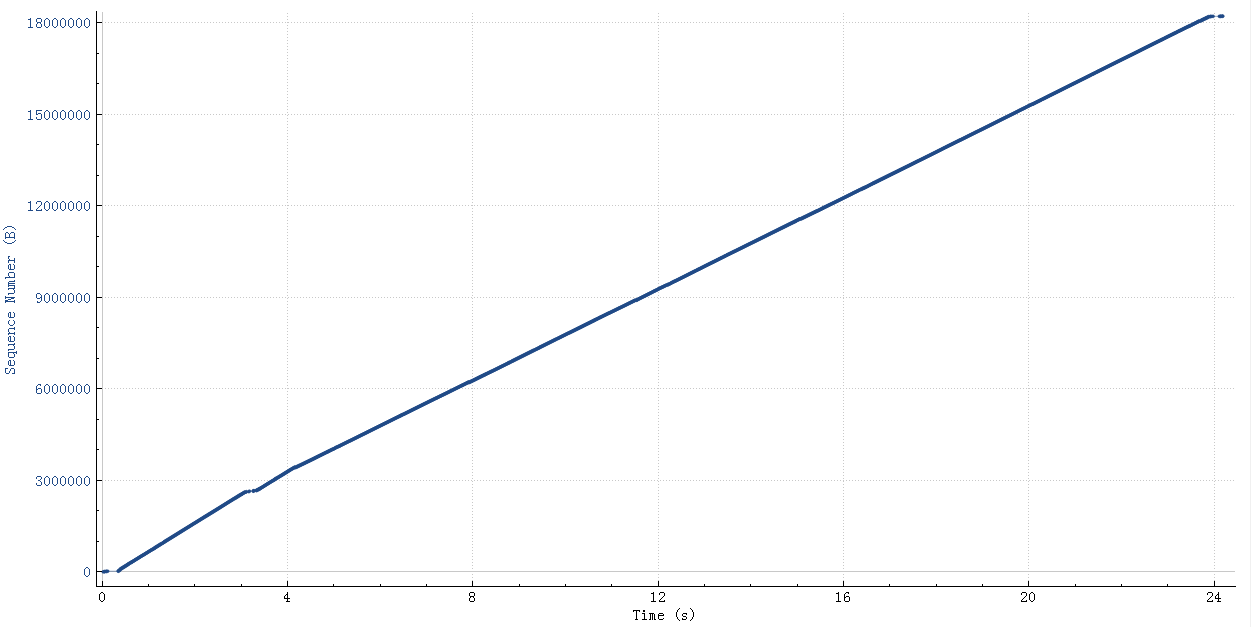
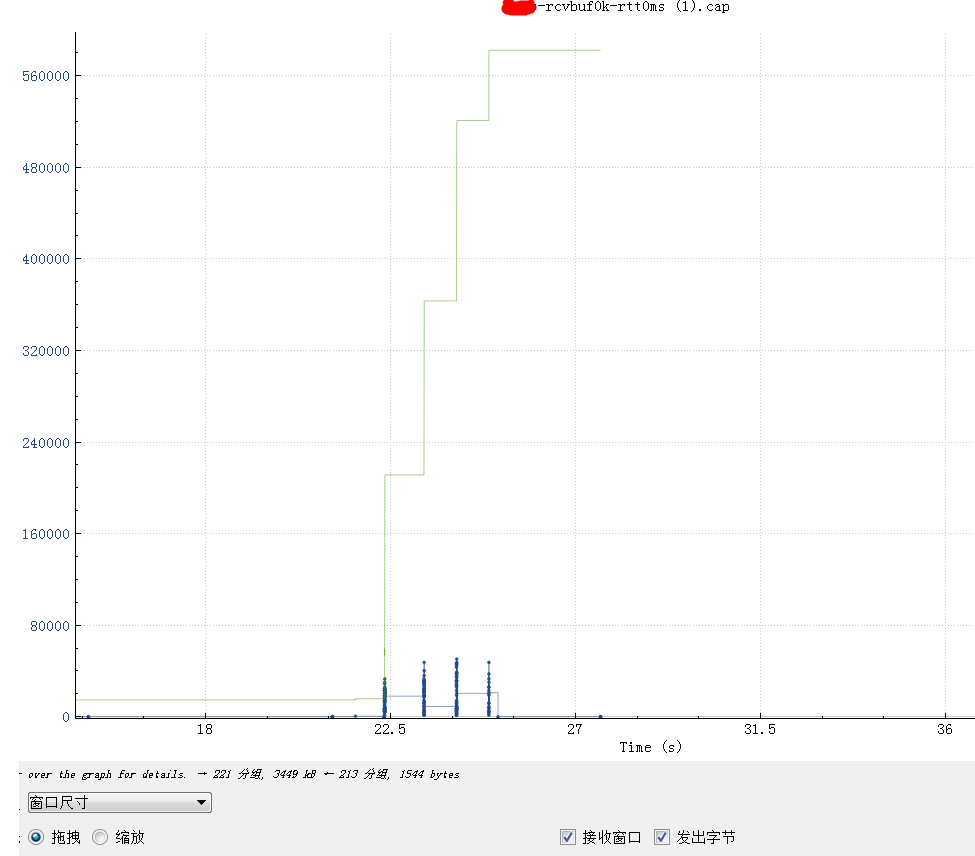
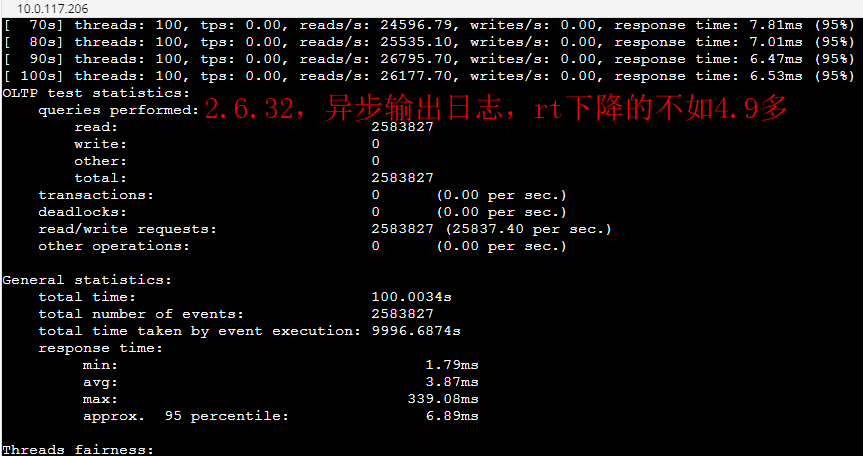
2024 Netflix: Investigation of a Cross-regional Network Performance Issue 因为内核升级去掉了内核参数 sysctl_tcp_adv_win_scale,换了一个新的计算方式,导致原来30秒 内能传输完毕的请求在新内核机制下传输不完,从而导致了业务端的请求超时 This commit obsoleted sysctl_tcp_adv_win_scale and introduced a scaling_ratio that can more accurately calculate the overhead or window size, which is the right thing to do. With the change, the window size is now rcvbuf * scaling_ratio. 简而言之,内核升级后,接收缓存大小减半。因此,吞吐量也减半,导致数据传输时间翻倍。
receive window is not fully opened immediately. Linux keeps the receive window small, as it tries to predict the metadata cost and avoid overshooting the memory budget, therefore hitting TCP collapse. By default, with the net.ipv4.tcp_adv_win_scale=1, the upper limit for the advertised window is 50% of “free” memory. rcv_ssthresh starts up with 64KiB and grows linearly up to that limit.
Using a large chunk of receive buffer space for the metadata is not really what the programmer wants. To counter that, when the socket is under memory pressure complex logic is run with the intention of freeing some space. One of the operations is tcp_collapse and it will merge adjacent TCP packets into one larger sk_buff. This behavior is pretty much a garbage collection (GC)—and as everyone knows, when the garbage collection kicks in, the latency must spike.
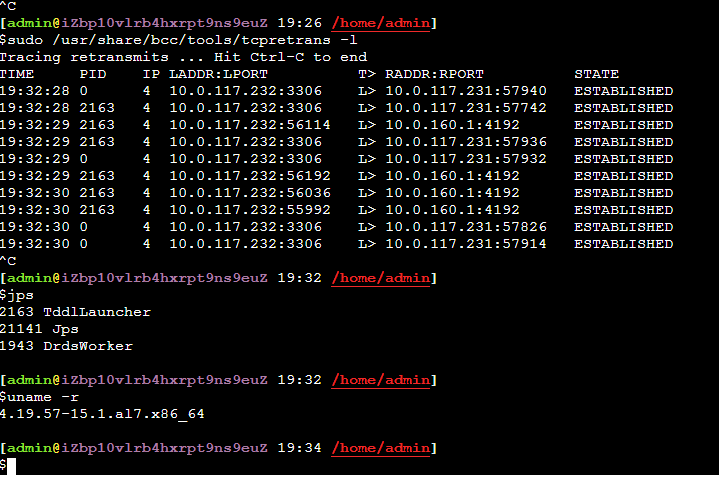
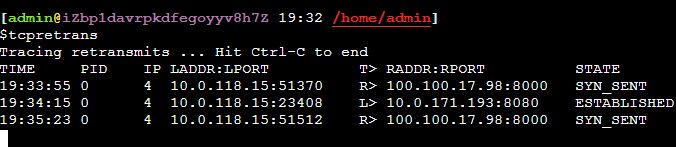
################################################################# # tcp_retransmit.stp # Author: Yang Bingwu (detailyang) <detailyang@gmail.com> # This systemtap script will prints the tcp retransmission packet #################################################################
global record% global cwnd_record%
probe begin { log("Printing tcp retransmission") }
cat tcpsynbl_example.txt
Demonstrations of tcpsynbl, the Linux bpftrace/eBPF version.
This tool shows the TCP SYN backlog size during SYN arrival as a histogram.
This lets you see how close your applications are to hitting the backlog limit
and dropping SYNs (causing performance issues with SYN retransmits). For
example:
# ./tcpsynbl.bt
Attaching 4 probes...
Tracing SYN backlog size. Ctrl-C to end.
^C
@backlog[backlog limit]: histogram of backlog size
@backlog[500]:
[0] 2266 |@@@@@@@@@@@@@@@@@@@@@@@@@@@@@@@@@@@@@@@@@@@@@@@@@@@@|
[1] 3 | |
[2, 4) 1 | |
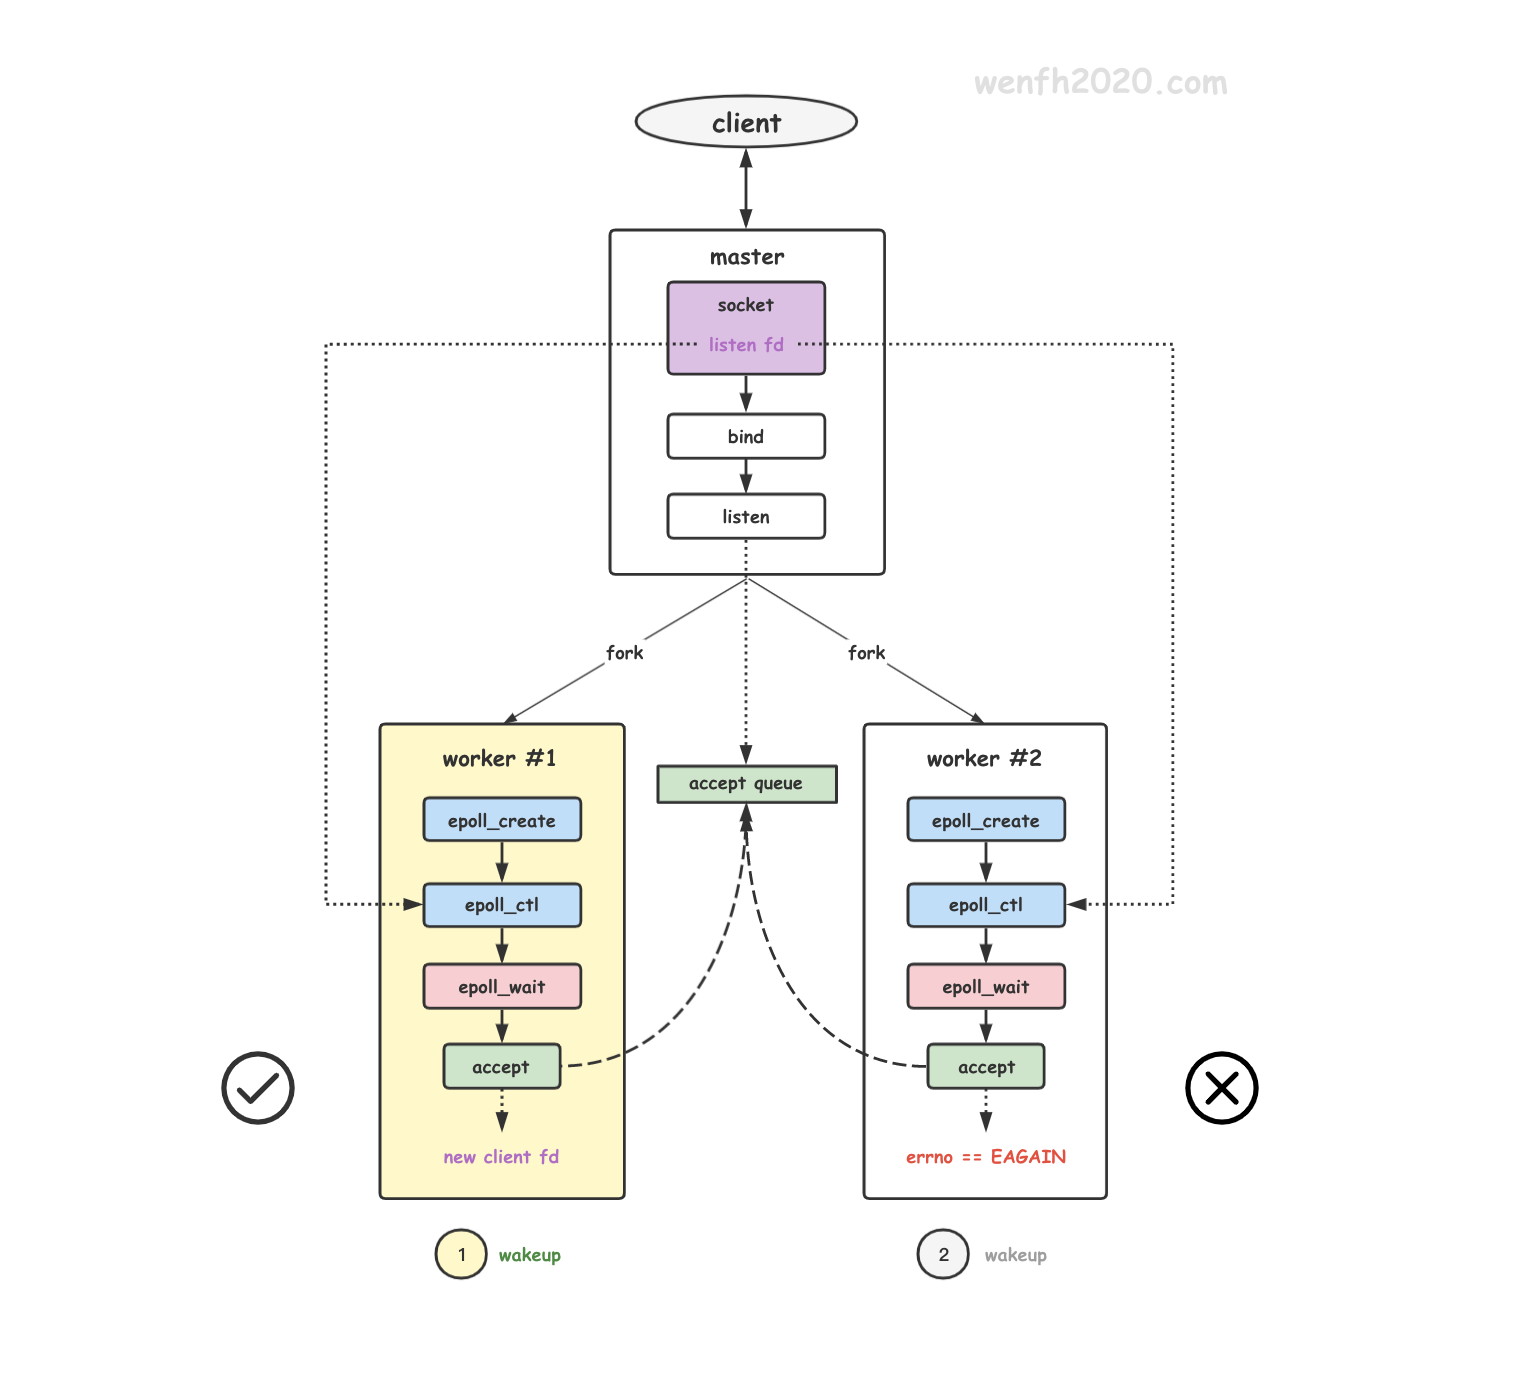
cat tcpaccept_example.txt
Demonstrations of tcpaccept, the Linux bpftrace/eBPF version.
This tool traces the kernel function accepting TCP socket connections (eg, a passive connection via accept(); not connect()). Some example output (IP addresses changed to protect the innocent): # ./tcpaccept Tracing tcp accepts. Hit Ctrl-C to end. TIME PID COMM RADDR RPORT LADDR LPORT BL 00:34:19 3949061 nginx 10.228.22.228 44226 10.229.20.169 8080 0/128 00:34:19 3951399 ruby 127.0.0.1 52422 127.0.0.1 8000 0/128 00:34:19 3949062 nginx 10.228.23.128 35408 10.229.20.169 8080 0/128
This output shows three connections, an IPv4 connections to PID 1463622, a “redis-server” process listening on port 6379, and one IPv6 connection to a “thread.rb” process listening on port 8000. The remote address and port are also printed, and the accept queue current size as well as maximum size are shown. The overhead of this tool should be negligible, since it is only tracing the kernel function performing accept. It is not tracing every packet and then filtering. This tool only traces successful TCP accept()s. Connection attempts to closed ports will not be shown (those can be traced via other functions). There is another version of this tool in bcc: https://github.com/iovisor/bcc
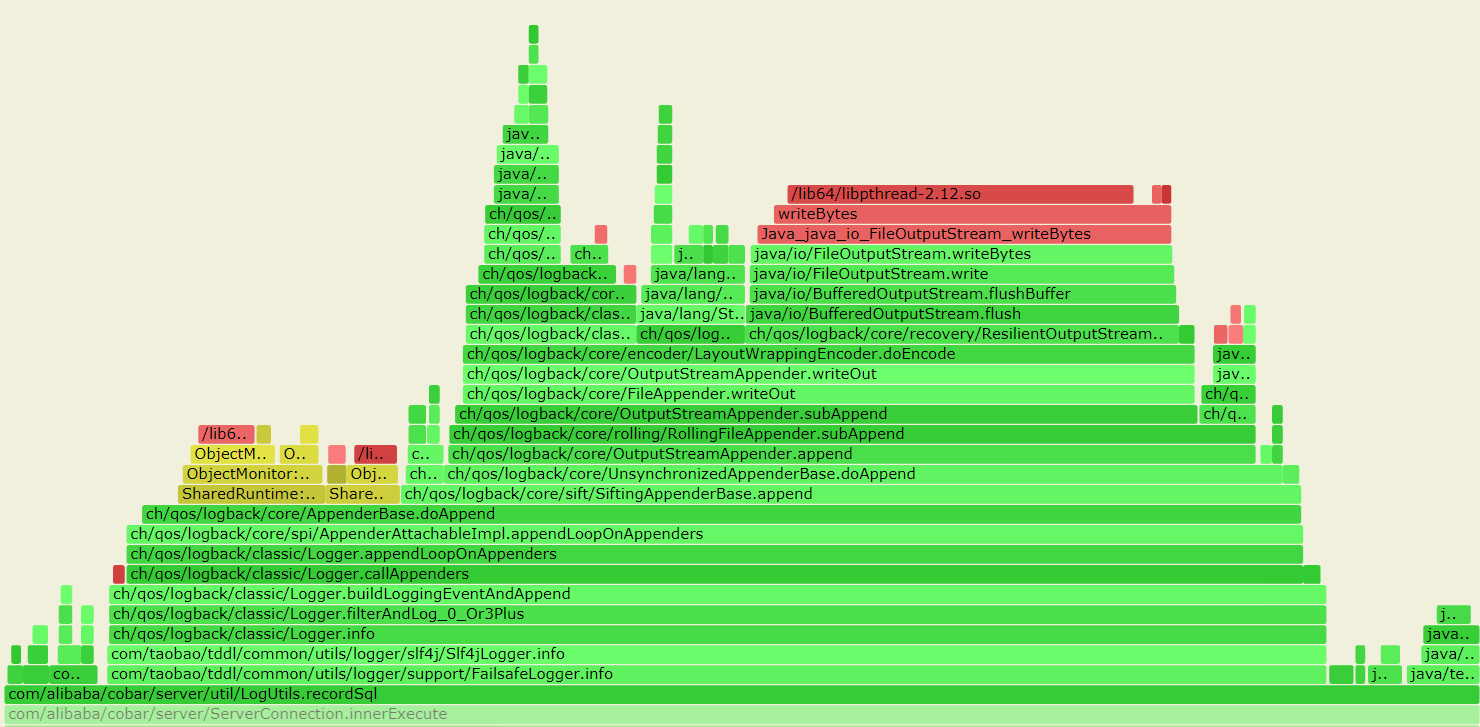
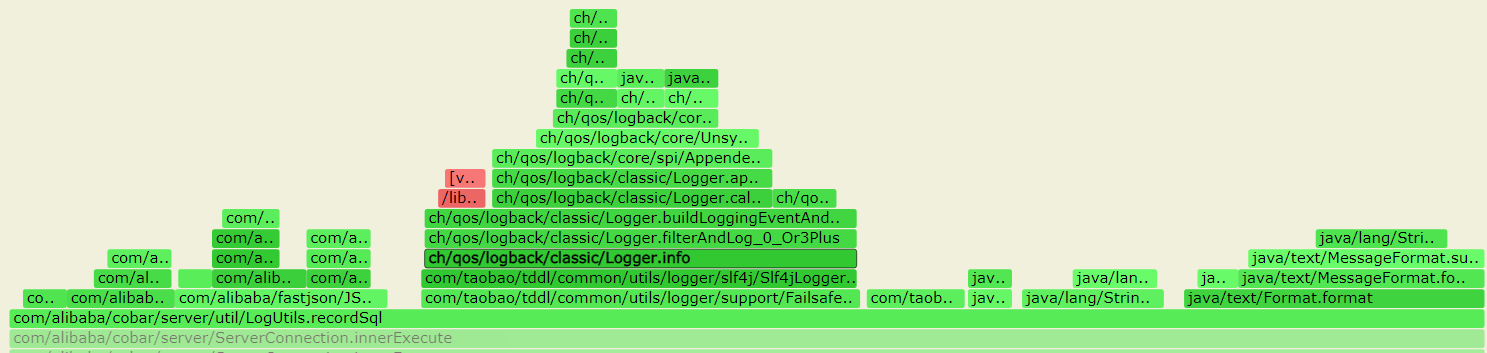
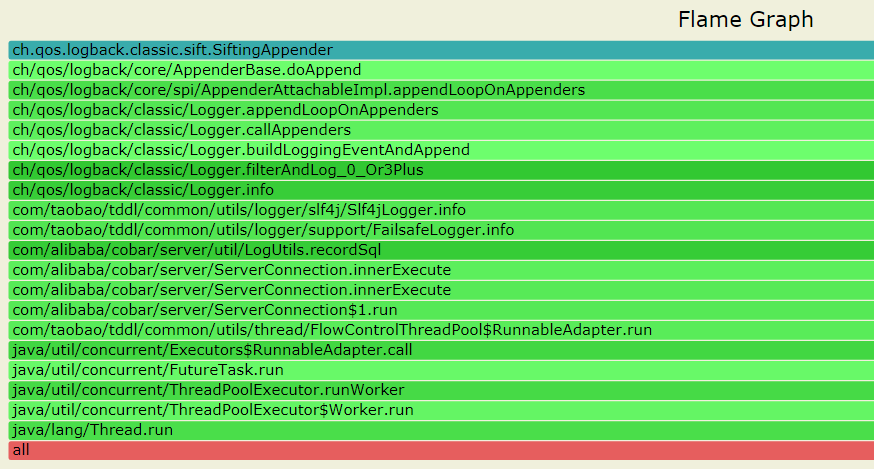
--- 1687260767618 ns (100.00%), 91083 samples [ 0] ch.qos.logback.classic.sift.SiftingAppender [ 1] ch.qos.logback.core.AppenderBase.doAppend [ 2] ch.qos.logback.core.spi.AppenderAttachableImpl.appendLoopOnAppenders [ 3] ch.qos.logback.classic.Logger.appendLoopOnAppenders [ 4] ch.qos.logback.classic.Logger.callAppenders [ 5] ch.qos.logback.classic.Logger.buildLoggingEventAndAppend [ 6] ch.qos.logback.classic.Logger.filterAndLog_0_Or3Plus [ 7] ch.qos.logback.classic.Logger.info [ 8] com.taobao.tddl.common.utils.logger.slf4j.Slf4jLogger.info [ 9] com.taobao.tddl.common.utils.logger.support.FailsafeLogger.info [10] com.alibaba.cobar.server.util.LogUtils.recordSql [11] com.alibaba.cobar.server.ServerConnection.innerExecute [12] com.alibaba.cobar.server.ServerConnection.innerExecute [13] com.alibaba.cobar.server.ServerConnection$1.run [14] com.taobao.tddl.common.utils.thread.FlowControlThreadPool$RunnableAdapter.run [15] java.util.concurrent.Executors$RunnableAdapter.call [16] java.util.concurrent.FutureTask.run [17] java.util.concurrent.ThreadPoolExecutor.runWorker [18] java.util.concurrent.ThreadPoolExecutor$Worker.run [19] java.lang.Thread.run "ServerExecutor-3-thread-480" #753 daemon prio=5 os_prio=0 tid=0x00007f8265842000 nid=0x26f1 waiting for monitor entry [0x00007f82270bf000] java.lang.Thread.State: BLOCKED (on object monitor) at ch.qos.logback.core.AppenderBase.doAppend(AppenderBase.java:64) - waiting to lock <0x00007f866dcec208> (a ch.qos.logback.classic.sift.SiftingAppender) at ch.qos.logback.core.spi.AppenderAttachableImpl.appendLoopOnAppenders(AppenderAttachableImpl.java:48) at ch.qos.logback.classic.Logger.appendLoopOnAppenders(Logger.java:282) at ch.qos.logback.classic.Logger.callAppenders(Logger.java:269) at ch.qos.logback.classic.Logger.buildLoggingEventAndAppend(Logger.java:470) at ch.qos.logback.classic.Logger.filterAndLog_0_Or3Plus(Logger.java:424) at ch.qos.logback.classic.Logger.info(Logger.java:628) at com.taobao.tddl.common.utils.logger.slf4j.Slf4jLogger.info(Slf4jLogger.java:42) at com.taobao.tddl.common.utils.logger.support.FailsafeLogger.info(FailsafeLogger.java:102) at com.alibaba.cobar.server.util.LogUtils.recordSql(LogUtils.java:115) at com.alibaba.cobar.server.ServerConnection.innerExecute(ServerConnection.java:874) - locked <0x00007f87382cb108> (a com.alibaba.cobar.server.ServerConnection) at com.alibaba.cobar.server.ServerConnection.innerExecute(ServerConnection.java:569) - locked <0x00007f87382cb108> (a com.alibaba.cobar.server.ServerConnection) at com.alibaba.cobar.server.ServerConnection$1.run(ServerConnection.java:402) at com.taobao.tddl.common.utils.thread.FlowControlThreadPool$RunnableAdapter.run(FlowControlThreadPool.java:480) at java.util.concurrent.Executors$RunnableAdapter.call(Executors.java:511) at java.util.concurrent.FutureTask.run(FutureTask.java:266) at java.util.concurrent.ThreadPoolExecutor.runWorker(ThreadPoolExecutor.java:1152) at java.util.concurrent.ThreadPoolExecutor$Worker.run(ThreadPoolExecutor.java:627) at java.lang.Thread.run(Thread.java:861)
- waiting to lock <0x00007f866dcec208> (a ch.qos.logback.classic.sift.SiftingAppender) - waiting to lock <0x00007f866dcec208> (a ch.qos.logback.classic.sift.SiftingAppender) - waiting to lock <0x00007f866dcec208> (a ch.qos.logback.classic.sift.SiftingAppender) - waiting to lock <0x00007f866dcec208> (a ch.qos.logback.classic.sift.SiftingAppender) - waiting to lock <0x00007f866dcec208> (a ch.qos.logback.classic.sift.SiftingAppender) - waiting to lock <0x00007f866dcec208> (a ch.qos.logback.classic.sift.SiftingAppender) - waiting to lock <0x00007f866dcec208> (a ch.qos.logback.classic.sift.SiftingAppender) - locked <0x00007f866dcec208> (a ch.qos.logback.classic.sift.SiftingAppender) - waiting to lock <0x00007f866dcec208> (a ch.qos.logback.classic.sift.SiftingAppender) - waiting to lock <0x00007f866dcec208> (a ch.qos.logback.classic.sift.SiftingAppender) - waiting to lock <0x00007f866dcec208> (a ch.qos.logback.classic.sift.SiftingAppender) - waiting to lock <0x00007f866dcec208> (a ch.qos.logback.classic.sift.SiftingAppender) - waiting to lock <0x00007f866dcec208> (a ch.qos.logback.classic.sift.SiftingAppender) - waiting to lock <0x00007f866dcec208> (a ch.qos.logback.classic.sift.SiftingAppender) - waiting to lock <0x00007f866dcec208> (a ch.qos.logback.classic.sift.SiftingAppender) - waiting to lock <0x00007f866dcec208> (a ch.qos.logback.classic.sift.SiftingAppender)
/**
 * Creates a new buffered output stream to write data to the
 * specified underlying output stream.
 *
 * @param   out   the underlying output stream.
 */
public BufferedOutputStream(OutputStream out) {
    this(out, 8192);
}
//3306 acceptor端口
"HTTPServer" #32 prio=5 os_prio=0 tid=0x00007fb76cde6000 nid=0x4620 runnable [0x00007fb6db5f6000]
   java.lang.Thread.State: RUNNABLE
        at sun.nio.ch.EPollArrayWrapper.epollWait(Native Method)
        at sun.nio.ch.EPollArrayWrapper.poll(EPollArrayWrapper.java:275)
        at sun.nio.ch.EPollSelectorImpl.doSelect(EPollSelectorImpl.java:93)
        at sun.nio.ch.SelectorImpl.lockAndDoSelect(SelectorImpl.java:86)
        - locked <0x000000070007fde0> (a sun.nio.ch.Util$3)
        - locked <0x000000070007fdc8> (a java.util.Collections$UnmodifiableSet)
        - locked <0x000000070002cbc8> (a sun.nio.ch.EPollSelectorImpl)
        at sun.nio.ch.SelectorImpl.select(SelectorImpl.java:97)
        at com.alibaba.cobar.net.NIOAcceptor.run(NIOAcceptor.java:63)

   Locked ownable synchronizers:
        - None
"Processor2-R" #26 prio=5 os_prio=0 tid=0x00007fb76cc9a000 nid=0x4611 runnable [0x00007fb6dbdfc000]
   java.lang.Thread.State: RUNNABLE
        at sun.nio.ch.EPollArrayWrapper.epollWait(Native Method)
        at sun.nio.ch.EPollArrayWrapper.poll(EPollArrayWrapper.java:275)
        at sun.nio.ch.EPollSelectorImpl.doSelect(EPollSelectorImpl.java:93)
        at sun.nio.ch.SelectorImpl.lockAndDoSelect(SelectorImpl.java:86)
        - locked <0x000000070006e090> (a sun.nio.ch.Util$3)
        - locked <0x000000070006cd68> (a java.util.Collections$UnmodifiableSet)
        - locked <0x00000007000509e0> (a sun.nio.ch.EPollSelectorImpl)
        at sun.nio.ch.SelectorImpl.select(SelectorImpl.java:97)
        at com.alibaba.cobar.net.NIOReactor$R.run(NIOReactor.java:88)
        at java.lang.Thread.run(Thread.java:852)
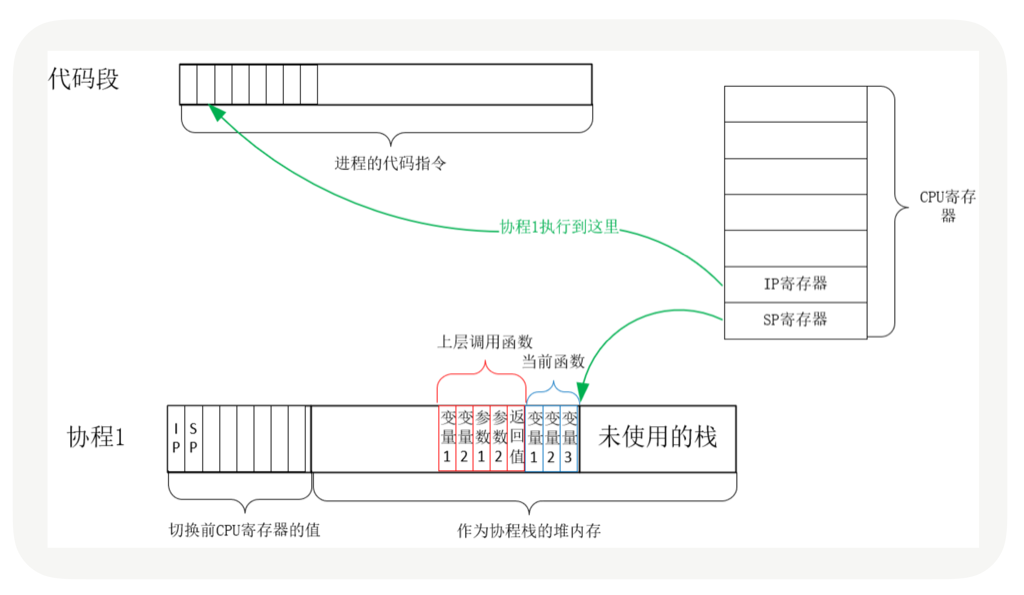
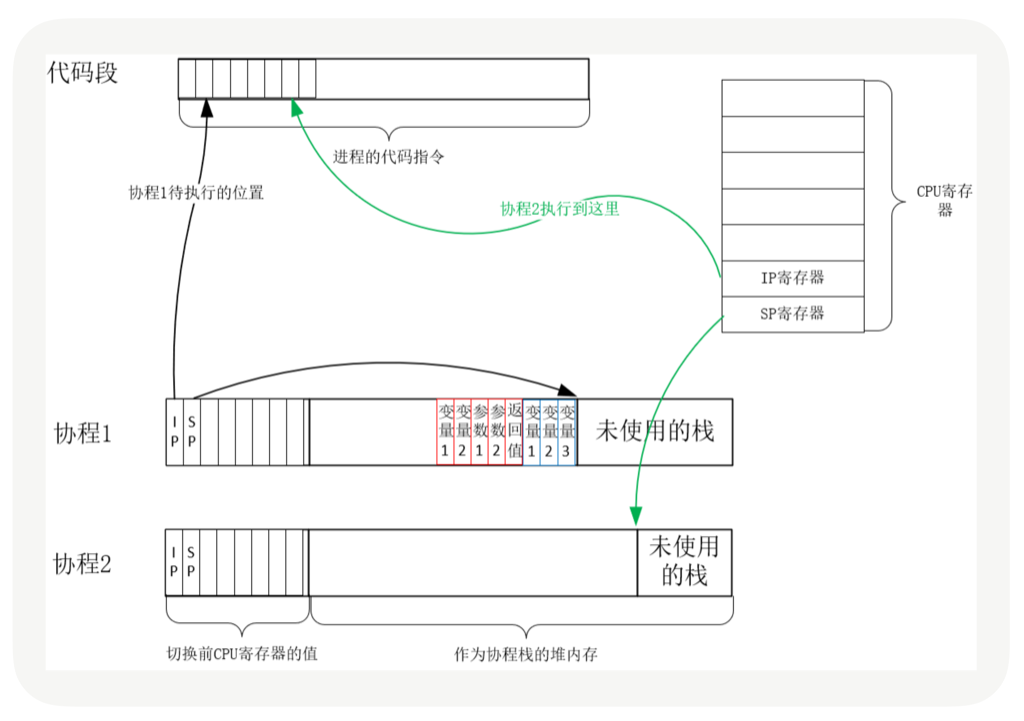
当调用这一次 yield_to 时,rsp 寄存器刚好就会指向新的协程 co 的栈,接着就会执行”pop rbp”和”retq”这两条指令。这里你需要注意一下,栈的切换,并没有改变指令的执行顺序,因为栈指针存储在 rsp 寄存器中,当前执行到的指令存储在 IP 寄存器中,rsp 的切换并不会导致 IP 寄存器发生变化。
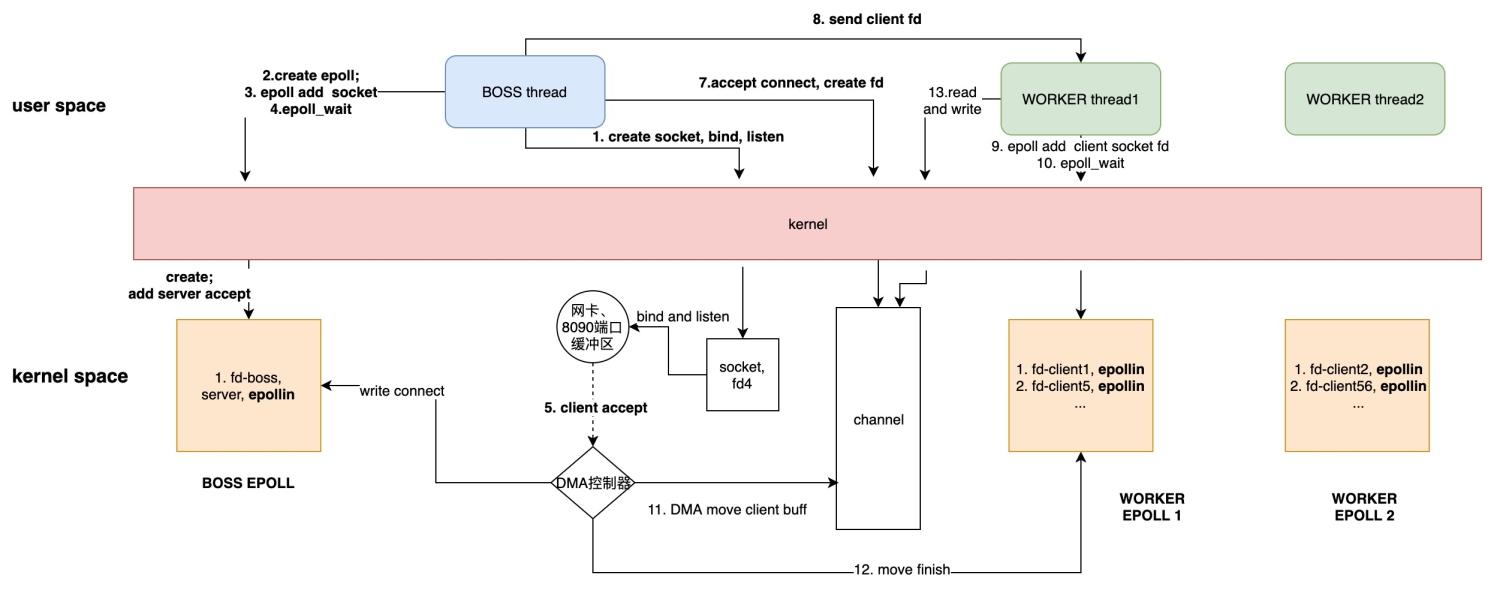
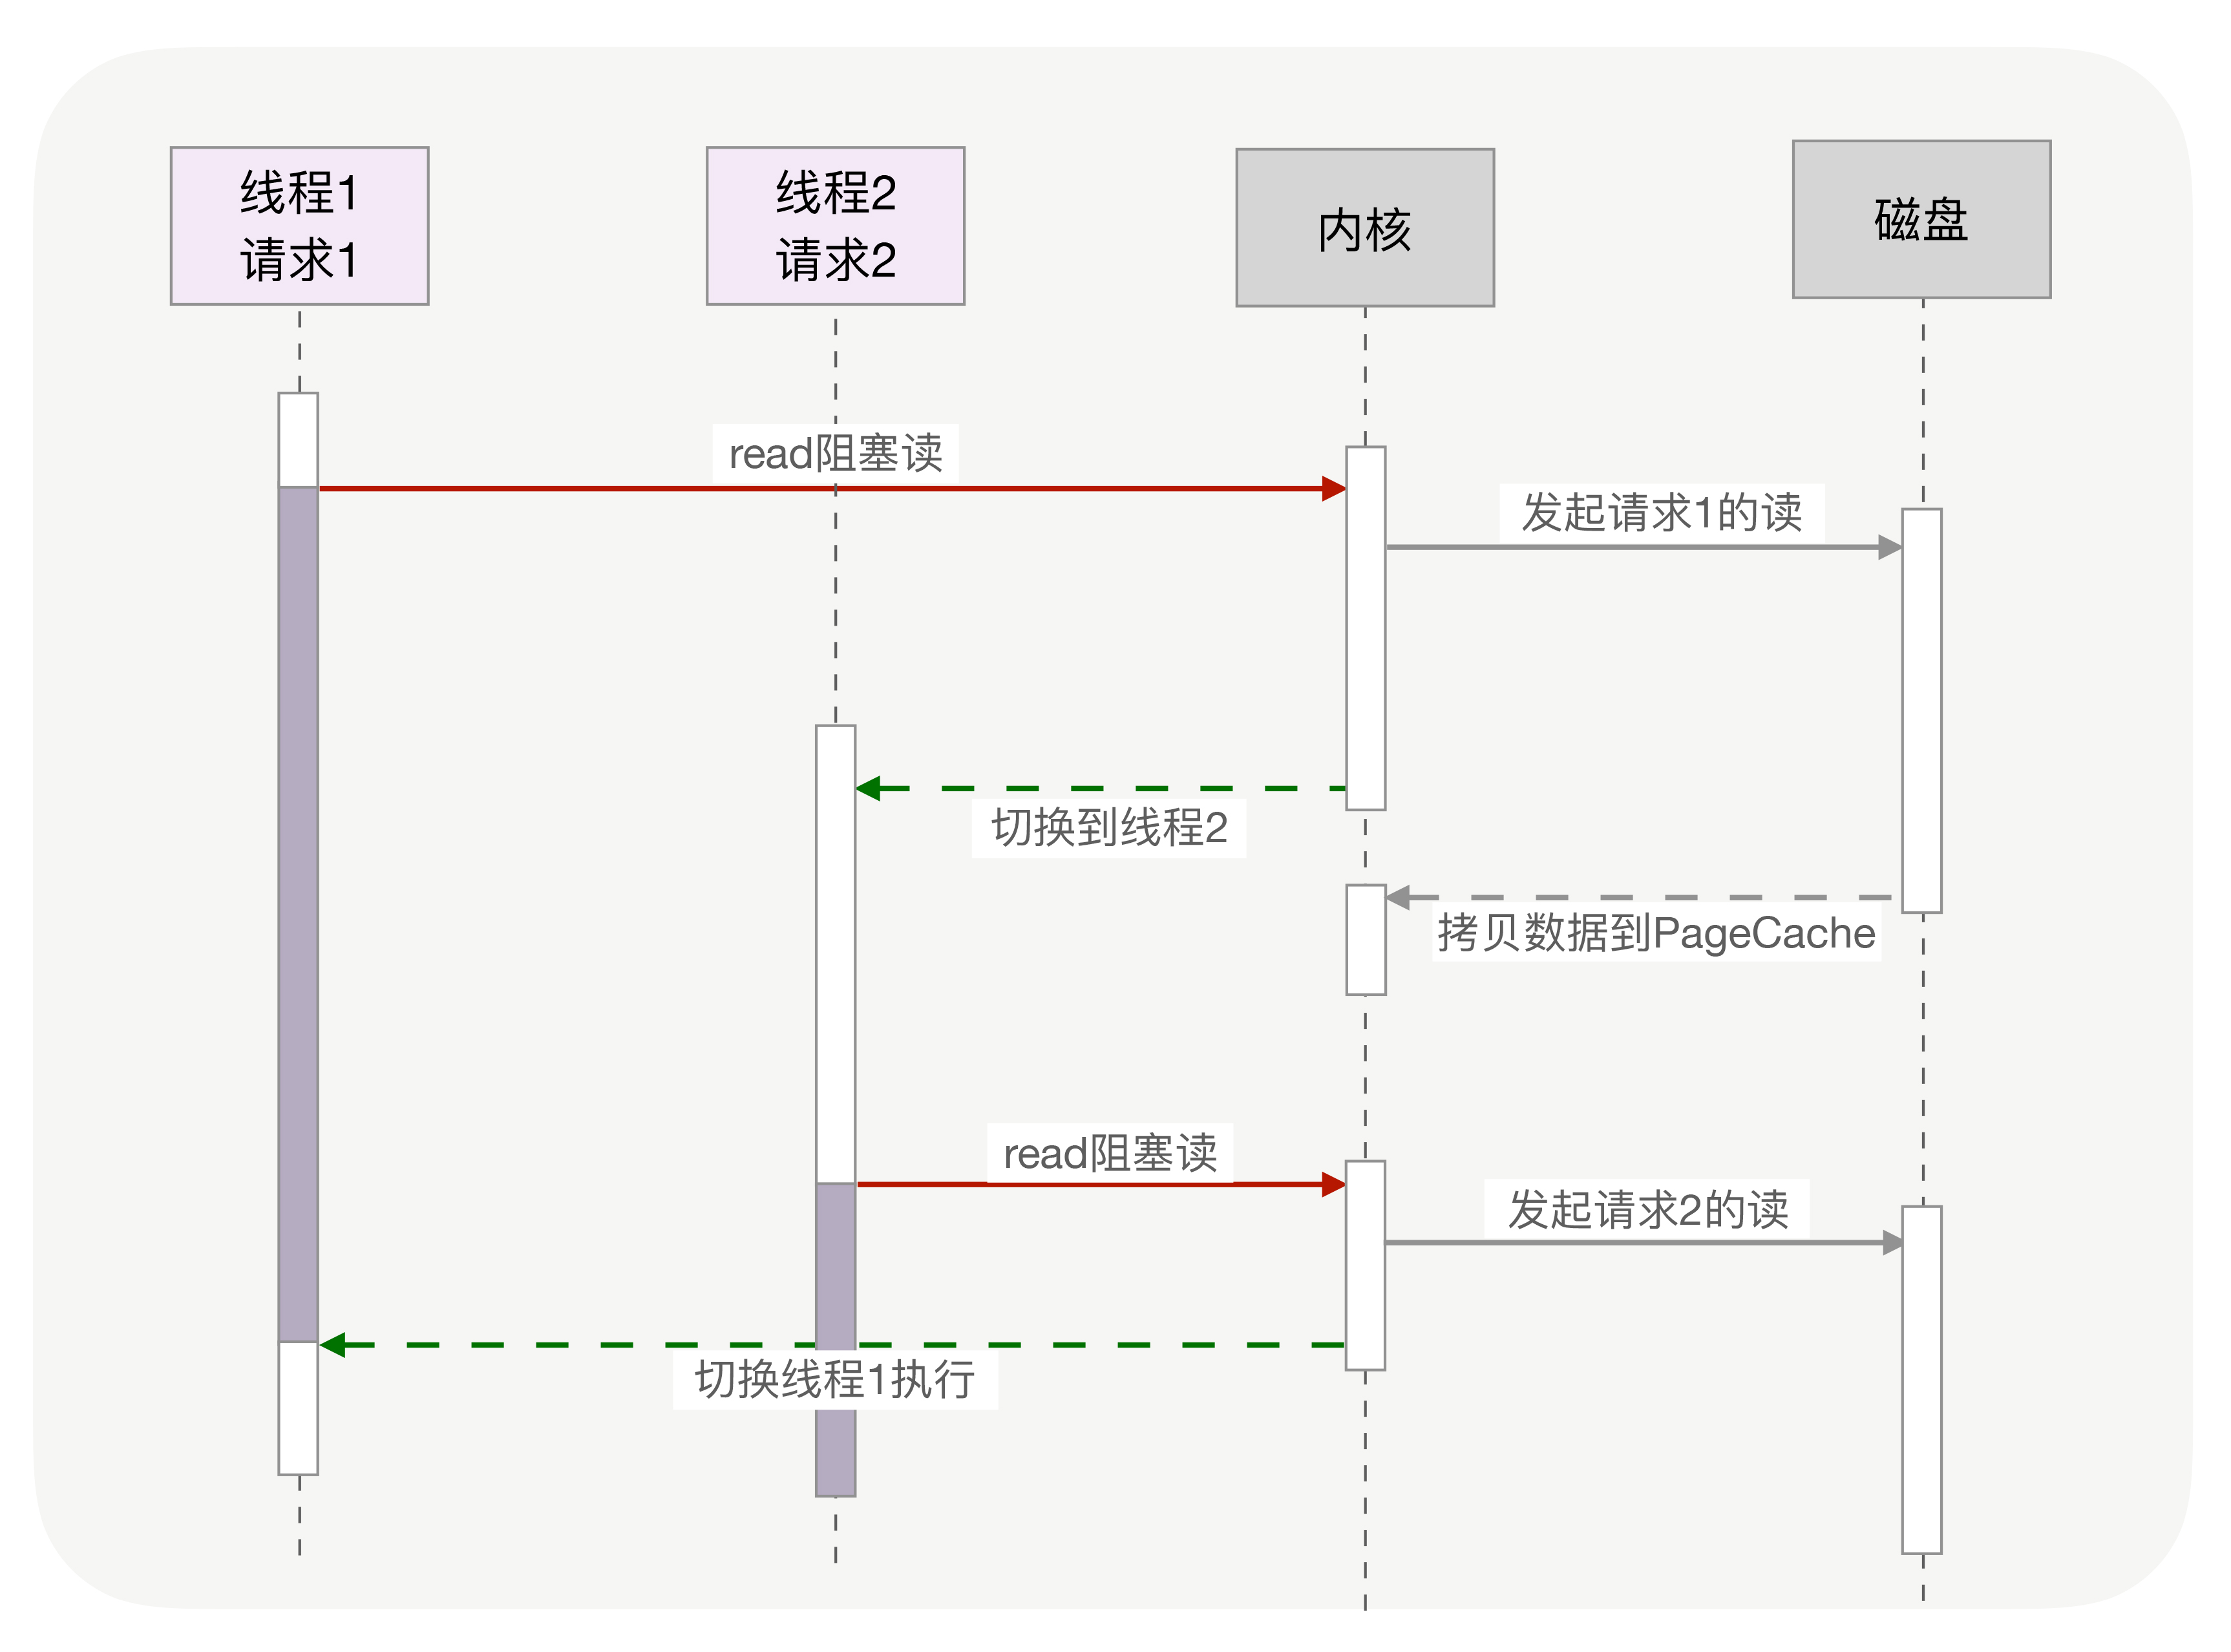
每个线程消耗内存过多, 比如,64 位的 Linux 为每个线程的栈分配了 8MB 的内存,还预分配了 64MB 的内存作为堆内存池;切换请求是内核通过切换线程实现的,什么时候会切换线程呢?不只时间片用尽,当调用阻塞方法时,内核为了让 CPU 充分工作,也会切换到其他线程执行。一次上下文切换的成本在几十纳秒到几微秒间,当线程繁忙且数量众多时,这些切换会消耗绝大部分的 CPU 运算能力。
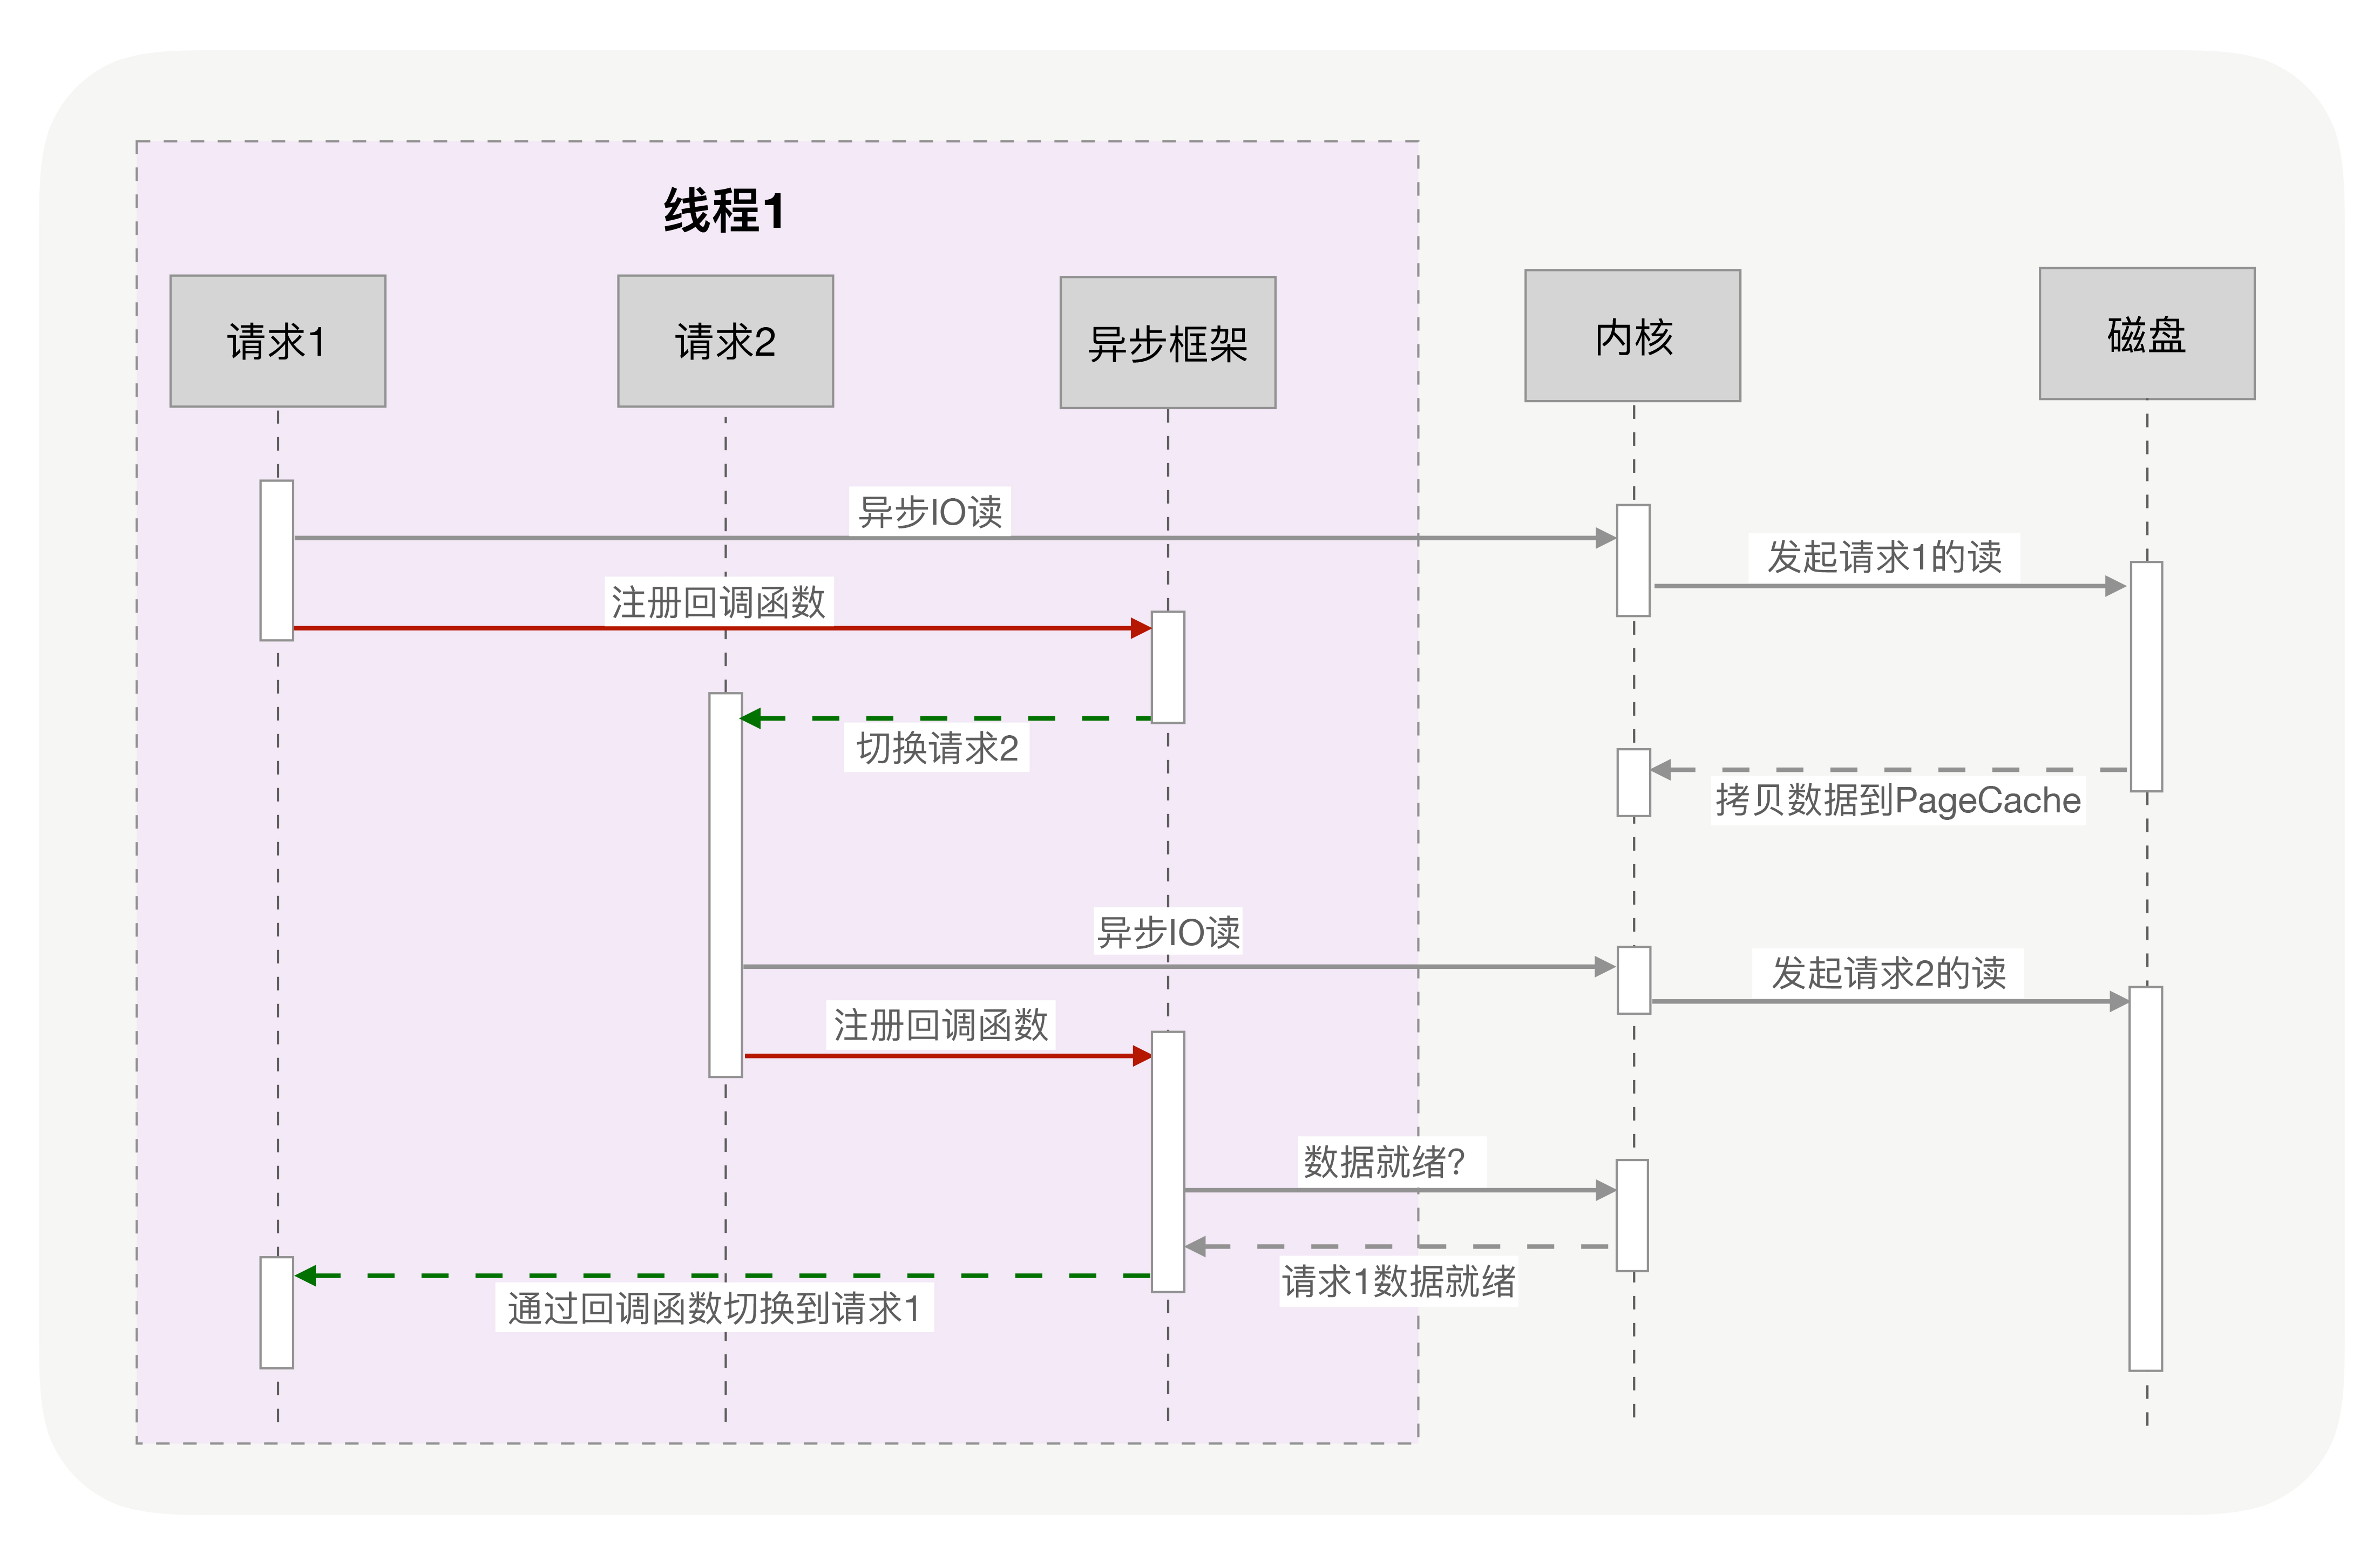
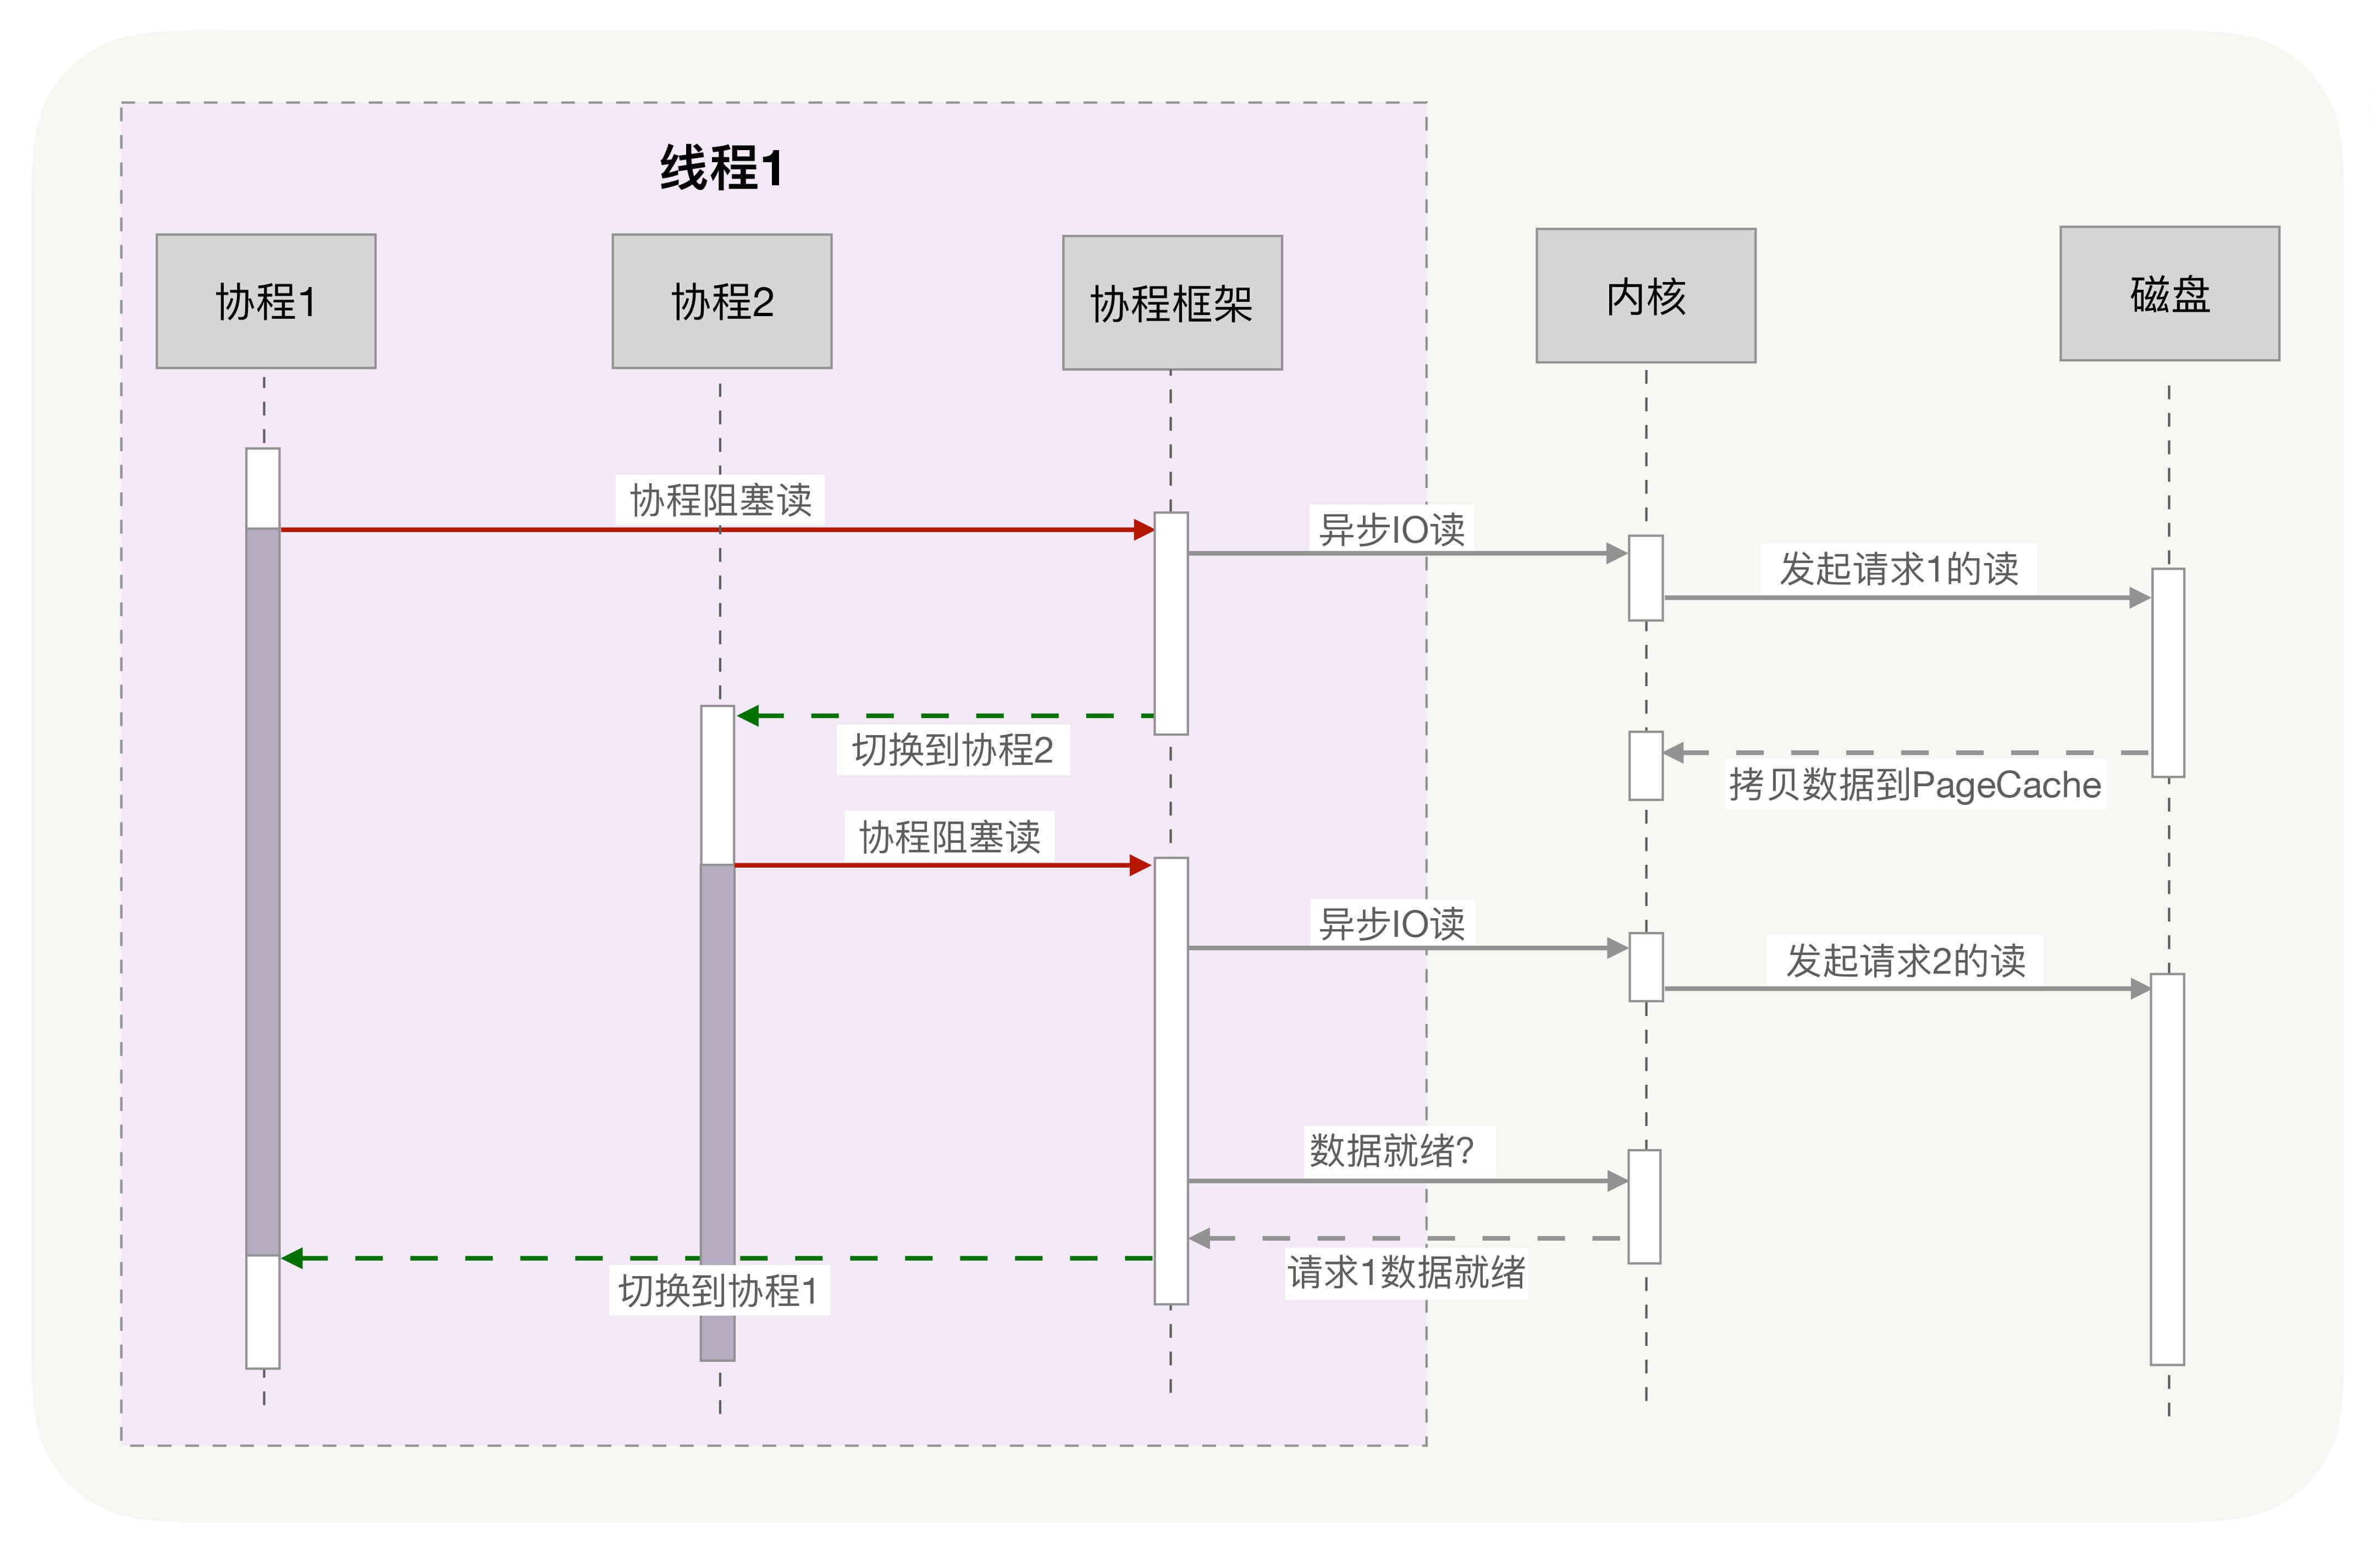
协程把内核态的切换工作交由用户态来完成.
目前主流语言基本上都选择了多线程作为并发设施,与线程相关的概念是抢占式多任务(Preemptive multitasking),而与协程相关的是协作式多任务。不管是进程还是线程,每次阻塞、切换都需要陷入系统调用 (system call),先让 CPU 执行操作系统的调度程序,然后再由调度程序决定该哪一个进程 (线程) 继续执行。
static inline int
ip_vs_dest_conn_overhead(struct ip_vs_dest *dest)
{
        /* We think the overhead of processing active connections is 256
         * times higher than that of inactive connections in average. (This
         * 256 times might not be accurate, we will change it later) We
         * use the following formula to estimate the overhead now:
         *                dest->activeconns*256 + dest->inactconns
         */
        return (atomic_read(&dest->activeconns) << 8) +
                atomic_read(&dest->inactconns);
}
What is an ActiveConn/InActConn (Active/Inactive) connnection?
ActiveConn in ESTABLISHED state
InActConn any other state
只对NAT模式下有效:
With LVS-NAT, the director sees all the packets between the client and the realserver, so always knows the state of tcp connections and the listing from ipvsadm is accurate. However for LVS-DR, LVS-Tun, the director does not see the packets from the realserver to the client.
Example with my Apache Web server.
Client  	    <---> Server

A client request an object on the web server on port 80 :

SYN REQUEST     ---->
SYN ACK 	    <----
ACK             ----> *** ActiveConn=1 and 1 ESTABLISHED socket on realserver.
HTTP get        ----> *** The client request the object
HTTP response   <---- *** The server sends the object
APACHE closes the socket : *** ActiveConn=1 and 0 ESTABLISHED socket on realserver
The CLIENT receives the object. (took 15 seconds in my test)
ACK-FIN         ----> *** ActiveConn=0 and 0 ESTABLISHED socket on realserver