plantegg

java tcp mysql performance network docker Linux

MySQL 8.0新特性和性能数据

MySQL 8.0带来了很多新特性

针对性能方面介绍全在这个PPT( http://dimitrik.free.fr/Presentations/MySQL_Perf-OOW2018-dim.pdf)里面了:

IO_Bound 下性能提升简直非常明显,之前主要是fil_system的锁导致IO的并发上不去,见图1。

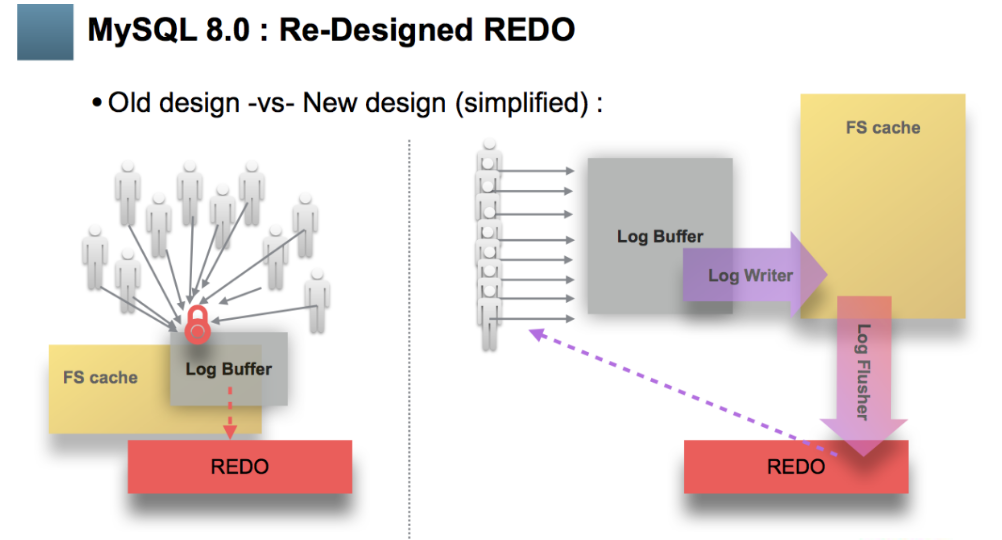
因为优化了redo的写入模式,采用了事件的模型,所以写入场景有较好的提升 。

utf8mb4在点查询场景优势不明显,在distinct range查询下有30%提升。

内存只读场景略有提升。

还有傲腾对SSD的数据,不过Intel都放弃了,就不说了。

性能

page size

MySQL的页都是16K, 当查询的行不在内存中时需要按照16K为单位从磁盘读取页,而文件系统中的页是4k,也就是一次数据库请求需要有4次磁盘IO,如过查询比较随机,每次只需要一个页中的几行数据,存在很大的读放大。

那么我们是否可以把MySQL的页设置为4K来减少读放大呢?

在5.7里收益不大,因为每次IO存在 fil_system 的锁,导致IO的并发上不去

8.0中总算优化了这个场景,测试细节可以参考这篇

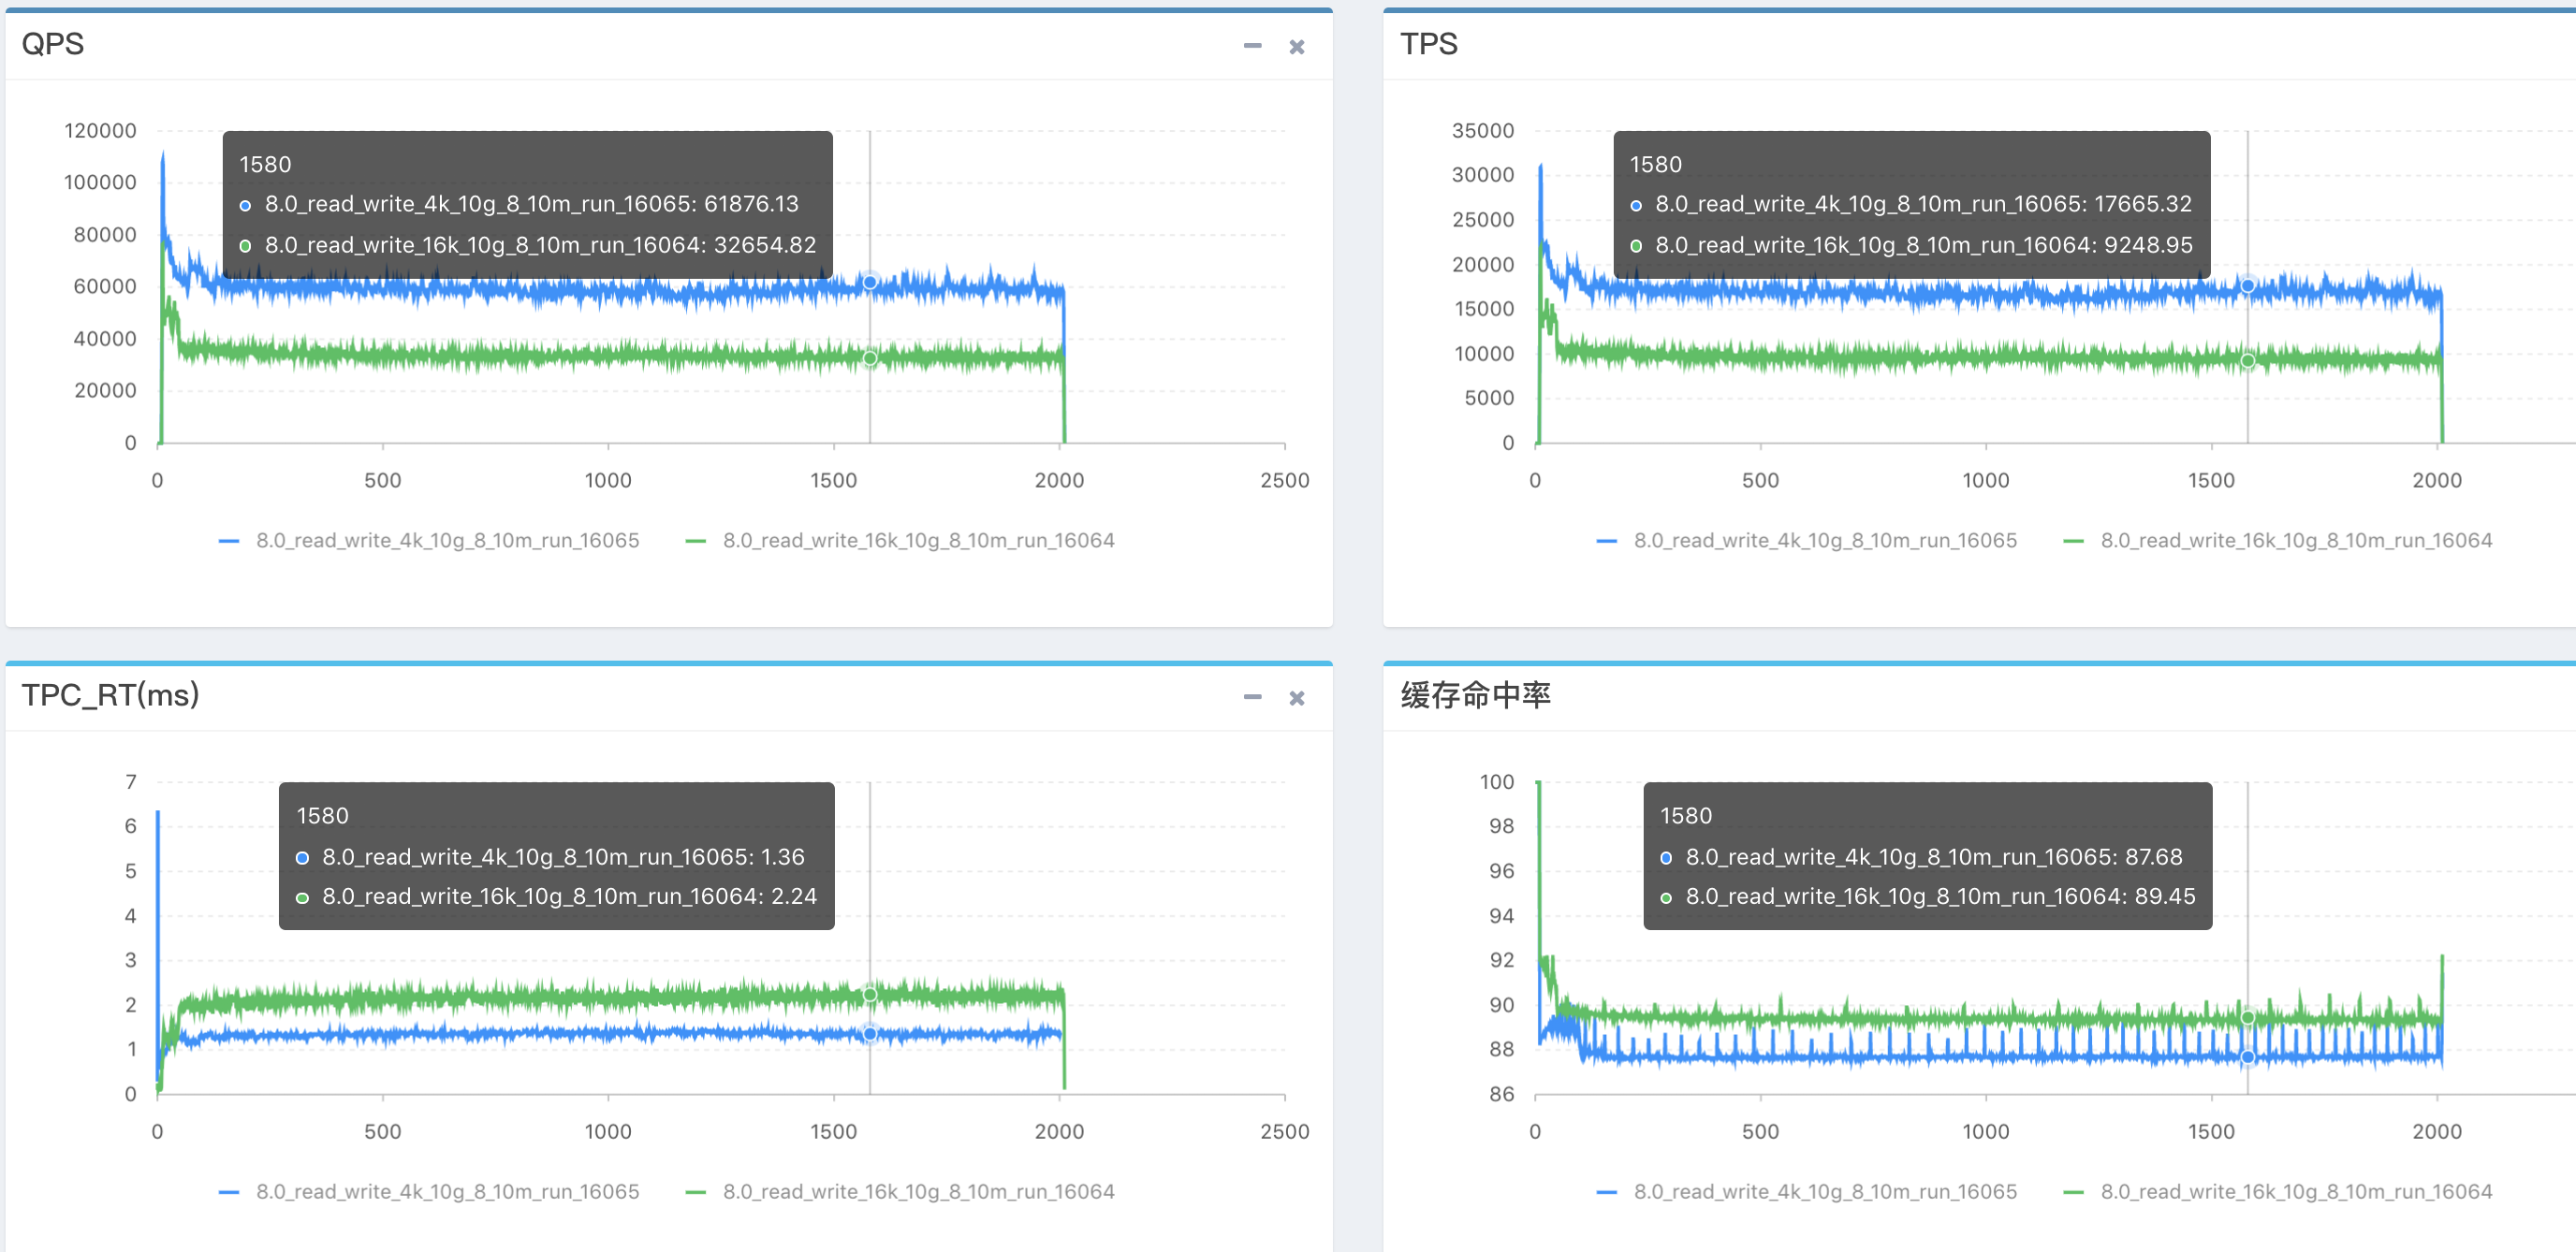
16K VS 4K 性能对比(4K接近翻倍)

img

4K会带来的问题:顺序insert慢了10%(因为fsync更多了);DDL更慢;二级索引更多的场景下4K性能较差;大BP下,刷脏代价大。

REDO的优化

redo的优化似乎是8.0读写性能优于以往的主要原因

redo的模型改成了事件驱动,而不是通过争抢锁实现,专用的flush线程刷完IO后通知用户线程,并且会根据IO的rt自动调整每次flush的data大小,如果io延迟很低,就大量小IO,如果IO延迟高,就用大io刷,也就说redo的刷写能力完全取决于IO的吞吐

但是事件驱动的方式在小并发下性能没有单线程锁的方式高效,这块已经优化了,需要自己测下效果

image-20220810150929638

Innodb 相关数据

innodb_row_read:行读,点查峰值大约在800W左右,列表查大约在1200W左右。
innodb_buffer_pool_read_requests:逻辑读,峰值800W左右。
innodb_bp_hit:innodb bp缓存命中率,比较优秀的命中率一般在99.8%+。

总结

MySQL 8.0优化总结,从官方给出的数据来看,可以总结如下

  • 只读场景没有什么优化
  • utf8mb4的性能提升比较明显
  • 优化了fil_system,MySQL 可以尝试使用4K的页
  • 8.0使用新硬件能够获得较好的收益,多socket, optane
  • 由于redo的优化以及新的热点检查算法,关闭binlog下,读写混合的场景性能比5.7好很多,但是生产环境无法关闭binlog,默认的字符集也不是latin,所以具体的数据需要单独测试,官方数据只能参考
  • Double Write的问题需要在高并发,低命中率下才会触发,生产环境遇到的不多,该问题预计下个版本就修复了
  • 生产环境需要关闭UNDO Auto-Truncate
  • binlog的问题在8.0比较明显,暂时没有解法
  • 另外innodb_flush_method=O_DIRECT_NO_FSYNC 在8.0.14版本后可以保障应用的稳定性了

Prior to 8.0.14, the O_DIRECT_NO_FSYNC setting is not recommended for use on Linux systems. It may cause the operating system to hang due to file system metadata becoming unsynchronized. As of MySQL 8.0.14, InnoDB calls fsync() after creating a new file, after increasing file size, and after closing a file, which permits O_DIRECT_NO_FSYNC mode to be safely used on EXT4 and XFS file systems. The fsync() system call is still skipped after each write operation.

上下文切换的代价

概念

进程切换、软中断、内核态用户态切换、CPU超线程切换

内核态用户态切换:还是在一个线程中,只是由用户态进入内核态为了安全等因素需要更多的指令,系统调用具体多做了啥请看:https://github.com/torvalds/linux/blob/v5.2/arch/x86/entry/entry_64.S#L145

软中断:比如网络包到达,触发ksoftirqd(每个核一个)进程来处理,是进程切换的一种

进程切换是里面最重的,少不了上下文切换,代价还有进程阻塞唤醒调度。另外进程切换有主动让出CPU的切换、也有时间片用完后被切换

CPU超线程切换:最轻,发生在CPU内部,OS、应用都无法感知

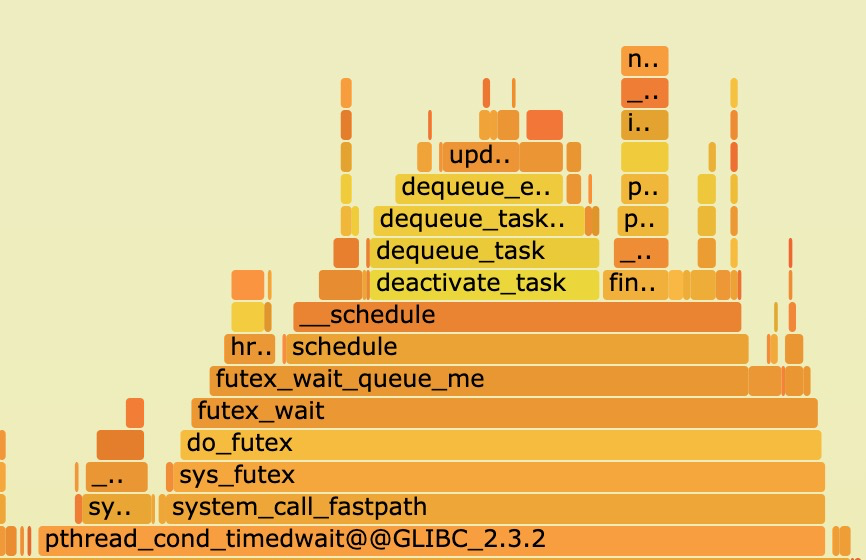
多线程调度下的热点火焰图:

image.png

上下文切换后还会因为调度的原因导致线程卡顿更久

Linux 内核进程调度时间片一般是HZ的倒数,HZ在编译的时候一般设置为1000,倒数也就是1ms,也就是每个进程的时间片是1ms(早年是10ms–HZ 为100的时候),如果进程1阻塞让出CPU进入调度队列,这个时候调度队列前还有两个进程2/3在排队,也就是最差会在2ms后才轮到1被调度执行。负载决定了排队等待调度队列的长短,如果轮到调度的进程已经ready那么性能没有浪费,反之如果轮到被调度但是没有ready(比如网络回包没到达)相当浪费了一次调度

sched_min_granularity_ns is the most prominent setting. In the original sched-design-CFS.txt this was described as the only “tunable” setting, “to tune the scheduler from ‘desktop’ (low latencies) to ‘server’ (good batching) workloads.”

In other words, we can change this setting to reduce overheads from context-switching, and therefore improve throughput at the cost of responsiveness (“latency”).

The CFS setting as mimicking the previous build-time setting, CONFIG_HZ. In the first version of the CFS code, the default value was 1 ms, equivalent to 1000 Hz for “desktop” usage. Other supported values of CONFIG_HZ were 250 Hz (the default), and 100 Hz for the “server” end. 100 Hz was also useful when running Linux on very slow CPUs, this was one of the reasons given when CONFIG_HZ was first added as an build setting on X86.

或者参数调整:

1
2
3
4
5
6
7
8
9
10
11
12
13
14
15
16
#sysctl -a |grep -i sched_ |grep -v cpu
kernel.sched_autogroup_enabled = 0
kernel.sched_cfs_bandwidth_slice_us = 5000
kernel.sched_cfs_bw_burst_enabled = 1
kernel.sched_cfs_bw_burst_onset_percent = 0
kernel.sched_child_runs_first = 0
kernel.sched_latency_ns = 24000000
kernel.sched_migration_cost_ns = 500000
kernel.sched_min_granularity_ns = 3000000
kernel.sched_nr_migrate = 32
kernel.sched_rr_timeslice_ms = 100
kernel.sched_rt_period_us = 1000000
kernel.sched_rt_runtime_us = 950000
kernel.sched_schedstats = 1
kernel.sched_tunable_scaling = 1
kernel.sched_wakeup_granularity_ns = 4000000

测试

How long does it take to make a context switch?

1
2
3
4
5
6
7
8
9
10
11
12
13
14
15
16
17
18
19
20
21
22
23
24
25
26
27
28
29
30
31
32
33
34
35
36
37
38
39
40
41
42
43
44
45
46
47
48
49
50
51
52
53
54
55
56
57
58
59
60
61
62
63
64
65
66
67
68
69
70
71
72
73
74
75
76
77
78
79
80
81
82
83
84
85
86
87
88
model name : Intel(R) Xeon(R) Platinum 8269CY CPU @ 2.50GHz
2 physical CPUs, 26 cores/CPU, 2 hardware threads/core = 104 hw threads total
-- No CPU affinity --
10000000 system calls in 1144720626ns (114.5ns/syscall)
2000000 process context switches in 6280519812ns (3140.3ns/ctxsw)
2000000 thread context switches in 6417846724ns (3208.9ns/ctxsw)
2000000 thread context switches in 147035970ns (73.5ns/ctxsw)
-- With CPU affinity --
10000000 system calls in 1109675081ns (111.0ns/syscall)
2000000 process context switches in 4204573541ns (2102.3ns/ctxsw)
2000000 thread context switches in 2740739815ns (1370.4ns/ctxsw)
2000000 thread context switches in 474815006ns (237.4ns/ctxsw)
-- With CPU affinity to CPU 0 --
10000000 system calls in 1039827099ns (104.0ns/syscall)
2000000 process context switches in 5622932975ns (2811.5ns/ctxsw)
2000000 thread context switches in 5697704164ns (2848.9ns/ctxsw)
2000000 thread context switches in 143474146ns (71.7ns/ctxsw)
----------
model name : Intel(R) Xeon(R) CPU E5-2682 v4 @ 2.50GHz
2 physical CPUs, 16 cores/CPU, 2 hardware threads/core = 64 hw threads total
-- No CPU affinity --
10000000 system calls in 772827735ns (77.3ns/syscall)
2000000 process context switches in 4009838007ns (2004.9ns/ctxsw)
2000000 thread context switches in 5234823470ns (2617.4ns/ctxsw)
2000000 thread context switches in 193276269ns (96.6ns/ctxsw)
-- With CPU affinity --
10000000 system calls in 746578449ns (74.7ns/syscall)
2000000 process context switches in 3598569493ns (1799.3ns/ctxsw)
2000000 thread context switches in 2475733882ns (1237.9ns/ctxsw)
2000000 thread context switches in 381484302ns (190.7ns/ctxsw)
-- With CPU affinity to CPU 0 --
10000000 system calls in 746674401ns (74.7ns/syscall)
2000000 process context switches in 4129856807ns (2064.9ns/ctxsw)
2000000 thread context switches in 4226458450ns (2113.2ns/ctxsw)
2000000 thread context switches in 193047255ns (96.5ns/ctxsw)
---------
model name : Intel(R) Xeon(R) Platinum 8163 CPU @ 2.50GHz
2 physical CPUs, 24 cores/CPU, 2 hardware threads/core = 96 hw threads total
-- No CPU affinity --
10000000 system calls in 765013680ns (76.5ns/syscall)
2000000 process context switches in 5906908170ns (2953.5ns/ctxsw)
2000000 thread context switches in 6741875538ns (3370.9ns/ctxsw)
2000000 thread context switches in 173271254ns (86.6ns/ctxsw)
-- With CPU affinity --
10000000 system calls in 764139687ns (76.4ns/syscall)
2000000 process context switches in 4040915457ns (2020.5ns/ctxsw)
2000000 thread context switches in 2327904634ns (1164.0ns/ctxsw)
2000000 thread context switches in 378847082ns (189.4ns/ctxsw)
-- With CPU affinity to CPU 0 --
10000000 system calls in 762375921ns (76.2ns/syscall)
2000000 process context switches in 5827318932ns (2913.7ns/ctxsw)
2000000 thread context switches in 6360562477ns (3180.3ns/ctxsw)
2000000 thread context switches in 173019064ns (86.5ns/ctxsw)
--------ECS
model name : Intel(R) Xeon(R) Platinum 8269CY CPU @ 2.50GHz
1 physical CPUs, 2 cores/CPU, 2 hardware threads/core = 4 hw threads total
-- No CPU affinity --
10000000 system calls in 561242906ns (56.1ns/syscall)
2000000 process context switches in 3025706345ns (1512.9ns/ctxsw)
2000000 thread context switches in 3333843503ns (1666.9ns/ctxsw)
2000000 thread context switches in 145410372ns (72.7ns/ctxsw)
-- With CPU affinity --
10000000 system calls in 586742944ns (58.7ns/syscall)
2000000 process context switches in 2369203084ns (1184.6ns/ctxsw)
2000000 thread context switches in 1929627973ns (964.8ns/ctxsw)
2000000 thread context switches in 335827569ns (167.9ns/ctxsw)
-- With CPU affinity to CPU 0 --
10000000 system calls in 630259940ns (63.0ns/syscall)
2000000 process context switches in 3027444795ns (1513.7ns/ctxsw)
2000000 thread context switches in 3172677638ns (1586.3ns/ctxsw)
2000000 thread context switches in 144168251ns (72.1ns/ctxsw)
---------kupeng 920
2 physical CPUs, 96 cores/CPU, 1 hardware threads/core = 192 hw threads total
-- No CPU affinity --
10000000 system calls in 1216730780ns (121.7ns/syscall)
2000000 process context switches in 4653366132ns (2326.7ns/ctxsw)
2000000 thread context switches in 4689966324ns (2345.0ns/ctxsw)
2000000 thread context switches in 167871167ns (83.9ns/ctxsw)
-- With CPU affinity --
10000000 system calls in 1220106854ns (122.0ns/syscall)
2000000 process context switches in 3420506934ns (1710.3ns/ctxsw)
2000000 thread context switches in 2962106029ns (1481.1ns/ctxsw)
2000000 thread context switches in 543325133ns (271.7ns/ctxsw)
-- With CPU affinity to CPU 0 --
10000000 system calls in 1216466158ns (121.6ns/syscall)
2000000 process context switches in 2797948549ns (1399.0ns/ctxsw)
2000000 thread context switches in 3119316050ns (1559.7ns/ctxsw)
2000000 thread context switches in 167728516ns (83.9ns/ctxsw)

测试代码仓库:https://github.com/tsuna/contextswitch

Source code: timectxsw.c Results:

  • Intel 5150: ~4300ns/context switch
  • Intel E5440: ~3600ns/context switch
  • Intel E5520: ~4500ns/context switch
  • Intel X5550: ~3000ns/context switch
  • Intel L5630: ~3000ns/context switch
  • Intel E5-2620: ~3000ns/context switch

如果绑核后上下文切换能提速在66-45%之间

系统调用代价

Source code: timesyscall.c Results:

  • Intel 5150: 105ns/syscall
  • Intel E5440: 87ns/syscall
  • Intel E5520: 58ns/syscall
  • Intel X5550: 52ns/syscall
  • Intel L5630: 58ns/syscall
  • Intel E5-2620: 67ns/syscall

https://mp.weixin.qq.com/s/uq5s5vwk5vtPOZ30sfNsOg 进程/线程切换究竟需要多少开销?

1
2
3
4
5
6
7
8
9
10
11
12
13
14
15
16
17
18
19
20
21
22
23
24
25
26
27
28
29
30
31
32
33
34
35
36
37
38
39
40
41
42
43
44
45
/*
创建两个进程并在它们之间传送一个令牌。其中一个进程在读取令牌时就会引起阻塞。另一个进程发送令牌后等待其返回时也处于阻塞状态。如此往返传送一定的次数,然后统计他们的平均单次切换时间开销
代码来自:https://www.jianshu.com/p/be3250786a91
*/
#include <stdio.h>
#include <stdlib.h>
#include <sys/time.h>
#include <time.h>
#include <sched.h>
#include <sys/types.h>
#include <unistd.h> //pipe()

int main()
{
int x, i, fd[2], p[2];
char send = 's';
char receive;
pipe(fd);
pipe(p);
struct timeval tv;
struct sched_param param;
param.sched_priority = 0;

while ((x = fork()) == -1);
if (x==0) {
sched_setscheduler(getpid(), SCHED_FIFO, &param);
gettimeofday(&tv, NULL);
printf("Before Context Switch Time%u s, %u us\n", tv.tv_sec, tv.tv_usec);
for (i = 0; i < 10000; i++) {
read(fd[0], &receive, 1);
write(p[1], &send, 1);
}
exit(0);
}
else {
sched_setscheduler(getpid(), SCHED_FIFO, &param);
for (i = 0; i < 10000; i++) {
write(fd[1], &send, 1);
read(p[0], &receive, 1);
}
gettimeofday(&tv, NULL);
printf("After Context SWitch Time%u s, %u us\n", tv.tv_sec, tv.tv_usec);
}
return 0;
}

平均每次上下文切换耗时3.5us左右

软中断开销计算

下面的计算方法比较糙,仅供参考。压力越大,一次软中断需要处理的网络包数量就越多,消耗的时间越长。如果包数量太少那么测试干扰就太严重了,数据也不准确。

测试机将收发队列设置为1,让所有软中断交给一个core来处理。

无压力时 interrupt大概4000,然后故意跑压力,CPU跑到80%,通过vmstat和top查看:

1
2
3
4
5
6
7
$vmstat 1 
procs -----------memory---------- ---swap-- -----io---- -system-- ------cpu-----
r b swpd free buff cache si so bi bo in cs us sy id wa st
19 0 0 174980 151840 3882800 0 0 0 11 1 1 1 0 99 0 0
11 0 0 174820 151844 3883668 0 0 0 0 30640 113918 59 22 20 0 0
9 0 0 175952 151852 3884576 0 0 0 224 29611 108549 57 22 21 0 0
11 0 0 171752 151852 3885636 0 0 0 3452 30682 113874 57 22 21 0 0

top看到 si% 大概为20%,也就是一个核25000个interrupt需要消耗 20% 的CPU, 说明这些软中断消耗了200毫秒

200*1000微秒/25000=200/25=8微秒,8000纳秒 – 偏高

降低压力CPU 跑到55% si消耗12%

1
2
3
4
5
procs -----------memory---------- ---swap-- -----io---- -system-- ------cpu-----
r b swpd free buff cache si so bi bo in cs us sy id wa st
6 0 0 174180 152076 3884360 0 0 0 0 25314 119681 40 17 43 0 0
1 0 0 172600 152080 3884308 0 0 0 252 24971 116407 40 17 43 0 0
4 0 0 174664 152080 3884540 0 0 0 3536 25164 118175 39 18 42 0 0

120*1000微秒/(21000)=5.7微秒, 5700纳秒 – 偏高

降低压力(4核CPU只压到15%)

1
2
3
4
5
6
7
8
procs -----------memory---------- ---swap-- -----io---- -system-- ------cpu-----
r b swpd free buff cache si so bi bo in cs us sy id wa st
0 0 0 183228 151788 3876288 0 0 0 0 15603 42460 6 3 91 0 0
0 0 0 181312 151788 3876032 0 0 0 0 15943 43129 7 2 91 0 0
1 0 0 181728 151788 3876544 0 0 0 3232 15790 42409 7 3 90 0 0
0 0 0 181584 151788 3875956 0 0 0 0 15728 42641 7 3 90 0 0
1 0 0 179276 151792 3876848 0 0 0 192 15862 42875 6 3 91 0 0
0 0 0 179508 151796 3876424 0 0 0 0 15404 41899 7 2 91 0 0

单核11000 interrupt,对应 si CPU 2.2%

22*1000/11000= 2微秒 2000纳秒 略微靠谱

超线程切换开销

最小,基本可以忽略,1ns以内

lmbench测试工具

lmbench的lat_ctx等,单位是微秒,压力小的时候一次进程的上下文是1540纳秒

1
2
3
4
5
6
7
8
9
10
11
12
13
14
15
16
17
18
19
20
[root@plantegg 13:19 /root/lmbench3]
#taskset -c 4 ./bin/lat_ctx -P 2 -W warmup -s 64 2 //CPU 打满
"size=64k ovr=3.47
2 7.88

#taskset -c 4 ./bin/lat_ctx -P 1 -W warmup -s 64 2
"size=64k ovr=3.46
2 1.54

#taskset -c 4-5 ./bin/lat_ctx -W warmup -s 64 2
"size=64k ovr=3.44
2 3.11

#taskset -c 4-7 ./bin/lat_ctx -P 2 -W warmup -s 64 2 //CPU 打到50%
"size=64k ovr=3.48
2 3.14

#taskset -c 4-15 ./bin/lat_ctx -P 3 -W warmup -s 64 2
"size=64k ovr=3.46
2 3.18

协程对性能的影响

将WEB服务改用协程调度后,TPS提升50%(30000提升到45000),而contextswitch数量从11万降低到8000(无压力的cs也有4500)

1
2
3
4
5
6
7
8
9
10
11
12
13
14
15
16
17
18
19
20
21
22
procs -----------memory---------- ---swap-- -----io---- -system-- ------cpu-----
r b swpd free buff cache si so bi bo in cs us sy id wa st
5 0 0 3831480 153136 3819244 0 0 0 0 23599 6065 79 19 2 0 0
4 0 0 3829208 153136 3818824 0 0 0 160 23324 7349 80 18 2 0 0
4 0 0 3833320 153140 3818672 0 0 0 0 24567 8213 80 19 2 0 0
4 0 0 3831880 153140 3818532 0 0 0 0 24339 8350 78 20 2 0 0

[ 99s] threads: 60, tps: 0.00, reads/s: 44609.77, writes/s: 0.00, response time: 2.05ms (95%)
[ 100s] threads: 60, tps: 0.00, reads/s: 46538.27, writes/s: 0.00, response time: 1.99ms (95%)
[ 101s] threads: 60, tps: 0.00, reads/s: 46061.84, writes/s: 0.00, response time: 2.01ms (95%)
[ 102s] threads: 60, tps: 0.00, reads/s: 46961.05, writes/s: 0.00, response time: 1.94ms (95%)
[ 103s] threads: 60, tps: 0.00, reads/s: 46224.15, writes/s: 0.00, response time: 2.00ms (95%)
[ 104s] threads: 60, tps: 0.00, reads/s: 46556.93, writes/s: 0.00, response time: 1.98ms (95%)
[ 105s] threads: 60, tps: 0.00, reads/s: 45965.12, writes/s: 0.00, response time: 1.97ms (95%)
[ 106s] threads: 60, tps: 0.00, reads/s: 46369.96, writes/s: 0.00, response time: 2.01ms (95%)

//4core 机器下
PID USER PR NI VIRT RES SHR S %CPU %MEM TIME+ COMMAND
11588 admin 20 0 12.9g 6.9g 22976 R 95.7 45.6 0:33.07 Root-Worke //四个协程把CPU基本跑满
11586 admin 20 0 12.9g 6.9g 22976 R 93.7 45.6 0:34.29 Root-Worke
11587 admin 20 0 12.9g 6.9g 22976 R 93.7 45.6 0:32.58 Root-Worke
11585 admin 20 0 12.9g 6.9g 22976 R 92.0 45.6 0:33.25 Root-Worke

没开协程CPU有20%闲置打不上去,开了协程后CPU 跑到95%

结论

  • 进程上下文切换需要几千纳秒(不同CPU型号会有差异)
  • 如果做taskset 那么上下文切换会减少50%的时间(避免了L1、L2 Miss等)
  • 线程比进程上下文切换略快10%左右
  • 测试数据和实际运行场景相关很大,比较难以把控,CPU竞争太激烈容易把等待调度时间计入;如果CPU比较闲体现不出cache miss等导致的时延加剧
  • 系统调用相对进程上下文切换就很轻了,大概100ns以内
  • 函数调用更轻,大概几个ns,压栈跳转
  • CPU的超线程调度和函数调用差不多,都是几个ns可以搞定

看完这些数据再想想协程是在做什么、为什么效率高就很自然的了

Netty和Disruptor的cache_line对齐实践

原理先看这篇:CPU 性能和Cache Line

写这篇文章的起因是这个 记一次 Netty PR 的提交,然后我去看了下这次提交,发现Netty的这部分代码有问题、这次提交也有问题

什么是 cache_line

CPU从内存中读取数据的时候是一次读一个cache_line到 cache中以提升效率,一般情况下cache_line的大小是64 byte,也就是每次读取64byte到CPU cache中,按照热点逻辑这个cache line中的数据大概率会被访问到。

cache 失效

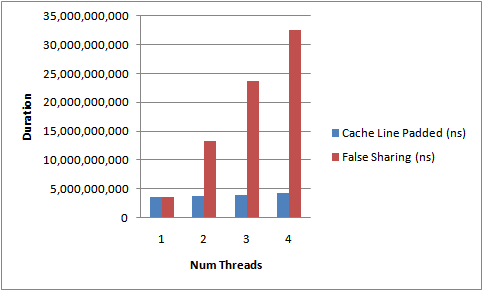
假设CPU的两个核 A 和 B, 都在各自本地 Cache Line 里有同一个变量1的拷贝时,此时该 Cache Line 处于 Shared 状态。当 核A 在本地修改了变量2,除去把本地变量所属的 Cache Line 置为 Modified 状态以外,还必须在另一个 核B 读另一个变量2前,对该变量所在的 B 处理器本地 Cache Line 发起 Invaidate 操作,标记 B 处理器的那条 Cache Line 为 Invalidate 状态。随后,若处理器 B 在对变量做读写操作时,如果遇到这个标记为 Invalidate 的状态的 Cache Line,即会引发 Cache Miss,从而将内存中最新的数据拷贝到 Cache Line 里,然后处理器 B 再对此 Cache Line 对变量做读写操作。

上面这个过程也叫false-share, 即伪共享,因为变量1、2不是真的关联共享,本来变量1失效不应该导致变量2失效,但是因为cache line机制的存在导致 变量2也失效了,所以这里变量1、2叫false-share

Disruptor中对cache_line的使用

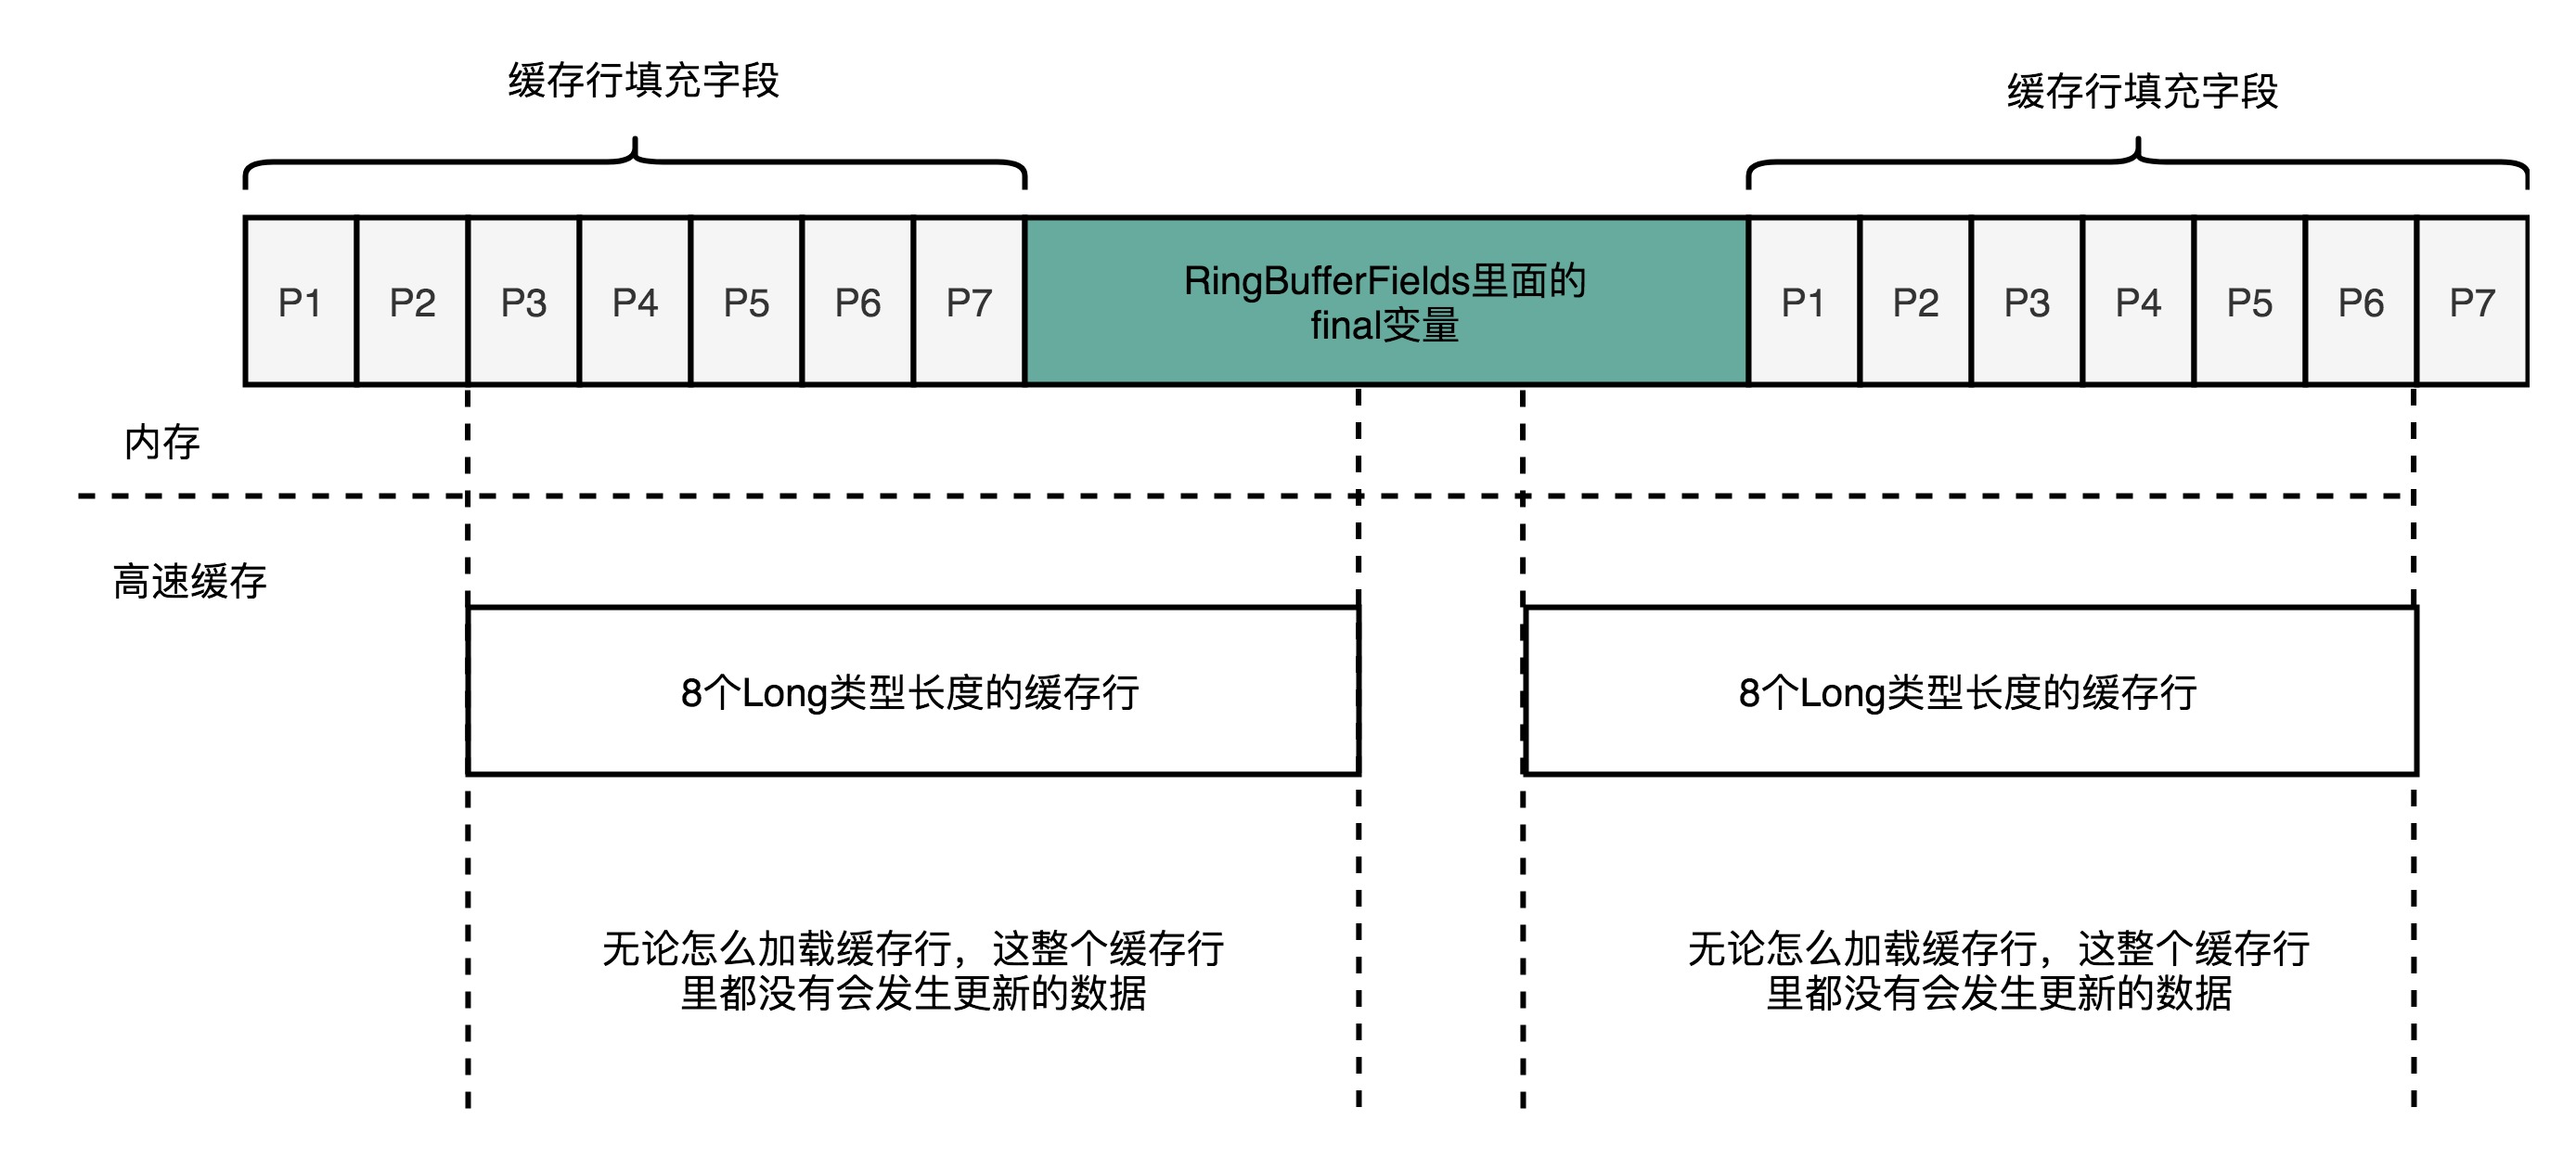
Disruptor中为了保护下面的那几个final 成员变量,前后都加了 p1-p7就是为了避免这4个final成员不要和别的变量放到同一个cache line中。

重点留意下面代码中的p1-p7这几个没有用的long变量,实际使用来占位,占住实际变量前后的位置,这样避免这些变量被其他变量的修改而失效。

1
2
3
4
5
6
7
8
9
10
11
12
13
14
15
16
17
18
19
20
21
abstract class RingBufferPad
{
protected long p1, p2, p3, p4, p5, p6, p7;
}

abstract class RingBufferFields<E> extends RingBufferPad
{
......
private final long indexMask;
private final Object[] entries;
protected final int bufferSize;
protected final Sequencer sequencer;
......
}

public final class RingBuffer<E> extends RingBufferFields<E> implements Cursored, EventSequencer<E>, EventSink<E>
{
......
protected long p1, p2, p3, p4, p5, p6, p7;
......
}

结果如下图所示绿色部分很好地被保护起来一定是独占一个cache line,本来绿色部分都是final,也就是你理解成只读的,不会更改了,这样不会因为共享cache line的变量被修改导致他们所在的cache失效(完全没必要)

image.png

队列大部分时候都是空的(head挨着tail),也就导致head 和 tail在一个cache line中,读和写会造成没必要的cache ping-pong,一般可以通过将head 和 tail 中间填充其它内容来实现错开到不同的cache line中

image

数组(RingBuffer)基本能保证元素在内存中是连续的,但是Queue(链表)就不一定了,连续的话更利于CPU cache

Netty中cache line的对齐

注意下图12行的代码,重点也请注意下11行的注释

1
2
3
4
5
6
7
8
9
10
11
12
13
14
15
16
17
18
19
20
21
// String-related thread-locals
private StringBuilder stringBuilder;
private Map<Charset, CharsetEncoder> charsetEncoderCache;
private Map<Charset, CharsetDecoder> charsetDecoderCache;

// ArrayList-related thread-locals
private ArrayList<Object> arrayList;

private BitSet cleanerFlags;

/** @deprecated These padding fields will be removed in the future. */
public long rp1, rp2, rp3, rp4, rp5, rp6, rp7, rp8;

static {
STRING_BUILDER_INITIAL_SIZE =
SystemPropertyUtil.getInt("io.netty.threadLocalMap.stringBuilder.initialSize", 1024);
logger.debug("-Dio.netty.threadLocalMap.stringBuilder.initialSize: {}", STRING_BUILDER_INITIAL_SIZE);

STRING_BUILDER_MAX_SIZE = SystemPropertyUtil.getInt("io.netty.threadLocalMap.stringBuilder.maxSize", 1024 * 4);
logger.debug("-Dio.netty.threadLocalMap.stringBuilder.maxSize: {}", STRING_BUILDER_MAX_SIZE);
}

一看这里也和Disruptor一样想保护某个变量尽量少失效,可是这个实现我看不出来想要保护哪个变量,因为这种保护办法只对齐了一边,还有一边是和别的变量共享cache line。

另外这个代码之前是9个long rp来对齐,这个PR改成了8个,9个就实在是迷惑了(9个long占72bytes了)对齐也是64bytes就好了

还是按照11行注释所说去掉这个对齐的rp吧,要不明确要保护哪些变量,前后夹击真正保护起来,并且做好对比测试

总结

Netty的这段代码纸上谈兵更多一点,Donald E. Knuth 告诉我们不要提前优化

系列文章

CPU的制造和概念

[Perf IPC以及CPU性能](/2021/05/16/Perf IPC以及CPU利用率/)

[CPU 性能和Cache Line](/2021/05/16/CPU Cache Line 和性能/)

十年后数据库还是不敢拥抱NUMA?

[Intel PAUSE指令变化是如何影响自旋锁以及MySQL的性能的](/2019/12/16/Intel PAUSE指令变化是如何影响自旋锁以及MySQL的性能的/)

Intel、海光、鲲鹏920、飞腾2500 CPU性能对比

一次海光物理机资源竞争压测的记录

飞腾ARM芯片(FT2500)的性能测试

记一次听风扇声音来定位性能瓶颈

背景

在一次POC测试过程中,测试机构提供了两台Intel压力机来压我们的集群

  • 压力机1:两路共72core intel 5XXX系列 CPU,主频2.2GHz, 128G内存
  • 压力机2:四路共196core intel 8XXX系列 CPU,主频2.5GHz, 256G内存 (8系列比5系列 CPU的性能要好、要贵)

从CPU硬件指标来看压力机2都是碾压压力机1,但是实际测试是压力机2只能跑到接近压力机1的能力,两台机器CPU基本都跑满,并且都是压测进程消耗了90%以上的CPU,内核态消耗不到5%CPU

所以接下来需要在调试我们集群性能前先把测试机优化好,才能把压力打上来。

分析

测试机构提供的机器上没有任何工具来评估CPU性能,也无法安装,只能仔细听196core机器的CPU风扇声音更小,说明196core的CPU出工不出力,大概是流水线在频繁地Stall(不管你信不信反正我是信的)

进一步分析,首先看到 业务消耗了90%以上的CPU,内核态消耗不到5%CPU,两台机器都是这样,这说明 196core 只跑出了 72core的水平,一定是CPU效率出了问题,top看到的CPU占用率不完全是全力在运算,其实cpu 流水线stall也是占用CPU的。

这个分析理论请参考我的文章《Perf IPC以及CPU性能》

验证

通过stream测试读写内存的带宽和时延,得到如下数据:

72core机器, 本路时延1.1,跨路时延1.4,因为是2路所以有50%的概率跨路,性能下降30%

196core机器,本路时延1.2,跨路时延1.85,因为是4路所以有75%的概率跨路,性能下降50%

从以上测试数据可以明显看到虽然196core机器拥有更强的单核能力以及更多的核数,但是因为访问内存太慢严重拖累了CPU运算能力,导致大部分时间CPU都在等待内存,这里CPU和内存的速度差了2个数量级,所以内存延时才是整体的瓶颈。

测试数据和方法请参考我的文章《AMD Zen CPU 架构以及不同CPU性能大PK》

有了这个数据心里非常有底问题在哪里了,但是还要想清楚怎么解释给测试机构他们才会信服,因为第一次解释他们直接说不可能,怎么会196core打不过72core呢,再说从来没有集群是测试机构196core压力机打不满的,这台压力机用了几年从来没有人说过这个问题 :(

内存信息

接下来需要拿到更详细的硬件信息来说服测试机构了。

通过dmidecode 获取两台机器内存的速度,分别是2100(196core) VS 2900(72core),同时系统也吐出了内存延时分别是 0.5ns VS 0.3 ns,这两个时间对比很直观,普通人也能看懂。

1
2
3
4
5
6
7
8
9
10
11
12
13
14
15
16
17
18
19
20
21
22
23
24
25
26
27
28
29
30
31
32
33
34
35
36
37
38
39
40
41
42
43
44
45
46
47
48
49
50
51
52
53
54
55
56
57
//以下硬件信息是从家里机器上获取,并非测试机构提供的机器,测试机构提供的机器不让拍照和采集
#dmidecode -t memory
# dmidecode 3.2
Getting SMBIOS data from sysfs.
SMBIOS 3.2.1 present.
# SMBIOS implementations newer than version 3.2.0 are not
# fully supported by this version of dmidecode.

Handle 0x0033, DMI type 16, 23 bytes
Physical Memory Array
Location: System Board Or Motherboard
Use: System Memory
Error Correction Type: Multi-bit ECC
Maximum Capacity: 2 TB //最大支持2T
Error Information Handle: 0x0032
Number Of Devices: 32 //32个插槽

Handle 0x0041, DMI type 17, 84 bytes
Memory Device
Array Handle: 0x0033
Error Information Handle: 0x0040
Total Width: 72 bits
Data Width: 64 bits
Size: 32 GB
Form Factor: DIMM
Set: None
Locator: CPU0_DIMMA0
Bank Locator: P0 CHANNEL A
Type: DDR4
Type Detail: Synchronous Registered (Buffered)
Speed: 2933 MT/s //dmmi 内存插槽支持最大速度 ?
Manufacturer: SK Hynix
Serial Number: 220F9EC0
Asset Tag: Not Specified
Part Number: HMAA4GR7AJR8N-WM
Rank: 2
Configured Memory Speed: 2100 MT/s //内存实际运行速度
Minimum Voltage: 1.2 V
Maximum Voltage: 1.2 V
Configured Voltage: 1.2 V
Memory Technology: DRAM
Memory Operating Mode Capability: Volatile memory
Module Manufacturer ID: Bank 1, Hex 0xAD
Non-Volatile Size: None
Volatile Size: 32 GB

#lshw
*-bank:19 //主板插槽槽位
description: DIMM DDR4 Synchronous Registered (Buffered) 2933 MHz (0.3 ns)
product: HMAA4GR7AJR8N-WM
vendor: SK Hynix
physical id: 13
serial: 220F9F63
slot: CPU1_DIMMB0
size: 32GiB //实际所插内存大小
width: 64 bits
clock: 2933MHz (0.3ns)

In dmidecode’s output for memory, “Speed” is the highest speed supported by the DIMM, as determined by JEDEC SPD information. “Configured Clock Speed” is the speed at which it is currently running (as set up during boot).

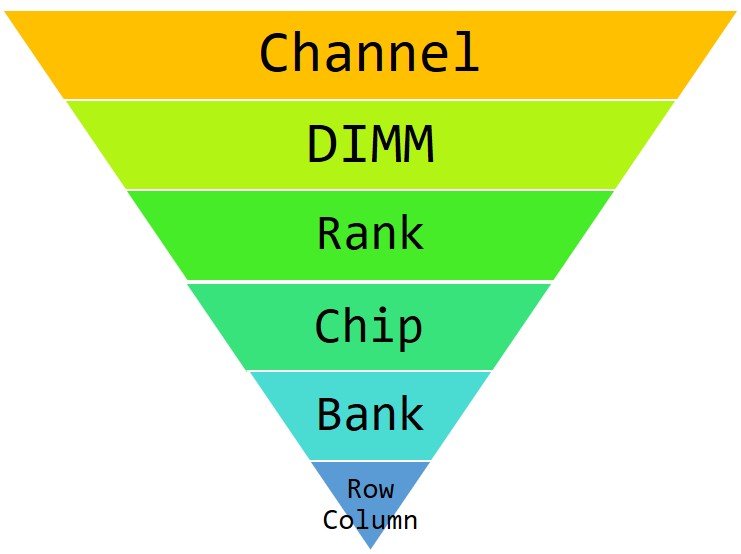
Dimm(双列直插式存储模块(dual In-line memory module)): DIMM是内存条印刷电路板正反面均有金手指与主板上的内存条槽接触,这种结构被称为DIMM。于是内存条也有人叫DIMM条,主板上的内存槽也有人称为DIMM槽。

大多数主板设计为易于用户安装和更换DIMM,通常只需打开侧边卡扣,将DIMM垂直插入插槽,然后关闭卡扣即可固定内存模块。正确安装DIMM时通常会有轻微的“点击”声,表示模块已经正确位于插槽中。

DIMM 代表物理上的一根内存条,下图中三根内存条共享一个channel连到 CPU

05-05_DPC_Bandwidth_Impact

image-20220705104403314

img

最终的运行方案

给196core的机器换上新的2933 MHz (0.3 ns)的内存条,速度一下子就上去了。

然后在196core的机器上起4个压力进程,每个进程分担25%的压力,避免跨路访问内存导致时延从1.2掉到1.8,实际测试也是只用196core中的48core性能和用全部196core是一样的,所以这里一定要起多个进程做内存亲和性绑定,充分使用全部196core。

最终整机196core机器的打压能力达到了原来的3.6倍左右。

总结

程序员要保护好听力,关键时刻可能会用上 :)

你说196core机器用了这么强的CPU但是为什么搭配那么差的内存以及主板,我也不知道,大概是有人拿回扣吧。

参考资料

NUMA DEEP DIVE PART 4: LOCAL MEMORY OPTIMIZATION

ssd/san/sas/磁盘/光纤/RAID性能比较

本文汇总HDD、SSD、SAN、LVM、软RAID等一些性能数据

性能比较

正好有机会用到一个san存储设备,跑了一把性能数据,记录一下

image.png

所使用的测试命令:

1
fio -ioengine=libaio -bs=4k -direct=1 -thread -rw=randwrite -size=1000G -filename=/data/fio.test -name="EBS 4K randwrite test" -iodepth=64 -runtime=60

ssd(Solid State Drive)和san的比较是在同一台物理机上,所以排除了其他因素的干扰。

简要的结论:

  • 本地ssd性能最好、sas机械盘(RAID10)性能最差

  • san存储走特定的光纤网络,不是走tcp的san(至少从网卡看不到san的流量),性能居中

  • 从rt来看 ssd:san:sas 大概是 1:3:15

  • san比本地sas机械盘性能要好,这也许取决于san的网络传输性能和san存储中的设备(比如用的ssd而不是机械盘)

NVMe SSD 和 HDD的性能比较

image.png

表中性能差异比上面测试还要大,SSD 的随机 IO 延迟比传统硬盘快百倍以上,一般在微妙级别;IO 带宽也高很多倍,可以达到每秒几个 GB;随机 IOPS 更是快了上千倍,可以达到几十万。

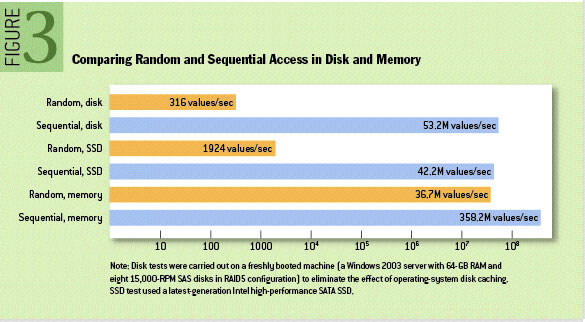
HDD只有一个磁头,并发没有意义,但是SSD支持高并发写入读取。SSD没有磁头、不需要旋转,所以随机读取和顺序读取基本没有差别。

img

从上图可以看出如果是随机读写HDD性能极差,但是如果是顺序读写HDD和SDD、内存差异就不那么大了。

磁盘类型查看

1
2
3
4
5
6
7
8
9
10
11
12
13
$cat /sys/block/vda/queue/rotational //但是对于虚拟机就不一定对
1 //1表示旋转,非ssd,0表示ssd

或者
lsblk -d -o name,rota,size,label,uuid

或者
$sudo smartctl -a /dev/sdm | grep "Rotation Rate"
Rotation Rate: 7200 rpm //机械盘

[shuguang-35E@c27c02021.cloud.c02.amtest35 /apsarapangu/disk10]
$sudo smartctl -a /dev/sdn | grep "Rotation Rate"
Rotation Rate: Solid State Device //ssd

fio测试

以下是两块测试的SSD磁盘测试前的基本情况

1
2
3
4
5
6
7
8
9
10
11
12
13
14
15
16
17
18
19
20
21
22
23
24
25
26
27
28
29
30
31
32
33
34
35
36
/dev/sda	240.06G  SSD_SATA  //sata
/dev/sfd0n1 3200G SSD_PCIE //PCIE

Filesystem Size Used Avail Use% Mounted on
/dev/sda3 49G 29G 18G 63% /
/dev/sfdv0n1p1 2.0T 803G 1.3T 40% /data

# cat /sys/block/sda/queue/rotational
0
# cat /sys/block/sfdv0n1/queue/rotational
0

#测试前的iostat状态
# iostat -d sfdv0n1 sda3 1 -x
Linux 3.10.0-957.el7.x86_64 (nu4d01142.sqa.nu8) 2021年02月23日 _x86_64_ (104 CPU)

Device: rrqm/s wrqm/s r/s w/s rkB/s wkB/s avgrq-sz avgqu-sz await r_await w_await svctm %util
sda3 0.00 10.67 1.24 18.78 7.82 220.69 22.83 0.03 1.64 1.39 1.66 0.08 0.17
sfdv0n1 0.00 0.21 9.91 841.42 128.15 8237.10 19.65 0.93 0.04 0.25 0.04 1.05 89.52

Device: rrqm/s wrqm/s r/s w/s rkB/s wkB/s avgrq-sz avgqu-sz await r_await w_await svctm %util
sda3 0.00 15.00 0.00 17.00 0.00 136.00 16.00 0.03 2.00 0.00 2.00 1.29 2.20
sfdv0n1 0.00 0.00 0.00 11158.00 0.00 54448.00 9.76 1.03 0.02 0.00 0.02 0.09 100.00

Device: rrqm/s wrqm/s r/s w/s rkB/s wkB/s avgrq-sz avgqu-sz await r_await w_await svctm %util
sda3 0.00 5.00 0.00 18.00 0.00 104.00 11.56 0.01 0.61 0.00 0.61 0.61 1.10
sfdv0n1 0.00 0.00 0.00 10970.00 0.00 53216.00 9.70 1.02 0.03 0.00 0.03 0.09 100.10

Device: rrqm/s wrqm/s r/s w/s rkB/s wkB/s avgrq-sz avgqu-sz await r_await w_await svctm %util
sda3 0.00 0.00 0.00 24.00 0.00 100.00 8.33 0.01 0.58 0.00 0.58 0.08 0.20
sfdv0n1 0.00 0.00 0.00 11206.00 0.00 54476.00 9.72 1.03 0.03 0.00 0.03 0.09 99.90

Device: rrqm/s wrqm/s r/s w/s rkB/s wkB/s avgrq-sz avgqu-sz await r_await w_await svctm %util
sda3 0.00 14.00 0.00 21.00 0.00 148.00 14.10 0.01 0.48 0.00 0.48 0.33 0.70
sfdv0n1 0.00 0.00 0.00 10071.00 0.00 49028.00 9.74 1.02 0.03 0.00 0.03 0.10 99.80

NVMe SSD测试数据

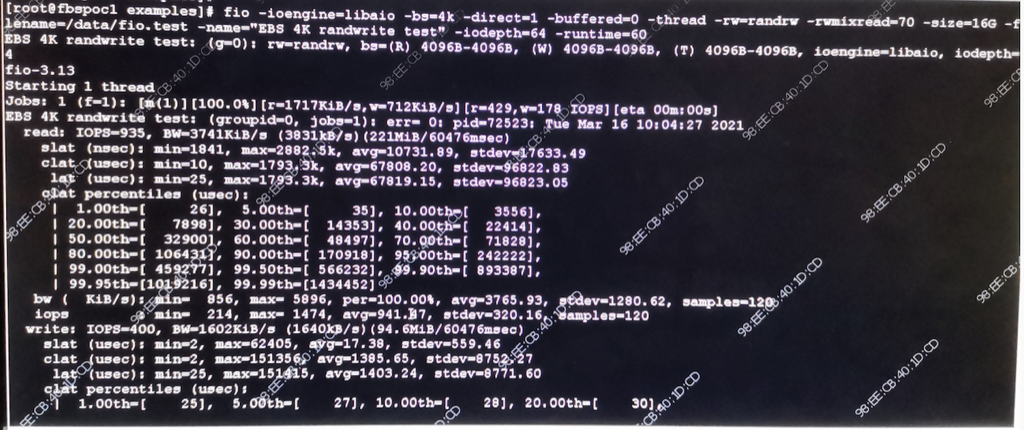
对一块ssd进行如下测试(挂载在 /data 目录 libaio 会导致测数据好几倍,可以去掉对比一下,去掉后更像 MySQL innodb 的场景 )

1
2
3
4
5
6
7
8
9
10
11
12
13
14
15
16
17
18
19
20
21
22
23
24
25
26
27
28
29
30
31
32
33
34
fio -ioengine=libaio -bs=4k -direct=1 -thread -rw=randwrite -rwmixread=70 -size=16G -filename=./fio.test -name="EBS 4K randwrite test" -iodepth=64 -runtime=60
EBS 4K randwrite test: (g=0): rw=randwrite, bs=(R) 4096B-4096B, (W) 4096B-4096B, (T) 4096B-4096B, ioengine=libaio, iodepth=64
fio-3.7
Starting 1 thread
EBS 4K randwrite test: Laying out IO file (1 file / 16384MiB)
Jobs: 1 (f=1): [w(1)][100.0%][r=0KiB/s,w=63.8MiB/s][r=0,w=16.3k IOPS][eta 00m:00s]
EBS 4K randwrite test: (groupid=0, jobs=1): err= 0: pid=258871: Tue Feb 23 14:12:23 2021
write: IOPS=18.9k, BW=74.0MiB/s (77.6MB/s)(4441MiB/60001msec)
slat (usec): min=4, max=6154, avg=48.82, stdev=56.38
clat (nsec): min=1049, max=12360k, avg=3326362.62, stdev=920683.43
lat (usec): min=68, max=12414, avg=3375.52, stdev=928.97
clat percentiles (usec):
| 1.00th=[ 1483], 5.00th=[ 1811], 10.00th=[ 2114], 20.00th=[ 2376],
| 30.00th=[ 2704], 40.00th=[ 3130], 50.00th=[ 3523], 60.00th=[ 3785],
| 70.00th=[ 3949], 80.00th=[ 4080], 90.00th=[ 4293], 95.00th=[ 4490],
| 99.00th=[ 5604], 99.50th=[ 5997], 99.90th=[ 7111], 99.95th=[ 7832],
| 99.99th=[ 9634]
bw ( KiB/s): min=61024, max=118256, per=99.98%, avg=75779.58, stdev=12747.95, samples=120
iops : min=15256, max=29564, avg=18944.88, stdev=3186.97, samples=120
lat (usec) : 2=0.01%, 100=0.01%, 250=0.01%, 500=0.01%, 750=0.02%
lat (usec) : 1000=0.06%
lat (msec) : 2=7.40%, 4=66.19%, 10=26.32%, 20=0.01%
cpu : usr=5.23%, sys=46.71%, ctx=846953, majf=0, minf=6
IO depths : 1=0.1%, 2=0.1%, 4=0.1%, 8=0.1%, 16=0.1%, 32=0.1%, >=64=100.0%
submit : 0=0.0%, 4=100.0%, 8=0.0%, 16=0.0%, 32=0.0%, 64=0.0%, >=64=0.0%
complete : 0=0.0%, 4=100.0%, 8=0.0%, 16=0.0%, 32=0.0%, 64=0.1%, >=64=0.0%
issued rwts: total=0,1136905,0,0 short=0,0,0,0 dropped=0,0,0,0
latency : target=0, window=0, percentile=100.00%, depth=64

Run status group 0 (all jobs):
WRITE: bw=74.0MiB/s (77.6MB/s), 74.0MiB/s-74.0MiB/s (77.6MB/s-77.6MB/s), io=4441MiB (4657MB), run=60001-60001msec

Disk stats (read/write):
sfdv0n1: ios=0/1821771, merge=0/7335, ticks=0/39708, in_queue=78295, util=100.00%

如上测试iops为:18944,测试期间的iostat,测试中一直有mysql在导入数据,所以测试开始前util就已经100%了,并且w/s到了13K左右

1
2
3
4
5
6
7
8
9
10
11
12
13
14
15
16
17
18
19
20
21
22
23
24
25
26
27
28
# iostat -d sfdv0n1 3 -x
Linux 3.10.0-957.el7.x86_64 (nu4d01142.sqa.nu8) 2021年02月23日 _x86_64_ (104 CPU)

Device: rrqm/s wrqm/s r/s w/s rkB/s wkB/s avgrq-sz avgqu-sz await r_await w_await svctm %util
sfdv0n1 0.00 0.18 3.45 769.17 102.83 7885.16 20.68 0.93 0.04 0.26 0.04 1.16 89.46

Device: rrqm/s wrqm/s r/s w/s rkB/s wkB/s avgrq-sz avgqu-sz await r_await w_await svctm %util
sfdv0n1 0.00 0.00 0.00 13168.67 0.00 66244.00 10.06 1.05 0.03 0.00 0.03 0.08 100.10

Device: rrqm/s wrqm/s r/s w/s rkB/s wkB/s avgrq-sz avgqu-sz await r_await w_await svctm %util
sfdv0n1 0.00 0.00 0.00 12822.67 0.00 65542.67 10.22 1.04 0.02 0.00 0.02 0.08 100.07

//增加压力
Device: rrqm/s wrqm/s r/s w/s rkB/s wkB/s avgrq-sz avgqu-sz await r_await w_await svctm %util
sfdv0n1 0.00 0.00 0.00 27348.33 0.00 214928.00 15.72 1.27 0.02 0.00 0.02 0.04 100.17

Device: rrqm/s wrqm/s r/s w/s rkB/s wkB/s avgrq-sz avgqu-sz await r_await w_await svctm %util
sfdv0n1 0.00 1.00 0.00 32661.67 0.00 271660.00 16.63 1.32 0.02 0.00 0.02 0.03 100.37

Device: rrqm/s wrqm/s r/s w/s rkB/s wkB/s avgrq-sz avgqu-sz await r_await w_await svctm %util
sfdv0n1 0.00 0.00 0.00 31645.00 0.00 265988.00 16.81 1.33 0.02 0.00 0.02 0.03 100.37

Device: rrqm/s wrqm/s r/s w/s rkB/s wkB/s avgrq-sz avgqu-sz await r_await w_await svctm %util
sfdv0n1 0.00 574.00 0.00 31961.67 0.00 271094.67 16.96 1.36 0.02 0.00 0.02 0.03 100.13

Device: rrqm/s wrqm/s r/s w/s rkB/s wkB/s avgrq-sz avgqu-sz await r_await w_await svctm %util
sfdv0n1 0.00 0.00 0.00 27656.33 0.00 224586.67 16.24 1.28 0.02 0.00 0.02 0.04 100.37

从iostat看出,测试开始前util已经100%(因为ssd,util失去参考意义),w/s 13K左右,压力跑起来后w/s能到30K,svctm、await均保持稳定

如下测试中direct=1和direct=0的write avg iops分别为42K、16K

1
2
3
4
5
6
7
8
9
10
11
12
13
14
15
16
17
18
19
20
21
22
23
24
25
26
27
28
29
30
31
32
33
34
35
36
37
38
39
40
41
42
43
44
45
46
47
48
49
50
51
52
53
54
55
56
57
58
59
60
61
62
63
64
65
66
67
68
69
70
71
72
73
74
75
76
77
78
79
80
81
82
83
84
85
86
87
88
89
90
91
92
93
94
95
# fio -ioengine=libaio -bs=4k -direct=1 -buffered=0 -thread -rw=randrw -rwmixread=70 -size=16G -filename=/data/fio.test -name="EBS 4K randwrite test" -iodepth=64 -runtime=60 
EBS 4K randwrite test: (g=0): rw=randrw, bs=(R) 4096B-4096B, (W) 4096B-4096B, (T) 4096B-4096B, ioengine=libaio, iodepth=64
fio-3.7
Starting 1 thread
Jobs: 1 (f=1): [m(1)][100.0%][r=507MiB/s,w=216MiB/s][r=130k,w=55.2k IOPS][eta 00m:00s]
EBS 4K randwrite test: (groupid=0, jobs=1): err= 0: pid=415921: Tue Feb 23 14:34:33 2021
read: IOPS=99.8k, BW=390MiB/s (409MB/s)(11.2GiB/29432msec)
slat (nsec): min=1043, max=917837, avg=4273.86, stdev=3792.17
clat (usec): min=2, max=4313, avg=459.80, stdev=239.61
lat (usec): min=4, max=4328, avg=464.16, stdev=241.81
clat percentiles (usec):
| 1.00th=[ 251], 5.00th=[ 277], 10.00th=[ 289], 20.00th=[ 310],
| 30.00th=[ 326], 40.00th=[ 343], 50.00th=[ 363], 60.00th=[ 400],
| 70.00th=[ 502], 80.00th=[ 603], 90.00th=[ 750], 95.00th=[ 881],
| 99.00th=[ 1172], 99.50th=[ 1401], 99.90th=[ 3032], 99.95th=[ 3359],
| 99.99th=[ 3785]
bw ( KiB/s): min=182520, max=574856, per=99.24%, avg=395975.64, stdev=119541.78, samples=58
iops : min=45630, max=143714, avg=98993.90, stdev=29885.42, samples=58
write: IOPS=42.8k, BW=167MiB/s (175MB/s)(4915MiB/29432msec)
slat (usec): min=3, max=263, avg= 9.34, stdev= 4.35
clat (usec): min=14, max=2057, avg=402.26, stdev=140.67
lat (usec): min=19, max=2070, avg=411.72, stdev=142.67
clat percentiles (usec):
| 1.00th=[ 237], 5.00th=[ 281], 10.00th=[ 293], 20.00th=[ 314],
| 30.00th=[ 330], 40.00th=[ 343], 50.00th=[ 359], 60.00th=[ 379],
| 70.00th=[ 404], 80.00th=[ 457], 90.00th=[ 586], 95.00th=[ 717],
| 99.00th=[ 930], 99.50th=[ 1004], 99.90th=[ 1254], 99.95th=[ 1385],
| 99.99th=[ 1532]
bw ( KiB/s): min=78104, max=244408, per=99.22%, avg=169671.52, stdev=51142.10, samples=58
iops : min=19526, max=61102, avg=42417.86, stdev=12785.51, samples=58
lat (usec) : 4=0.01%, 10=0.01%, 20=0.01%, 50=0.02%, 100=0.04%
lat (usec) : 250=1.02%, 500=73.32%, 750=17.28%, 1000=6.30%
lat (msec) : 2=1.83%, 4=0.19%, 10=0.01%
cpu : usr=15.84%, sys=83.31%, ctx=13765, majf=0, minf=7
IO depths : 1=0.1%, 2=0.1%, 4=0.1%, 8=0.1%, 16=0.1%, 32=0.1%, >=64=100.0%
submit : 0=0.0%, 4=100.0%, 8=0.0%, 16=0.0%, 32=0.0%, 64=0.0%, >=64=0.0%
complete : 0=0.0%, 4=100.0%, 8=0.0%, 16=0.0%, 32=0.0%, 64=0.1%, >=64=0.0%
issued rwts: total=2936000,1258304,0,0 short=0,0,0,0 dropped=0,0,0,0
latency : target=0, window=0, percentile=100.00%, depth=64

Run status group 0 (all jobs):
READ: bw=390MiB/s (409MB/s), 390MiB/s-390MiB/s (409MB/s-409MB/s), io=11.2GiB (12.0GB), run=29432-29432msec
WRITE: bw=167MiB/s (175MB/s), 167MiB/s-167MiB/s (175MB/s-175MB/s), io=4915MiB (5154MB), run=29432-29432msec

Disk stats (read/write):
sfdv0n1: ios=795793/1618341, merge=0/11, ticks=218710/27721, in_queue=264935, util=100.00%
[root@nu4d01142 data]#
[root@nu4d01142 data]# fio -ioengine=libaio -bs=4k -direct=0 -buffered=0 -thread -rw=randrw -rwmixread=70 -size=6G -filename=/data/fio.test -name="EBS 4K randwrite test" -iodepth=64 -runtime=60
EBS 4K randwrite test: (g=0): rw=randrw, bs=(R) 4096B-4096B, (W) 4096B-4096B, (T) 4096B-4096B, ioengine=libaio, iodepth=64
fio-3.7
Starting 1 thread
Jobs: 1 (f=1): [m(1)][100.0%][r=124MiB/s,w=53.5MiB/s][r=31.7k,w=13.7k IOPS][eta 00m:00s]
EBS 4K randwrite test: (groupid=0, jobs=1): err= 0: pid=437523: Tue Feb 23 14:37:54 2021
read: IOPS=38.6k, BW=151MiB/s (158MB/s)(4300MiB/28550msec)
slat (nsec): min=1205, max=1826.7k, avg=13253.36, stdev=17173.87
clat (nsec): min=236, max=5816.8k, avg=1135969.25, stdev=337142.34
lat (nsec): min=1977, max=5831.2k, avg=1149404.84, stdev=341232.87
clat percentiles (usec):
| 1.00th=[ 461], 5.00th=[ 627], 10.00th=[ 717], 20.00th=[ 840],
| 30.00th=[ 938], 40.00th=[ 1029], 50.00th=[ 1123], 60.00th=[ 1221],
| 70.00th=[ 1319], 80.00th=[ 1434], 90.00th=[ 1565], 95.00th=[ 1680],
| 99.00th=[ 1893], 99.50th=[ 1975], 99.90th=[ 2671], 99.95th=[ 3261],
| 99.99th=[ 3851]
bw ( KiB/s): min=119304, max=216648, per=100.00%, avg=154273.07, stdev=29925.10, samples=57
iops : min=29826, max=54162, avg=38568.25, stdev=7481.30, samples=57
write: IOPS=16.5k, BW=64.6MiB/s (67.7MB/s)(1844MiB/28550msec)
slat (usec): min=3, max=3565, avg=21.07, stdev=22.23
clat (usec): min=14, max=9983, avg=1164.21, stdev=459.66
lat (usec): min=21, max=10011, avg=1185.57, stdev=463.28
clat percentiles (usec):
| 1.00th=[ 498], 5.00th=[ 619], 10.00th=[ 709], 20.00th=[ 832],
| 30.00th=[ 930], 40.00th=[ 1020], 50.00th=[ 1123], 60.00th=[ 1237],
| 70.00th=[ 1336], 80.00th=[ 1450], 90.00th=[ 1598], 95.00th=[ 1713],
| 99.00th=[ 2311], 99.50th=[ 3851], 99.90th=[ 5932], 99.95th=[ 6456],
| 99.99th=[ 7701]
bw ( KiB/s): min=50800, max=92328, per=100.00%, avg=66128.47, stdev=12890.64, samples=57
iops : min=12700, max=23082, avg=16532.07, stdev=3222.66, samples=57
lat (nsec) : 250=0.01%, 500=0.01%, 750=0.01%, 1000=0.01%
lat (usec) : 2=0.01%, 4=0.01%, 10=0.01%, 20=0.02%, 50=0.03%
lat (usec) : 100=0.04%, 250=0.18%, 500=1.01%, 750=11.05%, 1000=25.02%
lat (msec) : 2=61.87%, 4=0.62%, 10=0.14%
cpu : usr=10.87%, sys=61.98%, ctx=218415, majf=0, minf=7
IO depths : 1=0.1%, 2=0.1%, 4=0.1%, 8=0.1%, 16=0.1%, 32=0.1%, >=64=100.0%
submit : 0=0.0%, 4=100.0%, 8=0.0%, 16=0.0%, 32=0.0%, 64=0.0%, >=64=0.0%
complete : 0=0.0%, 4=100.0%, 8=0.0%, 16=0.0%, 32=0.0%, 64=0.1%, >=64=0.0%
issued rwts: total=1100924,471940,0,0 short=0,0,0,0 dropped=0,0,0,0
latency : target=0, window=0, percentile=100.00%, depth=64

Run status group 0 (all jobs):
READ: bw=151MiB/s (158MB/s), 151MiB/s-151MiB/s (158MB/s-158MB/s), io=4300MiB (4509MB), run=28550-28550msec
WRITE: bw=64.6MiB/s (67.7MB/s), 64.6MiB/s-64.6MiB/s (67.7MB/s-67.7MB/s), io=1844MiB (1933MB), run=28550-28550msec

Disk stats (read/write):
sfdv0n1: ios=536103/822037, merge=0/1442, ticks=66507/17141, in_queue=99429, util=100.00%

SATA SSD测试数据

1
2
3
4
5
6
# cat /sys/block/sda/queue/rotational 
0
# lsblk -d -o name,rota
NAME ROTA
sda 0
sfdv0n1 0

-direct=0 -buffered=0读写iops分别为15.8K、6.8K 比ssd差了不少(都是direct=0),如果direct、buffered都是1的话,ESSD性能很差,读写iops分别为4312、1852

1
2
3
4
5
6
7
8
9
10
11
12
13
14
15
16
17
18
19
20
21
22
23
24
25
26
27
28
29
30
31
32
33
34
35
36
37
38
39
40
41
42
43
44
45
46
47
48
49
50
51
52
53
54
55
56
57
58
59
60
61
62
63
64
65
66
67
68
69
70
71
72
73
74
75
76
77
78
79
80
81
82
83
84
85
86
87
88
89
90
91
92
93
94
95
96
97
98
99
100
101
102
103
104
105
106
107
108
109
110
111
112
113
114
115
116
117
118
119
120
121
122
123
124
125
126
127
128
129
130
131
132
133
134
135
136
137
138
139
# fio -ioengine=libaio -bs=4k -direct=0 -buffered=0 -thread -rw=randrw -rwmixread=70 -size=2G -filename=/var/lib/docker/fio.test -name="EBS 4K randwrite test" -iodepth=64 -runtime=60 
EBS 4K randwrite test: (g=0): rw=randrw, bs=(R) 4096B-4096B, (W) 4096B-4096B, (T) 4096B-4096B, ioengine=libaio, iodepth=64
fio-3.7
Starting 1 thread
EBS 4K randwrite test: Laying out IO file (1 file / 2048MiB)
Jobs: 1 (f=1): [m(1)][100.0%][r=68.7MiB/s,w=29.7MiB/s][r=17.6k,w=7594 IOPS][eta 00m:00s]
EBS 4K randwrite test: (groupid=0, jobs=1): err= 0: pid=13261: Tue Feb 23 14:42:41 2021
read: IOPS=15.8k, BW=61.8MiB/s (64.8MB/s)(1432MiB/23172msec)
slat (nsec): min=1266, max=7261.0k, avg=7101.88, stdev=20655.54
clat (usec): min=167, max=27670, avg=2832.68, stdev=1786.18
lat (usec): min=175, max=27674, avg=2839.93, stdev=1784.42
clat percentiles (usec):
| 1.00th=[ 437], 5.00th=[ 668], 10.00th=[ 873], 20.00th=[ 988],
| 30.00th=[ 1401], 40.00th=[ 2442], 50.00th=[ 2835], 60.00th=[ 3195],
| 70.00th=[ 3523], 80.00th=[ 4047], 90.00th=[ 5014], 95.00th=[ 5866],
| 99.00th=[ 8160], 99.50th=[ 9372], 99.90th=[13829], 99.95th=[15008],
| 99.99th=[23725]
bw ( KiB/s): min=44183, max=149440, per=99.28%, avg=62836.17, stdev=26590.84, samples=46
iops : min=11045, max=37360, avg=15709.02, stdev=6647.72, samples=46
write: IOPS=6803, BW=26.6MiB/s (27.9MB/s)(616MiB/23172msec)
slat (nsec): min=1566, max=11474k, avg=8460.17, stdev=38221.51
clat (usec): min=77, max=24047, avg=2789.68, stdev=2042.55
lat (usec): min=80, max=24054, avg=2798.29, stdev=2040.85
clat percentiles (usec):
| 1.00th=[ 265], 5.00th=[ 433], 10.00th=[ 635], 20.00th=[ 840],
| 30.00th=[ 979], 40.00th=[ 2212], 50.00th=[ 2671], 60.00th=[ 3130],
| 70.00th=[ 3523], 80.00th=[ 4228], 90.00th=[ 5342], 95.00th=[ 6456],
| 99.00th=[ 9241], 99.50th=[10421], 99.90th=[13960], 99.95th=[15533],
| 99.99th=[23725]
bw ( KiB/s): min=18435, max=63112, per=99.26%, avg=27012.57, stdev=11299.42, samples=46
iops : min= 4608, max=15778, avg=6753.11, stdev=2824.87, samples=46
lat (usec) : 100=0.01%, 250=0.23%, 500=3.14%, 750=5.46%, 1000=15.27%
lat (msec) : 2=11.47%, 4=43.09%, 10=20.88%, 20=0.44%, 50=0.01%
cpu : usr=3.53%, sys=18.08%, ctx=47448, majf=0, minf=6
IO depths : 1=0.1%, 2=0.1%, 4=0.1%, 8=0.1%, 16=0.1%, 32=0.1%, >=64=100.0%
submit : 0=0.0%, 4=100.0%, 8=0.0%, 16=0.0%, 32=0.0%, 64=0.0%, >=64=0.0%
complete : 0=0.0%, 4=100.0%, 8=0.0%, 16=0.0%, 32=0.0%, 64=0.1%, >=64=0.0%
issued rwts: total=366638,157650,0,0 short=0,0,0,0 dropped=0,0,0,0
latency : target=0, window=0, percentile=100.00%, depth=64

Run status group 0 (all jobs):
READ: bw=61.8MiB/s (64.8MB/s), 61.8MiB/s-61.8MiB/s (64.8MB/s-64.8MB/s), io=1432MiB (1502MB), run=23172-23172msec
WRITE: bw=26.6MiB/s (27.9MB/s), 26.6MiB/s-26.6MiB/s (27.9MB/s-27.9MB/s), io=616MiB (646MB), run=23172-23172msec

Disk stats (read/write):
sda: ios=359202/155123, merge=299/377, ticks=946305/407820, in_queue=1354596, util=99.61%

# fio -ioengine=libaio -bs=4k -direct=1 -buffered=0 -thread -rw=randrw -rwmixread=70 -size=2G -filename=/var/lib/docker/fio.test -name="EBS 4K randwrite test" -iodepth=64 -runtime=60
EBS 4K randwrite test: (g=0): rw=randrw, bs=(R) 4096B-4096B, (W) 4096B-4096B, (T) 4096B-4096B, ioengine=libaio, iodepth=64
fio-3.7
Starting 1 thread
Jobs: 1 (f=1): [m(1)][95.5%][r=57.8MiB/s,w=25.7MiB/s][r=14.8k,w=6568 IOPS][eta 00m:01s]
EBS 4K randwrite test: (groupid=0, jobs=1): err= 0: pid=26167: Tue Feb 23 14:44:40 2021
read: IOPS=16.9k, BW=65.9MiB/s (69.1MB/s)(1432MiB/21730msec)
slat (nsec): min=1312, max=4454.2k, avg=8489.99, stdev=15763.97
clat (usec): min=201, max=18856, avg=2679.38, stdev=1720.02
lat (usec): min=206, max=18860, avg=2688.03, stdev=1717.19
clat percentiles (usec):
| 1.00th=[ 635], 5.00th=[ 832], 10.00th=[ 914], 20.00th=[ 971],
| 30.00th=[ 1090], 40.00th=[ 2114], 50.00th=[ 2704], 60.00th=[ 3064],
| 70.00th=[ 3392], 80.00th=[ 3851], 90.00th=[ 4817], 95.00th=[ 5735],
| 99.00th=[ 7767], 99.50th=[ 8979], 99.90th=[13698], 99.95th=[15139],
| 99.99th=[16581]
bw ( KiB/s): min=45168, max=127528, per=100.00%, avg=67625.19, stdev=26620.82, samples=43
iops : min=11292, max=31882, avg=16906.28, stdev=6655.20, samples=43
write: IOPS=7254, BW=28.3MiB/s (29.7MB/s)(616MiB/21730msec)
slat (nsec): min=1749, max=3412.2k, avg=9816.22, stdev=14501.05
clat (usec): min=97, max=23473, avg=2556.02, stdev=1980.53
lat (usec): min=107, max=23477, avg=2566.01, stdev=1977.65
clat percentiles (usec):
| 1.00th=[ 277], 5.00th=[ 486], 10.00th=[ 693], 20.00th=[ 824],
| 30.00th=[ 881], 40.00th=[ 1205], 50.00th=[ 2442], 60.00th=[ 2868],
| 70.00th=[ 3326], 80.00th=[ 3949], 90.00th=[ 5080], 95.00th=[ 6128],
| 99.00th=[ 8717], 99.50th=[10159], 99.90th=[14484], 99.95th=[15926],
| 99.99th=[18744]
bw ( KiB/s): min=19360, max=55040, per=100.00%, avg=29064.05, stdev=11373.59, samples=43
iops : min= 4840, max=13760, avg=7266.00, stdev=2843.41, samples=43
lat (usec) : 100=0.01%, 250=0.17%, 500=1.66%, 750=3.74%, 1000=22.57%
lat (msec) : 2=12.66%, 4=40.62%, 10=18.20%, 20=0.38%, 50=0.01%
cpu : usr=4.17%, sys=22.27%, ctx=14314, majf=0, minf=7
IO depths : 1=0.1%, 2=0.1%, 4=0.1%, 8=0.1%, 16=0.1%, 32=0.1%, >=64=100.0%
submit : 0=0.0%, 4=100.0%, 8=0.0%, 16=0.0%, 32=0.0%, 64=0.0%, >=64=0.0%
complete : 0=0.0%, 4=100.0%, 8=0.0%, 16=0.0%, 32=0.0%, 64=0.1%, >=64=0.0%
issued rwts: total=366638,157650,0,0 short=0,0,0,0 dropped=0,0,0,0
latency : target=0, window=0, percentile=100.00%, depth=64

Run status group 0 (all jobs):
READ: bw=65.9MiB/s (69.1MB/s), 65.9MiB/s-65.9MiB/s (69.1MB/s-69.1MB/s), io=1432MiB (1502MB), run=21730-21730msec
WRITE: bw=28.3MiB/s (29.7MB/s), 28.3MiB/s-28.3MiB/s (29.7MB/s-29.7MB/s), io=616MiB (646MB), run=21730-21730msec

Disk stats (read/write):
sda: ios=364744/157621, merge=779/473, ticks=851759/352008, in_queue=1204024, util=99.61%

# fio -ioengine=libaio -bs=4k -direct=1 -buffered=1 -thread -rw=randrw -rwmixread=70 -size=2G -filename=/var/lib/docker/fio.test -name="EBS 4K randwrite test" -iodepth=64 -runtime=60
EBS 4K randwrite test: (g=0): rw=randrw, bs=(R) 4096B-4096B, (W) 4096B-4096B, (T) 4096B-4096B, ioengine=libaio, iodepth=64
fio-3.7
Starting 1 thread
Jobs: 1 (f=1): [m(1)][100.0%][r=15.9MiB/s,w=7308KiB/s][r=4081,w=1827 IOPS][eta 00m:00s]
EBS 4K randwrite test: (groupid=0, jobs=1): err= 0: pid=31560: Tue Feb 23 14:46:10 2021
read: IOPS=4312, BW=16.8MiB/s (17.7MB/s)(1011MiB/60001msec)
slat (usec): min=63, max=14320, avg=216.76, stdev=430.61
clat (usec): min=5, max=778861, avg=10254.92, stdev=22345.40
lat (usec): min=1900, max=782277, avg=10472.16, stdev=22657.06
clat percentiles (msec):
| 1.00th=[ 6], 5.00th=[ 6], 10.00th=[ 6], 20.00th=[ 7],
| 30.00th=[ 7], 40.00th=[ 7], 50.00th=[ 7], 60.00th=[ 7],
| 70.00th=[ 8], 80.00th=[ 8], 90.00th=[ 8], 95.00th=[ 11],
| 99.00th=[ 107], 99.50th=[ 113], 99.90th=[ 132], 99.95th=[ 197],
| 99.99th=[ 760]
bw ( KiB/s): min= 168, max=29784, per=100.00%, avg=17390.92, stdev=10932.90, samples=119
iops : min= 42, max= 7446, avg=4347.71, stdev=2733.21, samples=119
write: IOPS=1852, BW=7410KiB/s (7588kB/s)(434MiB/60001msec)
slat (usec): min=3, max=666432, avg=23.59, stdev=2745.39
clat (msec): min=3, max=781, avg=10.14, stdev=20.50
lat (msec): min=3, max=781, avg=10.16, stdev=20.72
clat percentiles (msec):
| 1.00th=[ 6], 5.00th=[ 6], 10.00th=[ 6], 20.00th=[ 7],
| 30.00th=[ 7], 40.00th=[ 7], 50.00th=[ 7], 60.00th=[ 7],
| 70.00th=[ 7], 80.00th=[ 8], 90.00th=[ 8], 95.00th=[ 11],
| 99.00th=[ 107], 99.50th=[ 113], 99.90th=[ 131], 99.95th=[ 157],
| 99.99th=[ 760]
bw ( KiB/s): min= 80, max=12328, per=100.00%, avg=7469.53, stdev=4696.69, samples=119
iops : min= 20, max= 3082, avg=1867.34, stdev=1174.19, samples=119
lat (usec) : 10=0.01%
lat (msec) : 2=0.01%, 4=0.01%, 10=94.64%, 20=1.78%, 50=0.11%
lat (msec) : 100=1.80%, 250=1.63%, 500=0.01%, 750=0.02%, 1000=0.01%
cpu : usr=2.51%, sys=10.98%, ctx=260210, majf=0, minf=7
IO depths : 1=0.1%, 2=0.1%, 4=0.1%, 8=0.1%, 16=0.1%, 32=0.1%, >=64=100.0%
submit : 0=0.0%, 4=100.0%, 8=0.0%, 16=0.0%, 32=0.0%, 64=0.0%, >=64=0.0%
complete : 0=0.0%, 4=100.0%, 8=0.0%, 16=0.0%, 32=0.0%, 64=0.1%, >=64=0.0%
issued rwts: total=258768,111147,0,0 short=0,0,0,0 dropped=0,0,0,0
latency : target=0, window=0, percentile=100.00%, depth=64

Run status group 0 (all jobs):
READ: bw=16.8MiB/s (17.7MB/s), 16.8MiB/s-16.8MiB/s (17.7MB/s-17.7MB/s), io=1011MiB (1060MB), run=60001-60001msec
WRITE: bw=7410KiB/s (7588kB/s), 7410KiB/s-7410KiB/s (7588kB/s-7588kB/s), io=434MiB (455MB), run=60001-60001msec

Disk stats (read/write):
sda: ios=258717/89376, merge=0/735, ticks=52540/564186, in_queue=616999, util=90.07%

ESSD磁盘测试数据

这是一块虚拟的阿里云网络盘,不能算完整意义的SSD(承诺IOPS 4200),数据仅供参考,磁盘概况:

1
2
3
4
5
6
$df -lh
Filesystem Size Used Avail Use% Mounted on
/dev/vda1 99G 30G 65G 32% /

$cat /sys/block/vda/queue/rotational
1

测试数据:

1
2
3
4
5
6
7
8
9
10
11
12
13
14
15
16
17
18
19
20
21
22
23
24
25
26
27
28
29
30
31
32
33
34
35
36
37
38
39
40
41
42
43
44
45
46
47
48
49
50
51
52
53
54
55
56
57
58
59
60
61
62
63
64
65
66
67
68
69
70
71
72
73
74
75
76
77
78
79
80
81
82
83
84
85
86
87
88
89
90
91
92
93
94
95
96
97
98
99
100
101
102
103
104
105
106
107
108
109
110
111
112
113
114
115
116
117
118
119
120
121
122
123
124
125
126
127
128
129
130
131
132
133
134
135
136
137
138
139
140
141
142
143
144
145
146
147
148
149
150
151
152
153
154
155
156
157
158
159
160
161
162
163
164
165
166
167
168
169
170
171
172
173
174
175
176
177
178
179
180
181
182
183
184
185
186
187
188
$fio -ioengine=libaio -bs=4k -direct=1 -buffered=1  -thread -rw=randrw  -size=4G -filename=/home/admin/fio.test -name="EBS 4K randwrite test" -iodepth=64 -runtime=60
EBS 4K randwrite test: (g=0): rw=randrw, bs=(R) 4096B-4096B, (W) 4096B-4096B, (T) 4096B-4096B, ioengine=libaio, iodepth=64
fio-3.1
Starting 1 thread
Jobs: 1 (f=1): [m(1)][100.0%][r=10.8MiB/s,w=11.2MiB/s][r=2757,w=2876 IOPS][eta 00m:00s]
EBS 4K randwrite test: (groupid=0, jobs=1): err= 0: pid=25641: Tue Feb 23 16:35:19 2021
read: IOPS=2136, BW=8545KiB/s (8750kB/s)(501MiB/60001msec)
slat (usec): min=190, max=830992, avg=457.20, stdev=3088.80
clat (nsec): min=1792, max=1721.3M, avg=14657528.60, stdev=63188988.75
lat (usec): min=344, max=1751.1k, avg=15115.20, stdev=65165.80
clat percentiles (msec):
| 1.00th=[ 8], 5.00th=[ 9], 10.00th=[ 9], 20.00th=[ 10],
| 30.00th=[ 10], 40.00th=[ 11], 50.00th=[ 11], 60.00th=[ 11],
| 70.00th=[ 12], 80.00th=[ 12], 90.00th=[ 13], 95.00th=[ 14],
| 99.00th=[ 17], 99.50th=[ 53], 99.90th=[ 1028], 99.95th=[ 1167],
| 99.99th=[ 1653]
bw ( KiB/s): min= 56, max=12648, per=100.00%, avg=8598.92, stdev=5289.40, samples=118
iops : min= 14, max= 3162, avg=2149.73, stdev=1322.35, samples=118
write: IOPS=2137, BW=8548KiB/s (8753kB/s)(501MiB/60001msec)
slat (usec): min=2, max=181, avg= 6.67, stdev= 7.22
clat (usec): min=628, max=1721.1k, avg=14825.32, stdev=65017.66
lat (usec): min=636, max=1721.1k, avg=14832.10, stdev=65018.10
clat percentiles (msec):
| 1.00th=[ 8], 5.00th=[ 9], 10.00th=[ 9], 20.00th=[ 10],
| 30.00th=[ 10], 40.00th=[ 11], 50.00th=[ 11], 60.00th=[ 11],
| 70.00th=[ 12], 80.00th=[ 12], 90.00th=[ 13], 95.00th=[ 14],
| 99.00th=[ 17], 99.50th=[ 53], 99.90th=[ 1045], 99.95th=[ 1200],
| 99.99th=[ 1687]
bw ( KiB/s): min= 72, max=13304, per=100.00%, avg=8602.99, stdev=5296.31, samples=118
iops : min= 18, max= 3326, avg=2150.75, stdev=1324.08, samples=118
lat (usec) : 2=0.01%, 500=0.01%, 750=0.01%
lat (msec) : 2=0.01%, 4=0.01%, 10=37.85%, 20=61.53%, 50=0.10%
lat (msec) : 100=0.06%, 250=0.03%, 500=0.01%, 750=0.03%, 1000=0.25%
lat (msec) : 2000=0.14%
cpu : usr=0.70%, sys=4.01%, ctx=135029, majf=0, minf=4
IO depths : 1=0.1%, 2=0.1%, 4=0.1%, 8=0.1%, 16=0.1%, 32=0.1%, >=64=100.0%
submit : 0=0.0%, 4=100.0%, 8=0.0%, 16=0.0%, 32=0.0%, 64=0.0%, >=64=0.0%
complete : 0=0.0%, 4=100.0%, 8=0.0%, 16=0.0%, 32=0.0%, 64=0.1%, >=64=0.0%
issued rwt: total=128180,128223,0, short=0,0,0, dropped=0,0,0
latency : target=0, window=0, percentile=100.00%, depth=64

Run status group 0 (all jobs):
READ: bw=8545KiB/s (8750kB/s), 8545KiB/s-8545KiB/s (8750kB/s-8750kB/s), io=501MiB (525MB), run=60001-60001msec
WRITE: bw=8548KiB/s (8753kB/s), 8548KiB/s-8548KiB/s (8753kB/s-8753kB/s), io=501MiB (525MB), run=60001-60001msec

Disk stats (read/write):
vda: ios=127922/87337, merge=0/237, ticks=55122/4269885, in_queue=2209125, util=94.29%

$fio -ioengine=libaio -bs=4k -direct=1 -buffered=0 -thread -rw=randrw -size=4G -filename=/home/admin/fio.test -name="EBS 4K randwrite test" -iodepth=64 -runtime=60
EBS 4K randwrite test: (g=0): rw=randrw, bs=(R) 4096B-4096B, (W) 4096B-4096B, (T) 4096B-4096B, ioengine=libaio, iodepth=64
fio-3.1
Starting 1 thread
Jobs: 1 (f=1): [m(1)][100.0%][r=9680KiB/s,w=9712KiB/s][r=2420,w=2428 IOPS][eta 00m:00s]
EBS 4K randwrite test: (groupid=0, jobs=1): err= 0: pid=25375: Tue Feb 23 16:33:03 2021
read: IOPS=2462, BW=9849KiB/s (10.1MB/s)(577MiB/60011msec)
slat (nsec): min=1558, max=10663k, avg=5900.28, stdev=46286.64
clat (usec): min=290, max=93493, avg=13054.57, stdev=4301.89
lat (usec): min=332, max=93497, avg=13060.60, stdev=4301.68
clat percentiles (usec):
| 1.00th=[ 1844], 5.00th=[10159], 10.00th=[10290], 20.00th=[10421],
| 30.00th=[10552], 40.00th=[10552], 50.00th=[10683], 60.00th=[10814],
| 70.00th=[18482], 80.00th=[19006], 90.00th=[19006], 95.00th=[19268],
| 99.00th=[19530], 99.50th=[19792], 99.90th=[29492], 99.95th=[30278],
| 99.99th=[43779]
bw ( KiB/s): min= 9128, max=30392, per=100.00%, avg=9850.12, stdev=1902.00, samples=120
iops : min= 2282, max= 7598, avg=2462.52, stdev=475.50, samples=120
write: IOPS=2465, BW=9864KiB/s (10.1MB/s)(578MiB/60011msec)
slat (usec): min=2, max=10586, avg= 6.92, stdev=67.34
clat (usec): min=240, max=69922, avg=12902.33, stdev=4307.92
lat (usec): min=244, max=69927, avg=12909.37, stdev=4307.03
clat percentiles (usec):
| 1.00th=[ 1729], 5.00th=[10159], 10.00th=[10290], 20.00th=[10290],
| 30.00th=[10421], 40.00th=[10421], 50.00th=[10552], 60.00th=[10683],
| 70.00th=[18220], 80.00th=[18744], 90.00th=[19006], 95.00th=[19006],
| 99.00th=[19268], 99.50th=[19530], 99.90th=[21103], 99.95th=[35390],
| 99.99th=[50594]
bw ( KiB/s): min= 8496, max=31352, per=100.00%, avg=9862.92, stdev=1991.48, samples=120
iops : min= 2124, max= 7838, avg=2465.72, stdev=497.87, samples=120
lat (usec) : 250=0.01%, 500=0.03%, 750=0.02%, 1000=0.02%
lat (msec) : 2=1.70%, 4=0.41%, 10=1.25%, 20=96.22%, 50=0.34%
lat (msec) : 100=0.01%
cpu : usr=0.89%, sys=4.09%, ctx=206337, majf=0, minf=4
IO depths : 1=0.1%, 2=0.1%, 4=0.1%, 8=0.1%, 16=0.1%, 32=0.1%, >=64=100.0%
submit : 0=0.0%, 4=100.0%, 8=0.0%, 16=0.0%, 32=0.0%, 64=0.0%, >=64=0.0%
complete : 0=0.0%, 4=100.0%, 8=0.0%, 16=0.0%, 32=0.0%, 64=0.1%, >=64=0.0%
issued rwt: total=147768,147981,0, short=0,0,0, dropped=0,0,0
latency : target=0, window=0, percentile=100.00%, depth=64

Run status group 0 (all jobs):
READ: bw=9849KiB/s (10.1MB/s), 9849KiB/s-9849KiB/s (10.1MB/s-10.1MB/s), io=577MiB (605MB), run=60011-60011msec
WRITE: bw=9864KiB/s (10.1MB/s), 9864KiB/s-9864KiB/s (10.1MB/s-10.1MB/s), io=578MiB (606MB), run=60011-60011msec

Disk stats (read/write):
vda: ios=147515/148154, merge=0/231, ticks=1922378/1915751, in_queue=3780605, util=98.46%

$fio -ioengine=libaio -bs=4k -direct=0 -buffered=1 -thread -rw=randrw -size=4G -filename=/home/admin/fio.test -name="EBS 4K randwrite test" -iodepth=64 -runtime=60
EBS 4K randwrite test: (g=0): rw=randrw, bs=(R) 4096B-4096B, (W) 4096B-4096B, (T) 4096B-4096B, ioengine=libaio, iodepth=64
fio-3.1
Starting 1 thread
Jobs: 1 (f=1): [m(1)][100.0%][r=132KiB/s,w=148KiB/s][r=33,w=37 IOPS][eta 00m:00s]
EBS 4K randwrite test: (groupid=0, jobs=1): err= 0: pid=25892: Tue Feb 23 16:37:41 2021
read: IOPS=1987, BW=7949KiB/s (8140kB/s)(467MiB/60150msec)
slat (usec): min=192, max=599873, avg=479.26, stdev=2917.52
clat (usec): min=15, max=1975.6k, avg=16004.22, stdev=76024.60
lat (msec): min=5, max=2005, avg=16.48, stdev=78.00
clat percentiles (msec):
| 1.00th=[ 8], 5.00th=[ 9], 10.00th=[ 9], 20.00th=[ 10],
| 30.00th=[ 10], 40.00th=[ 11], 50.00th=[ 11], 60.00th=[ 11],
| 70.00th=[ 12], 80.00th=[ 12], 90.00th=[ 13], 95.00th=[ 14],
| 99.00th=[ 19], 99.50th=[ 317], 99.90th=[ 1133], 99.95th=[ 1435],
| 99.99th=[ 1871]
bw ( KiB/s): min= 32, max=12672, per=100.00%, avg=8034.08, stdev=5399.63, samples=119
iops : min= 8, max= 3168, avg=2008.52, stdev=1349.91, samples=119
write: IOPS=1984, BW=7937KiB/s (8127kB/s)(466MiB/60150msec)
slat (usec): min=2, max=839634, avg=18.39, stdev=2747.10
clat (msec): min=5, max=1975, avg=15.64, stdev=73.06
lat (msec): min=5, max=1975, avg=15.66, stdev=73.28
clat percentiles (msec):
| 1.00th=[ 8], 5.00th=[ 9], 10.00th=[ 9], 20.00th=[ 10],
| 30.00th=[ 10], 40.00th=[ 11], 50.00th=[ 11], 60.00th=[ 11],
| 70.00th=[ 12], 80.00th=[ 12], 90.00th=[ 13], 95.00th=[ 14],
| 99.00th=[ 18], 99.50th=[ 153], 99.90th=[ 1116], 99.95th=[ 1435],
| 99.99th=[ 1921]
bw ( KiB/s): min= 24, max=13160, per=100.00%, avg=8021.18, stdev=5405.12, samples=119
iops : min= 6, max= 3290, avg=2005.29, stdev=1351.28, samples=119
lat (usec) : 20=0.01%
lat (msec) : 10=36.51%, 20=62.63%, 50=0.21%, 100=0.12%, 250=0.05%
lat (msec) : 500=0.02%, 750=0.02%, 1000=0.19%, 2000=0.26%
cpu : usr=0.62%, sys=4.04%, ctx=125974, majf=0, minf=3
IO depths : 1=0.1%, 2=0.1%, 4=0.1%, 8=0.1%, 16=0.1%, 32=0.1%, >=64=100.0%
submit : 0=0.0%, 4=100.0%, 8=0.0%, 16=0.0%, 32=0.0%, 64=0.0%, >=64=0.0%
complete : 0=0.0%, 4=100.0%, 8=0.0%, 16=0.0%, 32=0.0%, 64=0.1%, >=64=0.0%
issued rwt: total=119533,119347,0, short=0,0,0, dropped=0,0,0
latency : target=0, window=0, percentile=100.00%, depth=64

Run status group 0 (all jobs):
READ: bw=7949KiB/s (8140kB/s), 7949KiB/s-7949KiB/s (8140kB/s-8140kB/s), io=467MiB (490MB), run=60150-60150msec
WRITE: bw=7937KiB/s (8127kB/s), 7937KiB/s-7937KiB/s (8127kB/s-8127kB/s), io=466MiB (489MB), run=60150-60150msec

Disk stats (read/write):
vda: ios=119533/108186, merge=0/214, ticks=54093/4937255, in_queue=2525052, util=93.99%

$fio -ioengine=libaio -bs=4k -direct=0 -buffered=0 -thread -rw=randrw -size=4G -filename=/home/admin/fio.test -name="EBS 4K randwrite test" -iodepth=64 -runtime=60
EBS 4K randwrite test: (g=0): rw=randrw, bs=(R) 4096B-4096B, (W) 4096B-4096B, (T) 4096B-4096B, ioengine=libaio, iodepth=64
fio-3.1
Starting 1 thread
Jobs: 1 (f=1): [m(1)][100.0%][r=9644KiB/s,w=9792KiB/s][r=2411,w=2448 IOPS][eta 00m:00s]
EBS 4K randwrite test: (groupid=0, jobs=1): err= 0: pid=26139: Tue Feb 23 16:39:43 2021
read: IOPS=2455, BW=9823KiB/s (10.1MB/s)(576MiB/60015msec)
slat (nsec): min=1619, max=18282k, avg=5882.81, stdev=71214.52
clat (usec): min=281, max=64630, avg=13055.68, stdev=4233.17
lat (usec): min=323, max=64636, avg=13061.69, stdev=4232.79
clat percentiles (usec):
| 1.00th=[ 2040], 5.00th=[10290], 10.00th=[10421], 20.00th=[10421],
| 30.00th=[10552], 40.00th=[10552], 50.00th=[10683], 60.00th=[10814],
| 70.00th=[18220], 80.00th=[19006], 90.00th=[19006], 95.00th=[19268],
| 99.00th=[19530], 99.50th=[20055], 99.90th=[28967], 99.95th=[29754],
| 99.99th=[30540]
bw ( KiB/s): min= 8776, max=27648, per=100.00%, avg=9824.29, stdev=1655.78, samples=120
iops : min= 2194, max= 6912, avg=2456.05, stdev=413.95, samples=120
write: IOPS=2458, BW=9835KiB/s (10.1MB/s)(576MiB/60015msec)
slat (usec): min=2, max=10681, avg= 6.79, stdev=71.30
clat (usec): min=221, max=70411, avg=12909.50, stdev=4312.40
lat (usec): min=225, max=70414, avg=12916.40, stdev=4312.05
clat percentiles (usec):
| 1.00th=[ 1909], 5.00th=[10159], 10.00th=[10290], 20.00th=[10290],
| 30.00th=[10421], 40.00th=[10421], 50.00th=[10552], 60.00th=[10683],
| 70.00th=[18220], 80.00th=[18744], 90.00th=[19006], 95.00th=[19006],
| 99.00th=[19268], 99.50th=[19530], 99.90th=[28705], 99.95th=[40109],
| 99.99th=[60031]
bw ( KiB/s): min= 8568, max=28544, per=100.00%, avg=9836.03, stdev=1737.29, samples=120
iops : min= 2142, max= 7136, avg=2458.98, stdev=434.32, samples=120
lat (usec) : 250=0.01%, 500=0.03%, 750=0.02%, 1000=0.02%
lat (msec) : 2=1.03%, 4=1.10%, 10=0.98%, 20=96.43%, 50=0.38%
lat (msec) : 100=0.01%
cpu : usr=0.82%, sys=4.32%, ctx=212008, majf=0, minf=4
IO depths : 1=0.1%, 2=0.1%, 4=0.1%, 8=0.1%, 16=0.1%, 32=0.1%, >=64=100.0%
submit : 0=0.0%, 4=100.0%, 8=0.0%, 16=0.0%, 32=0.0%, 64=0.0%, >=64=0.0%
complete : 0=0.0%, 4=100.0%, 8=0.0%, 16=0.0%, 32=0.0%, 64=0.1%, >=64=0.0%
issued rwt: total=147386,147564,0, short=0,0,0, dropped=0,0,0
latency : target=0, window=0, percentile=100.00%, depth=64

Run status group 0 (all jobs):
READ: bw=9823KiB/s (10.1MB/s), 9823KiB/s-9823KiB/s (10.1MB/s-10.1MB/s), io=576MiB (604MB), run=60015-60015msec
WRITE: bw=9835KiB/s (10.1MB/s), 9835KiB/s-9835KiB/s (10.1MB/s-10.1MB/s), io=576MiB (604MB), run=60015-60015msec

Disk stats (read/write):
vda: ios=147097/147865, merge=0/241, ticks=1916703/1915836, in_queue=3791443, util=98.68%

各类型云盘的性能比较如下表所示。

性能类别 ESSD AutoPL云盘(邀测) ESSD PL-X云盘(邀测) ESSD云盘 PL3 ESSD云盘 PL0 ESSD云盘 PL1 ESSD云盘 PL0 SSD云盘 高效云盘 普通云盘
单盘容量范围(GiB) 40~32,768 40~32,768 1261~32,768 461~32,768 20~32,768 40~32,768 20~32,768 20~32,768 5~2,000
最大IOPS 100,000 3,000,000 1,000,000 100,000 50,000 10,000 25,000 5,000 数百
最大吞吐量(MB/s) 1,131 12,288 4,000 750 350 180 300 140 30~40
单盘IOPS性能计算公式 min{1,800+50*容量, 50,000} 预配置IOPS min{1,800+50*容量, 1,000,000} min{1,800+50*容量, 100,000} min{1,800+50*容量, 50,000} min{ 1,800+12*容量, 10,000 } min{1,800+30*容量, 25,000} min{1,800+8*容量, 5,000}
单盘吞吐量性能计算公式(MB/s) min{120+0.5*容量, 350} 4 KB*预配置IOPS/1024 min{120+0.5*容量, 4,000} min{120+0.5*容量, 750} min{120+0.5*容量, 350} min{100+0.25*容量, 180} min{120+0.5*容量, 300} min{100+0.15*容量, 140}
单路随机写平均时延(ms),Block Size=4K 0.2 0.03 0.2 0.2 0.2 0.3~0.5 0.5~2 1~3 5~10
API参数取值 cloud_auto cloud_plx cloud_essd cloud_essd cloud_essd cloud_essd cloud_ssd cloud_efficiency cloud

ESSD(PL3) 测试

阿里云ESSD(Enhanced SSD)云盘结合25 GE网络和RDMA技术,为您提供单盘高达100万的随机读写能力和单路低时延性能。本文介绍了ESSD云盘的性能级别、适用场景及性能上限,提供了选择不同ESSD云盘性能级别时的参考信息。

测试结论:读能力非常差(不到写的10%),写能力能符合官方标称的IOPS,但是写IOPS抖动极大,会长时间IOPS 跌0,但最终IOPS还是会达到目标IOPS。

测试命令

1
fio -ioengine=libaio -bs=4k -buffered=1 -thread -rw=randwrite -rwmixread=70 -size=160G -filename=./fio.test -name="EBS 4K randwrite test" -iodepth=64 -runtime=60

ESSD 是aliyun 购买的 ESSD PL3,LVM是海光物理机下两块本地NVMe SSD做的LVM,测试基于ext4文件系统,阿里云官方提供ESSD的 IOPS 性能数据是裸盘(不含文件系统的)

本地LVM ESSD PL3 PL2+倚天
fio -ioengine=libaio -bs=4k -buffered=1 read bw=36636KB/s, iops=9159
nvme0n1:util=42.31%
nvme1n1: util=41.63%
IOPS=3647, BW=14.2MiB/s
util=88.08%
IOPS=458k, BW=1789MiB/s
util=96.69%
fio -ioengine=libaio -bs=4k -buffered=1 randwrite bw=383626KB/s, iops=95906
nvme0n1:util=37.16%
nvme1n1: util=33.58%
IOPS=104k, BW=406MiB/s
util=39.06%
IOPS=37.4k, BW=146MiB/s
util=94.03%
fio -ioengine=libaio -bs=4k -buffered=1 randrw rwmixread=70 write: bw=12765KB/s, iops=3191
read : bw=29766KB/s, iops=7441
nvme0n1:util=35.18%
nvme1n1: util=35.04%
write:IOPS=1701, BW=6808KiB/s
read: IOPS=3962, BW=15.5MiB/s
nvme7n1: util=99.35%
write:IOPS=1826, BW=7306KiB/s
read:IOPS=4254, BW=16.6MiB/s
util=98.99%
fio -ioengine=libaio -bs=4k -direct=1 -buffered=0 read bw=67938KB/s, iops=16984
nvme0n1:util=43.17%
nvme1n1: util=39.18%
IOPS=4687, BW=18.3MiB/s
util=99.75%
read: IOPS=145k, BW=565MiB/s
util=98.88%
fio -ioengine=libaio -bs=4k -direct=1 -buffered=0 write bw=160775KB/s, iops=40193
nvme0n1:util=28.66%
nvme1n1: util=21.67%
IOPS=7153, BW=27.9MiB/s
util=99.85%
write: IOPS=98.0k, BW=387MiB/s
util=99.88%
fio -ioengine=libaio -bs=4k -direct=1 -buffered=0 randrw rwmixread=70 write: bw=23087KB/s, iops=5771
read : bw=53849KB/s, iops=13462
write:IOPS=1511, BW=6045KiB/s
read: IOPS=3534, BW=13.8MiB/s
write: IOPS=29.4k, BW=115MiB/s
read: IOPS=68.6k, BW=268MiB/s
util=99.88%

结论:

  • ESSD只要有随机读性能就很差,纯读是本地盘(LVM)的40%,纯写和本地盘差不多
  • direct 读是本地盘的四分之一
  • direct 写是本地盘的六分之一,写16K Page差距缩小到五分之一(5749/25817)
  • intel direct 写本地intel SSDPE2KX040T8 iops=55826(比海光好40%,海光是memblaze)
  • ESSD 带 buffer 读写抖动很大
  • ESSD 出现过多次卡死,表现就是磁盘不响应任何操作,大概N分钟后恢复,原因未知

PL3单盘IOPS性能计算公式 min{1800+50*容量, 1000000}

1
2
3
4
5
6
7
8
9
10
11
12
13
14
15
16
17
18
19
20
21
22
23
24
25
26
27
28
29
30
31
32
33
34
35
36
37
38
39
40
41
42
43
44
45
46
47
48
49
50
51
52
53
54
55
56
57
58
59
60
61
62
63
64
65
66
67
68
69
70
71
72
73
74
75
76
77
78
79
80
81
82
83
84
85
86
87
88
89
90
91
92
93
94
95
96
97
98
99
100
101
102
103
104
105
106
107
108
109
110
111
112
113
114
115
116
117
118
119
120
121
122
123
124
125
126
127
128
129
130
131
132
133
134
135
136
137
138
139
140
141
142
143
144
145
146
147
148
149
150
151
152
153
154
155
156
157
158
159
160
161
162
163
164
165
166
167
168
169
170
171
172
173
174
175
176
177
178
179
180
181
182
183
184
185
186
187
188
189
190
191
192
193
194
195
196
197
198
199
200
201
202
203
204
205
206
207
208
209
210
211
212
213
214
215
216
217
218
219
220
221
222
223
224
[essd_pl3]# fio -ioengine=libaio -bs=4k -direct=1 -buffered=1 -thread -rw=randwrite -rwmixread=70 -size=160G -filename=./fio.test -name="EBS 4K randwrite test" -iodepth=64 -runtime=60
EBS 4K randwrite test: (g=0): rw=randwrite, bs=(R) 4096B-4096B, (W) 4096B-4096B, (T) 4096B-4096B, ioengine=libaio, iodepth=64
fio-3.7
Starting 1 thread
Jobs: 1 (f=1): [w(1)][100.0%][r=0KiB/s,w=566MiB/s][r=0,w=145k IOPS][eta 00m:00s]
EBS 4K randwrite test: (groupid=0, jobs=1): err= 0: pid=2416234: Thu Apr 7 17:03:07 2022
write: IOPS=96.2k, BW=376MiB/s (394MB/s)(22.0GiB/60000msec)
slat (usec): min=2, max=530984, avg= 8.27, stdev=1104.96
clat (usec): min=2, max=944103, avg=599.25, stdev=9230.93
lat (usec): min=7, max=944111, avg=607.60, stdev=9308.81
clat percentiles (usec):
| 1.00th=[ 392], 5.00th=[ 400], 10.00th=[ 404], 20.00th=[ 408],
| 30.00th=[ 412], 40.00th=[ 416], 50.00th=[ 420], 60.00th=[ 424],
| 70.00th=[ 433], 80.00th=[ 441], 90.00th=[ 457], 95.00th=[ 482],
| 99.00th=[ 627], 99.50th=[ 766], 99.90th=[ 1795], 99.95th=[ 4228],
| 99.99th=[488637]
bw ( KiB/s): min= 168, max=609232, per=100.00%, avg=422254.17, stdev=257181.75, samples=108
iops : min= 42, max=152308, avg=105563.63, stdev=64295.48, samples=108
lat (usec) : 4=0.01%, 10=0.01%, 50=0.01%, 100=0.01%, 250=0.01%
lat (usec) : 500=96.35%, 750=3.11%, 1000=0.26%
lat (msec) : 2=0.19%, 4=0.03%, 10=0.02%, 250=0.01%, 500=0.03%
lat (msec) : 750=0.01%, 1000=0.01%
cpu : usr=13.56%, sys=60.78%, ctx=1455, majf=0, minf=9743
IO depths : 1=0.1%, 2=0.1%, 4=0.1%, 8=0.1%, 16=0.1%, 32=0.1%, >=64=100.0%
submit : 0=0.0%, 4=100.0%, 8=0.0%, 16=0.0%, 32=0.0%, 64=0.0%, >=64=0.0%
complete : 0=0.0%, 4=100.0%, 8=0.0%, 16=0.0%, 32=0.0%, 64=0.1%, >=64=0.0%
issued rwts: total=0,5771972,0,0 short=0,0,0,0 dropped=0,0,0,0
latency : target=0, window=0, percentile=100.00%, depth=64

Run status group 0 (all jobs):
WRITE: bw=376MiB/s (394MB/s), 376MiB/s-376MiB/s (394MB/s-394MB/s), io=22.0GiB (23.6GB), run=60000-60000msec

Disk stats (read/write):
vdb: ios=0/1463799, merge=0/7373, ticks=0/2011879, in_queue=2011879, util=27.85%

[essd_pl3]# fio -ioengine=libaio -bs=4k -direct=1 -buffered=1 -thread -rw=randread -rwmixread=70 -size=160G -filename=./fio.test -name="EBS 4K randwrite test" -iodepth=64 -runtime=60
EBS 4K randwrite test: (g=0): rw=randread, bs=(R) 4096B-4096B, (W) 4096B-4096B, (T) 4096B-4096B, ioengine=libaio, iodepth=64
fio-3.7
Starting 1 thread
Jobs: 1 (f=1): [r(1)][100.0%][r=15.9MiB/s,w=0KiB/s][r=4058,w=0 IOPS][eta 00m:00s]
EBS 4K randwrite test: (groupid=0, jobs=1): err= 0: pid=2441598: Thu Apr 7 17:05:10 2022
read: IOPS=3647, BW=14.2MiB/s (14.9MB/s)(855MiB/60001msec)
slat (usec): min=183, max=10119, avg=239.01, stdev=110.20
clat (usec): min=2, max=54577, avg=15170.17, stdev=1324.10
lat (usec): min=237, max=55110, avg=15409.34, stdev=1338.09
clat percentiles (usec):
| 1.00th=[13960], 5.00th=[14091], 10.00th=[14222], 20.00th=[14484],
| 30.00th=[14615], 40.00th=[14746], 50.00th=[14877], 60.00th=[15139],
| 70.00th=[15270], 80.00th=[15533], 90.00th=[16057], 95.00th=[16712],
| 99.00th=[20317], 99.50th=[22152], 99.90th=[26346], 99.95th=[30802],
| 99.99th=[52691]
bw ( KiB/s): min= 6000, max=17272, per=100.00%, avg=16511.28, stdev=1140.64, samples=105
iops : min= 1500, max= 4318, avg=4127.81, stdev=285.16, samples=105
lat (usec) : 4=0.01%, 250=0.01%, 500=0.01%, 750=0.01%, 1000=0.01%
lat (msec) : 2=0.01%, 4=0.01%, 10=0.01%, 20=98.91%, 50=1.05%
lat (msec) : 100=0.02%
cpu : usr=0.18%, sys=17.18%, ctx=219041, majf=0, minf=4215
IO depths : 1=0.1%, 2=0.1%, 4=0.1%, 8=0.1%, 16=0.1%, 32=0.1%, >=64=100.0%
submit : 0=0.0%, 4=100.0%, 8=0.0%, 16=0.0%, 32=0.0%, 64=0.0%, >=64=0.0%
complete : 0=0.0%, 4=100.0%, 8=0.0%, 16=0.0%, 32=0.0%, 64=0.1%, >=64=0.0%
issued rwts: total=218835,0,0,0 short=0,0,0,0 dropped=0,0,0,0
latency : target=0, window=0, percentile=100.00%, depth=64

Run status group 0 (all jobs):
READ: bw=14.2MiB/s (14.9MB/s), 14.2MiB/s-14.2MiB/s (14.9MB/s-14.9MB/s), io=855MiB (896MB), run=60001-60001msec

Disk stats (read/write):
vdb: ios=218343/7992, merge=0/8876, ticks=50566/3749, in_queue=54315, util=88.08%

[essd_pl3]# fio -ioengine=libaio -bs=4k -direct=1 -buffered=1 -thread -rw=randrw -rwmixread=70 -size=160G -filename=./fio.test -name="EBS 4K randwrite test" -iodepth=64 -runtime=60
EBS 4K randwrite test: (g=0): rw=randrw, bs=(R) 4096B-4096B, (W) 4096B-4096B, (T) 4096B-4096B, ioengine=libaio, iodepth=64
fio-3.7
Starting 1 thread
Jobs: 1 (f=1): [m(1)][100.0%][r=15.7MiB/s,w=7031KiB/s][r=4007,w=1757 IOPS][eta 00m:00s]
EBS 4K randwrite test: (groupid=0, jobs=1): err= 0: pid=2641414: Thu Apr 7 17:21:10 2022
read: IOPS=3962, BW=15.5MiB/s (16.2MB/s)(929MiB/60001msec)
slat (usec): min=182, max=7194, avg=243.23, stdev=116.87
clat (usec): min=2, max=235715, avg=11020.01, stdev=3366.61
lat (usec): min=253, max=235991, avg=11263.40, stdev=3375.49
clat percentiles (msec):
| 1.00th=[ 9], 5.00th=[ 10], 10.00th=[ 10], 20.00th=[ 11],
| 30.00th=[ 11], 40.00th=[ 11], 50.00th=[ 11], 60.00th=[ 12],
| 70.00th=[ 12], 80.00th=[ 12], 90.00th=[ 13], 95.00th=[ 14],
| 99.00th=[ 16], 99.50th=[ 18], 99.90th=[ 31], 99.95th=[ 36],
| 99.99th=[ 234]
bw ( KiB/s): min=10808, max=17016, per=100.00%, avg=15977.89, stdev=895.35, samples=118
iops : min= 2702, max= 4254, avg=3994.47, stdev=223.85, samples=118
write: IOPS=1701, BW=6808KiB/s (6971kB/s)(399MiB/60001msec)
slat (usec): min=3, max=221631, avg=10.16, stdev=693.59
clat (usec): min=486, max=235772, avg=11029.42, stdev=3590.93
lat (usec): min=493, max=235780, avg=11039.67, stdev=3659.04
clat percentiles (msec):
| 1.00th=[ 9], 5.00th=[ 10], 10.00th=[ 10], 20.00th=[ 11],
| 30.00th=[ 11], 40.00th=[ 11], 50.00th=[ 11], 60.00th=[ 12],
| 70.00th=[ 12], 80.00th=[ 12], 90.00th=[ 13], 95.00th=[ 14],
| 99.00th=[ 16], 99.50th=[ 18], 99.90th=[ 31], 99.95th=[ 37],
| 99.99th=[ 234]
bw ( KiB/s): min= 4480, max= 7728, per=100.00%, avg=6862.60, stdev=475.79, samples=118
iops : min= 1120, max= 1932, avg=1715.64, stdev=118.97, samples=118
lat (usec) : 4=0.01%, 500=0.01%, 750=0.01%
lat (msec) : 2=0.01%, 4=0.01%, 10=20.77%, 20=78.89%, 50=0.31%
lat (msec) : 100=0.01%, 250=0.02%
cpu : usr=0.65%, sys=7.20%, ctx=239089, majf=0, minf=8292
IO depths : 1=0.1%, 2=0.1%, 4=0.1%, 8=0.1%, 16=0.1%, 32=0.1%, >=64=100.0%
submit : 0=0.0%, 4=100.0%, 8=0.0%, 16=0.0%, 32=0.0%, 64=0.0%, >=64=0.0%
complete : 0=0.0%, 4=100.0%, 8=0.0%, 16=0.0%, 32=0.0%, 64=0.1%, >=64=0.0%
issued rwts: total=237743,102115,0,0 short=0,0,0,0 dropped=0,0,0,0
latency : target=0, window=0, percentile=100.00%, depth=64

Run status group 0 (all jobs):
READ: bw=15.5MiB/s (16.2MB/s), 15.5MiB/s-15.5MiB/s (16.2MB/s-16.2MB/s), io=929MiB (974MB), run=60001-60001msec
WRITE: bw=6808KiB/s (6971kB/s), 6808KiB/s-6808KiB/s (6971kB/s-6971kB/s), io=399MiB (418MB), run=60001-60001msec

Disk stats (read/write):
vdb: ios=237216/118960, merge=0/8118, ticks=55191/148225, in_queue=203416, util=99.35%

[essd_pl3]# fio -bs=4k -direct=1 -buffered=0 -thread -rw=randwrite -rwmixread=70 -size=16G -filename=./fio.test -name="EBS 4K randwrite test" -iodepth=64 -runtime=30
EBS 4K randwrite test: (g=0): rw=randwrite, bs=(R) 4096B-4096B, (W) 4096B-4096B, (T) 4096B-4096B, ioengine=psync, iodepth=64
fio-3.7
Starting 1 thread
Jobs: 1 (f=1): [w(1)][100.0%][r=0KiB/s,w=28.3MiB/s][r=0,w=7249 IOPS][eta 00m:00s]
EBS 4K randwrite test: (groupid=0, jobs=1): err= 0: pid=2470117: Fri Apr 8 15:35:20 2022
write: IOPS=7222, BW=28.2MiB/s (29.6MB/s)(846MiB/30001msec)
clat (usec): min=115, max=7155, avg=137.29, stdev=68.48
lat (usec): min=115, max=7156, avg=137.36, stdev=68.49
clat percentiles (usec):
| 1.00th=[ 121], 5.00th=[ 123], 10.00th=[ 125], 20.00th=[ 126],
| 30.00th=[ 127], 40.00th=[ 129], 50.00th=[ 130], 60.00th=[ 133],
| 70.00th=[ 135], 80.00th=[ 139], 90.00th=[ 149], 95.00th=[ 163],
| 99.00th=[ 255], 99.50th=[ 347], 99.90th=[ 668], 99.95th=[ 947],
| 99.99th=[ 3589]
bw ( KiB/s): min=23592, max=30104, per=99.95%, avg=28873.29, stdev=1084.49, samples=59
iops : min= 5898, max= 7526, avg=7218.32, stdev=271.12, samples=59
lat (usec) : 250=98.95%, 500=0.81%, 750=0.17%, 1000=0.03%
lat (msec) : 2=0.02%, 4=0.02%, 10=0.01%
cpu : usr=0.72%, sys=5.08%, ctx=216767, majf=0, minf=148
IO depths : 1=100.0%, 2=0.0%, 4=0.0%, 8=0.0%, 16=0.0%, 32=0.0%, >=64=0.0%
submit : 0=0.0%, 4=100.0%, 8=0.0%, 16=0.0%, 32=0.0%, 64=0.0%, >=64=0.0%
complete : 0=0.0%, 4=100.0%, 8=0.0%, 16=0.0%, 32=0.0%, 64=0.0%, >=64=0.0%
issued rwts: total=0,216677,0,0 short=0,0,0,0 dropped=0,0,0,0
latency : target=0, window=0, percentile=100.00%, depth=64

Run status group 0 (all jobs):
WRITE: bw=28.2MiB/s (29.6MB/s), 28.2MiB/s-28.2MiB/s (29.6MB/s-29.6MB/s), io=846MiB (888MB), run=30001-30001msec

Disk stats (read/write):
vdb: ios=0/219122, merge=0/3907, ticks=0/29812, in_queue=29812, util=99.52%

[root@hygon8 14:44 /polarx/lvm]
#fio -bs=4k -direct=1 -buffered=0 -thread -rw=randwrite -rwmixread=70 -size=16G -filename=./fio.test -name="EBS 4K randwrite test" -iodepth=64 -runtime=30
EBS 4K randwrite test: (g=0): rw=randwrite, bs=4K-4K/4K-4K/4K-4K, ioengine=sync, iodepth=64
fio-2.2.8
Starting 1 thread
Jobs: 1 (f=1): [w(1)] [100.0% done] [0KB/157.2MB/0KB /s] [0/40.3K/0 iops] [eta 00m:00s]
EBS 4K randwrite test: (groupid=0, jobs=1): err= 0: pid=3486352: Fri Apr 8 14:45:43 2022
write: io=4710.4MB, bw=160775KB/s, iops=40193, runt= 30001msec
clat (usec): min=18, max=4164, avg=22.05, stdev= 7.33
lat (usec): min=19, max=4165, avg=22.59, stdev= 7.36
clat percentiles (usec):
| 1.00th=[ 20], 5.00th=[ 20], 10.00th=[ 21], 20.00th=[ 21],
| 30.00th=[ 21], 40.00th=[ 21], 50.00th=[ 21], 60.00th=[ 22],
| 70.00th=[ 22], 80.00th=[ 22], 90.00th=[ 23], 95.00th=[ 25],
| 99.00th=[ 36], 99.50th=[ 40], 99.90th=[ 62], 99.95th=[ 99],
| 99.99th=[ 157]
bw (KB /s): min=147568, max=165400, per=100.00%, avg=160803.12, stdev=2704.22
lat (usec) : 20=0.08%, 50=99.70%, 100=0.17%, 250=0.04%, 500=0.01%
lat (usec) : 750=0.01%, 1000=0.01%
lat (msec) : 2=0.01%, 10=0.01%
cpu : usr=6.95%, sys=31.18%, ctx=1205994, majf=0, minf=1573
IO depths : 1=100.0%, 2=0.0%, 4=0.0%, 8=0.0%, 16=0.0%, 32=0.0%, >=64=0.0%
submit : 0=0.0%, 4=100.0%, 8=0.0%, 16=0.0%, 32=0.0%, 64=0.0%, >=64=0.0%
complete : 0=0.0%, 4=100.0%, 8=0.0%, 16=0.0%, 32=0.0%, 64=0.0%, >=64=0.0%
issued : total=r=0/w=1205849/d=0, short=r=0/w=0/d=0, drop=r=0/w=0/d=0
latency : target=0, window=0, percentile=100.00%, depth=64

Run status group 0 (all jobs):
WRITE: io=4710.4MB, aggrb=160774KB/s, minb=160774KB/s, maxb=160774KB/s, mint=30001msec, maxt=30001msec

Disk stats (read/write):
dm-2: ios=0/1204503, merge=0/0, ticks=0/15340, in_queue=15340, util=50.78%, aggrios=0/603282, aggrmerge=0/463, aggrticks=0/8822, aggrin_queue=0, aggrutil=28.66%
nvme0n1: ios=0/683021, merge=0/474, ticks=0/9992, in_queue=0, util=28.66%
nvme1n1: ios=0/523543, merge=0/452, ticks=0/7652, in_queue=0, util=21.67%

[root@x86.170 /polarx/lvm]
#/usr/sbin/nvme list
Node SN Model Namespace Usage Format FW Rev
---------------- -------------------- ---------------------------------------- --------- -------------------------- ---------------- --------
/dev/nvme0n1 BTLJ932205P44P0DGN INTEL SSDPE2KX040T8 1 3.84 TB / 3.84 TB 512 B + 0 B VDV10131
/dev/nvme1n1 BTLJ932207H04P0DGN INTEL SSDPE2KX040T8 1 3.84 TB / 3.84 TB 512 B + 0 B VDV10131
/dev/nvme2n1 BTLJ932205AS4P0DGN INTEL SSDPE2KX040T8 1 3.84 TB / 3.84 TB 512 B + 0 B VDV10131
[root@x86.170 /polarx/lvm]
#fio -bs=4k -direct=1 -buffered=0 -thread -rw=randwrite -rwmixread=70 -size=16G -filename=./fio.test -name="EBS 4K randwrite test" -iodepth=64 -runtime=30
EBS 4K randwrite test: (g=0): rw=randwrite, bs=4K-4K/4K-4K/4K-4K, ioengine=sync, iodepth=64
fio-2.2.8
Starting 1 thread
Jobs: 1 (f=1): [w(1)] [100.0% done] [0KB/240.2MB/0KB /s] [0/61.5K/0 iops] [eta 00m:00s]
EBS 4K randwrite test: (groupid=0, jobs=1): err= 0: pid=11516: Fri Apr 8 15:44:36 2022
write: io=7143.3MB, bw=243813KB/s, iops=60953, runt= 30001msec
clat (usec): min=10, max=818, avg=14.96, stdev= 4.14
lat (usec): min=10, max=818, avg=15.14, stdev= 4.15
clat percentiles (usec):
| 1.00th=[ 11], 5.00th=[ 12], 10.00th=[ 12], 20.00th=[ 14],
| 30.00th=[ 15], 40.00th=[ 15], 50.00th=[ 15], 60.00th=[ 15],
| 70.00th=[ 15], 80.00th=[ 16], 90.00th=[ 16], 95.00th=[ 16],
| 99.00th=[ 20], 99.50th=[ 32], 99.90th=[ 78], 99.95th=[ 84],
| 99.99th=[ 105]
bw (KB /s): min=236768, max=246424, per=99.99%, avg=243794.17, stdev=1736.82
lat (usec) : 20=98.96%, 50=0.73%, 100=0.29%, 250=0.01%, 500=0.01%
lat (usec) : 750=0.01%, 1000=0.01%
cpu : usr=10.65%, sys=42.66%, ctx=1828699, majf=0, minf=7
IO depths : 1=100.0%, 2=0.0%, 4=0.0%, 8=0.0%, 16=0.0%, 32=0.0%, >=64=0.0%
submit : 0=0.0%, 4=100.0%, 8=0.0%, 16=0.0%, 32=0.0%, 64=0.0%, >=64=0.0%
complete : 0=0.0%, 4=100.0%, 8=0.0%, 16=0.0%, 32=0.0%, 64=0.0%, >=64=0.0%
issued : total=r=0/w=1828662/d=0, short=r=0/w=0/d=0, drop=r=0/w=0/d=0
latency : target=0, window=0, percentile=100.00%, depth=64

Run status group 0 (all jobs):
WRITE: io=7143.3MB, aggrb=243813KB/s, minb=243813KB/s, maxb=243813KB/s, mint=30001msec, maxt=30001msec

Disk stats (read/write):
dm-0: ios=0/1823575, merge=0/0, ticks=0/13666, in_queue=13667, util=45.56%, aggrios=0/609558, aggrmerge=0/2, aggrticks=0/4280, aggrin_queue=4198, aggrutil=14.47%
nvme0n1: ios=0/609144, merge=0/6, ticks=0/4438, in_queue=4353, util=14.47%
nvme1n1: ios=0/609470, merge=0/0, ticks=0/4186, in_queue=4109, util=13.65%
nvme2n1: ios=0/610060, merge=0/0, ticks=0/4216, in_queue=4134, util=13.74%

倚天 PL3 VS SSD

测试环境倚天裸金属,4.18 CentOS fio-3.7

类型 参数 nvme SSD单盘 PL3+倚天裸金属
randread fio -bs=4k -buffered=1 IOPS=17.7K IOPS=2533
randread fio -ioengine=libaio -bs=4k -direct=1 -buffered=0 IOPS=269k IOPS=24k
randwrite fio -bs=4k -direct=1 -buffered=0 IOPS=68.5k IOPS=3275
randwrite fio -ioengine=libaio -bs=4k -buffered=1 IOPS=253k IOPS=250k
randrw fio -ioengine=libaio -bs=4k -buffered=1 rwmixread=70 write:IOPS=8815, read:IOPS=20.5K write:IOPS=1059,read:IOPS=2482
randrw fio -ioengine=libaio -bs=4k -direct=1 -buffered=0 rwmixread=70 write:IOPS=8754, read: IOPS=20.4K write: IOPS=940, read: IOPS=2212

测试命令

1
fio -ioengine=libaio -bs=4k -buffered=1  -thread -rw=randrw -rwmixread=70  -size=16G -filename=./fio.test -name="essd-pl3" -iodepth=64 -runtime=30

HDD性能测试数据

1
2
3
4
5
6
7
8
9
10
11
12
13
14
15
16
17
18
19
20
21
22
23
24
25
26
27
28
29
30
31
32
33
$sudo fio -iodepth=10 -ioengine=libaio -direct=1 -rw=randread -bs=32k -size=1G -numjobs=1 -runtime=60 -group_reporting -filename=./io.test -name=Read_Testing
Jobs: 1 (f=1): [r(1)][100.0%][r=15.0MiB/s][r=478 IOPS][eta 00m:00s]
Read_Testing: (groupid=0, jobs=1): err= 0: pid=104187: Mon Jan 20 09:16:00 2025
read: IOPS=487, BW=15.2MiB/s (16.0MB/s)(914MiB/60050msec)
slat (usec): min=2, max=336, avg= 7.62, stdev= 5.36
clat (usec): min=137, max=261017, avg=20515.50, stdev=24929.14
lat (usec): min=141, max=261022, avg=20523.12, stdev=24929.38
clat percentiles (usec):
| 1.00th=[ 194], 5.00th=[ 635], 10.00th=[ 1565], 20.00th=[ 3916],
| 30.00th=[ 6128], 40.00th=[ 8225], 50.00th=[ 10814], 60.00th=[ 15664],
| 70.00th=[ 22152], 80.00th=[ 32375], 90.00th=[ 51643], 95.00th=[ 71828],
| 99.00th=[116917], 99.50th=[139461], 99.90th=[185598], 99.95th=[200279],
| 99.99th=[221250]
bw ( KiB/s): min= 4288, max=18752, per=100.00%, avg=15597.87, stdev=2572.58, samples=120
iops : min= 134, max= 586, avg=487.43, stdev=80.39, samples=120
lat (usec) : 250=2.35%, 500=1.08%, 750=3.23%, 1000=0.52%
lat (msec) : 2=4.40%, 4=8.71%, 10=26.46%, 20=20.74%, 50=21.68%
lat (msec) : 100=8.97%, 250=1.85%, 500=0.01%
cpu : usr=0.15%, sys=0.57%, ctx=29254, majf=0, minf=91
IO depths : 1=0.1%, 2=0.1%, 4=0.1%, 8=100.0%, 16=0.0%, 32=0.0%, >=64=0.0%
submit : 0=0.0%, 4=100.0%, 8=0.0%, 16=0.0%, 32=0.0%, 64=0.0%, >=64=0.0%
complete : 0=0.0%, 4=100.0%, 8=0.0%, 16=0.1%, 32=0.0%, 64=0.0%, >=64=0.0%
issued rwts: total=29255,0,0,0 short=0,0,0,0 dropped=0,0,0,0
latency : target=0, window=0, percentile=100.00%, depth=10

Run status group 0 (all jobs):
READ: bw=15.2MiB/s (16.0MB/s), 15.2MiB/s-15.2MiB/s (16.0MB/s-16.0MB/s), io=914MiB (959MB), run=60050-60050msec

Disk stats (read/write):
sdm: ios=29639/657, merge=0/622, ticks=633013/17071, in_queue=655713, util=99.00%

$cat /sys/block/sdm/queue/rotational
1

img

从上图可以看到这个磁盘的IOPS 读 935 写 400,读rt 10731nsec 大约10us, 写 17us。如果IOPS是1000的话,rt应该是1ms,实际比1ms小两个数量级,应该是cache、磁盘阵列在起作用。

SATA硬盘,10K转

万转机械硬盘组成RAID5阵列,在顺序条件最好的情况下,带宽可以达到1GB/s以上,平均延时也非常低,最低只有20多us。但是在随机IO的情况下,机械硬盘的短板就充分暴露了,零点几兆的带宽,将近5ms的延迟,IOPS只有200左右。其原因是因为

  • 随机访问直接让RAID卡缓存成了个摆设
  • 磁盘不能并行工作,因为我的机器RAID宽度Strip Size为128 KB
  • 机械轴也得在各个磁道之间跳来跳去。

理解了磁盘顺序IO时候的几十M甚至一个GB的带宽,随机IO这个真的是太可怜了。

从上面的测试数据中我们看到了机械硬盘在顺序IO和随机IO下的巨大性能差异。在顺序IO情况下,磁盘是最擅长的顺序IO,再加上Raid卡缓存命中率也高。这时带宽表现有几十、几百M,最好条件下甚至能达到1GB。IOPS这时候能有2-3W左右。到了随机IO的情形下,机械轴也被逼的跳来跳去寻道,RAID卡缓存也失效了。带宽跌到了1MB以下,最低只有100K,IOPS也只有可怜巴巴的200左右。

开关 libaio 对比

启用和禁用 libaio 进行对比,尤其要注意 libaio 要配合 -iodepth=N 使用才能发挥作用

MySQL 8.0 里 innodb_parallel_read_threads 默认是开 4 个线程并行读,这就很像 libaio+iodepth 了

1
2
3
4
5
6
7
8
9
10
11
12
13
14
15
16
17
18
19
20
21
22
23
24
25
26
27
28
29
30
31
32
33
34
35
36
37
38
39
40
41
42
43
44
45
46
47
48
49
50
51
52
53
54
55
56
57
58
59
60
61
62
63
64
65
66
67
68
69
70
71
72
73
74
75
76
77
78
79
80
81
82
83
84
85
86
87
88
89
90
91
92
93
94
95
96
97
98
99
100
101
102
103
104
105
106
107
108
109
110
111
112
113
114
115
116
117
118
119
120
121
122
123
124
125
126
127
128
129
130
131
132
133
134
135
136
137
138
139
140
#fio -ioengine=libaio -direct=1 -iodepth=32 -rw=randread -bs=32k -size=16G -numjobs=1 -runtime=200 -group_reporting -filename=/polarx/ren.test -name=Read_Testing
Read_Testing: (g=0): rw=randread, bs=32K-32K/32K-32K/32K-32K, ioengine=libaio, iodepth=32
fio-2.2.8
Starting 1 process
Jobs: 1 (f=1): [r(1)] [100.0% done] [4092MB/0KB/0KB /s] [131K/0/0 iops] [eta 00m:00s]
Read_Testing: (groupid=0, jobs=1): err= 0: pid=125428: Thu Jan 16 19:01:46 2025
read : io=16384MB, bw=4089.9MB/s, iops=130875, runt= 4006msec
slat (usec): min=4, max=68, avg= 6.60, stdev= 1.31
clat (usec): min=102, max=846, avg=237.22, stdev=45.76
lat (usec): min=108, max=854, avg=243.92, stdev=45.78
clat percentiles (usec):
| 1.00th=[ 163], 5.00th=[ 179], 10.00th=[ 189], 20.00th=[ 203],
| 30.00th=[ 213], 40.00th=[ 221], 50.00th=[ 229], 60.00th=[ 239],
| 70.00th=[ 251], 80.00th=[ 266], 90.00th=[ 294], 95.00th=[ 322],
| 99.00th=[ 390], 99.50th=[ 418], 99.90th=[ 494], 99.95th=[ 532],
| 99.99th=[ 588]
bw (MB /s): min= 4078, max= 4104, per=100.00%, avg=4090.47, stdev= 7.59
lat (usec) : 250=69.08%, 500=30.83%, 750=0.09%, 1000=0.01%
cpu : usr=12.36%, sys=87.62%, ctx=20, majf=0, minf=267
IO depths : 1=0.1%, 2=0.1%, 4=0.1%, 8=0.1%, 16=0.1%, 32=100.0%, >=64=0.0%
submit : 0=0.0%, 4=100.0%, 8=0.0%, 16=0.0%, 32=0.0%, 64=0.0%, >=64=0.0%
complete : 0=0.0%, 4=100.0%, 8=0.0%, 16=0.0%, 32=0.1%, 64=0.0%, >=64=0.0%
issued : total=r=524288/w=0/d=0, short=r=0/w=0/d=0, drop=r=0/w=0/d=0
latency : target=0, window=0, percentile=100.00%, depth=32

Run status group 0 (all jobs):
READ: io=16384MB, aggrb=4089.9MB/s, minb=4089.9MB/s, maxb=4089.9MB/s, mint=4006msec, maxt=4006msec

Disk stats (read/write):
dm-0: ios=1020690/0, merge=0/0, ticks=140356/0, in_queue=142279, util=98.70%, aggrios=349525/0, aggrmerge=0/0, aggrticks=47694/0, aggrin_queue=47893, aggrutil=96.88%
nvme0n1: ios=349526/0, merge=0/0, ticks=47435/0, in_queue=47527, util=96.81%
nvme2n1: ios=349523/0, merge=0/0, ticks=47970/0, in_queue=48069, util=96.88%
nvme1n1: ios=349527/0, merge=0/0, ticks=47677/0, in_queue=48084, util=96.88%

[root@phy /polarx]
#fio -direct=1 -iodepth=32 -rw=randread -bs=32k -size=16G -numjobs=1 -runtime=200 -group_reporting -filename=/polarx/ren.test -name=Read_Testing
Read_Testing: (g=0): rw=randread, bs=32K-32K/32K-32K/32K-32K, ioengine=sync, iodepth=32
fio-2.2.8
Starting 1 process
Jobs: 1 (f=1): [r(1)] [100.0% done] [321.3MB/0KB/0KB /s] [10.3K/0/0 iops] [eta 00m:00s]
Read_Testing: (groupid=0, jobs=1): err= 0: pid=125665: Thu Jan 16 19:02:49 2025
read : io=16384MB, bw=327539KB/s, iops=10235, runt= 51222msec
clat (usec): min=73, max=168, avg=96.75, stdev= 3.64
lat (usec): min=73, max=169, avg=96.83, stdev= 3.64
clat percentiles (usec):
| 1.00th=[ 81], 5.00th=[ 94], 10.00th=[ 95], 20.00th=[ 96],
| 30.00th=[ 97], 40.00th=[ 97], 50.00th=[ 97], 60.00th=[ 98],
| 70.00th=[ 98], 80.00th=[ 98], 90.00th=[ 99], 95.00th=[ 100],
| 99.00th=[ 101], 99.50th=[ 102], 99.90th=[ 104], 99.95th=[ 107],
| 99.99th=[ 131]
bw (KB /s): min=326208, max=329792, per=100.00%, avg=327565.80, stdev=726.96
lat (usec) : 100=94.83%, 250=5.17%
cpu : usr=1.64%, sys=8.76%, ctx=524293, majf=0, minf=16
IO depths : 1=100.0%, 2=0.0%, 4=0.0%, 8=0.0%, 16=0.0%, 32=0.0%, >=64=0.0%
submit : 0=0.0%, 4=100.0%, 8=0.0%, 16=0.0%, 32=0.0%, 64=0.0%, >=64=0.0%
complete : 0=0.0%, 4=100.0%, 8=0.0%, 16=0.0%, 32=0.0%, 64=0.0%, >=64=0.0%
issued : total=r=524288/w=0/d=0, short=r=0/w=0/d=0, drop=r=0/w=0/d=0
latency : target=0, window=0, percentile=100.00%, depth=32

Run status group 0 (all jobs):
READ: io=16384MB, aggrb=327539KB/s, minb=327539KB/s, maxb=327539KB/s, mint=51222msec, maxt=51222msec

Disk stats (read/write):
dm-0: ios=1047582/0, merge=0/0, ticks=90196/0, in_queue=90742, util=92.36%, aggrios=349525/0, aggrmerge=0/0, aggrticks=30421/0, aggrin_queue=29816, aggrutil=60.17%
nvme0n1: ios=349526/0, merge=0/0, ticks=30465/0, in_queue=30005, util=58.48%
nvme2n1: ios=349523/0, merge=0/0, ticks=31635/0, in_queue=30871, util=60.17%
nvme1n1: ios=349527/0, merge=0/0, ticks=29165/0, in_queue=28573, util=55.69%


[root@phy /polarx]
#fio -ioengine=libaio -bs=4k -direct=1 -thread -rw=randwrite -rwmixread=70 -size=16G -filename=/polarx/ren.test -name="EBS 4K randwrite test" -iodepth=64 -runtime=60
EBS 4K randwrite test: (g=0): rw=randwrite, bs=4K-4K/4K-4K/4K-4K, ioengine=libaio, iodepth=64
fio-2.2.8
Starting 1 thread
Jobs: 1 (f=1): [w(1)] [100.0% done] [0KB/799.5MB/0KB /s] [0/205K/0 iops] [eta 00m:00s]
EBS 4K randwrite test: (groupid=0, jobs=1): err= 0: pid=14877: Thu Jan 16 19:21:21 2025
write: io=16384MB, bw=811277KB/s, iops=202819, runt= 20680msec
slat (usec): min=2, max=112, avg= 3.80, stdev= 0.96
clat (usec): min=11, max=6412, avg=311.05, stdev=55.04
lat (usec): min=15, max=6416, avg=314.95, stdev=55.04
clat percentiles (usec):
| 1.00th=[ 286], 5.00th=[ 294], 10.00th=[ 298], 20.00th=[ 302],
| 30.00th=[ 306], 40.00th=[ 310], 50.00th=[ 310], 60.00th=[ 314],
| 70.00th=[ 314], 80.00th=[ 318], 90.00th=[ 322], 95.00th=[ 326],
| 99.00th=[ 334], 99.50th=[ 338], 99.90th=[ 740], 99.95th=[ 1224],
| 99.99th=[ 2704]
bw (KB /s): min=789992, max=820936, per=99.99%, avg=811198.63, stdev=7037.24
lat (usec) : 20=0.04%, 50=0.04%, 100=0.04%, 250=0.19%, 500=99.54%
lat (usec) : 750=0.04%, 1000=0.03%
lat (msec) : 2=0.05%, 4=0.01%, 10=0.01%
cpu : usr=22.18%, sys=77.54%, ctx=6618, majf=0, minf=1506
IO depths : 1=0.1%, 2=0.1%, 4=0.1%, 8=0.1%, 16=0.1%, 32=0.1%, >=64=100.0%
submit : 0=0.0%, 4=100.0%, 8=0.0%, 16=0.0%, 32=0.0%, 64=0.0%, >=64=0.0%
complete : 0=0.0%, 4=100.0%, 8=0.0%, 16=0.0%, 32=0.0%, 64=0.1%, >=64=0.0%
issued : total=r=0/w=4194304/d=0, short=r=0/w=0/d=0, drop=r=0/w=0/d=0
latency : target=0, window=0, percentile=100.00%, depth=64

Run status group 0 (all jobs):
WRITE: io=16384MB, aggrb=811277KB/s, minb=811277KB/s, maxb=811277KB/s, mint=20680msec, maxt=20680msec

Disk stats (read/write):
dm-0: ios=0/4189902, merge=0/0, ticks=0/53584, in_queue=53669, util=100.00%, aggrios=0/1398104, aggrmerge=0/1, aggrticks=0/18815, aggrin_queue=17669, aggrutil=58.72%
nvme0n1: ios=0/1398107, merge=0/1, ticks=0/17693, in_queue=16375, util=55.72%
nvme2n1: ios=0/1398095, merge=0/1, ticks=0/19587, in_queue=18311, util=57.02%
nvme1n1: ios=0/1398111, merge=0/1, ticks=0/19166, in_queue=18321, util=58.72%

[root@phy /polarx]
#fio -bs=4k -direct=1 -thread -rw=randwrite -rwmixread=70 -size=16G -filename=/polarx/ren.test -name="EBS 4K randwrite test" -iodepth=64 -runtime=60
EBS 4K randwrite test: (g=0): rw=randwrite, bs=4K-4K/4K-4K/4K-4K, ioengine=sync, iodepth=64
fio-2.2.8
Starting 1 thread
Jobs: 1 (f=1): [w(1)] [100.0% done] [0KB/229.5MB/0KB /s] [0/58.8K/0 iops] [eta 00m:00s]
EBS 4K randwrite test: (groupid=0, jobs=1): err= 0: pid=16447: Thu Jan 16 19:23:00 2025
write: io=13666MB, bw=233236KB/s, iops=58309, runt= 60000msec
clat (usec): min=13, max=1406, avg=16.21, stdev= 1.48
lat (usec): min=13, max=1406, avg=16.33, stdev= 1.48
clat percentiles (usec):
| 1.00th=[ 13], 5.00th=[ 14], 10.00th=[ 14], 20.00th=[ 15],
| 30.00th=[ 16], 40.00th=[ 16], 50.00th=[ 16], 60.00th=[ 17],
| 70.00th=[ 17], 80.00th=[ 17], 90.00th=[ 18], 95.00th=[ 18],
| 99.00th=[ 19], 99.50th=[ 20], 99.90th=[ 22], 99.95th=[ 22],
| 99.99th=[ 24]
bw (KB /s): min=222688, max=234992, per=100.00%, avg=233226.35, stdev=1740.79
lat (usec) : 20=99.49%, 50=0.51%, 100=0.01%, 250=0.01%
lat (msec) : 2=0.01%
cpu : usr=10.76%, sys=29.50%, ctx=3498560, majf=0, minf=1128
IO depths : 1=100.0%, 2=0.0%, 4=0.0%, 8=0.0%, 16=0.0%, 32=0.0%, >=64=0.0%
submit : 0=0.0%, 4=100.0%, 8=0.0%, 16=0.0%, 32=0.0%, 64=0.0%, >=64=0.0%
complete : 0=0.0%, 4=100.0%, 8=0.0%, 16=0.0%, 32=0.0%, 64=0.0%, >=64=0.0%
issued : total=r=0/w=3498543/d=0, short=r=0/w=0/d=0, drop=r=0/w=0/d=0
latency : target=0, window=0, percentile=100.00%, depth=64

Run status group 0 (all jobs):
WRITE: io=13666MB, aggrb=233236KB/s, minb=233236KB/s, maxb=233236KB/s, mint=60000msec, maxt=60000msec

Disk stats (read/write):
dm-0: ios=0/3494396, merge=0/0, ticks=0/36982, in_queue=36750, util=61.25%, aggrios=0/1166190, aggrmerge=0/3, aggrticks=0/13666, aggrin_queue=11741, aggrutil=20.12%
nvme0n1: ios=0/1166324, merge=0/3, ticks=0/13514, in_queue=11514, util=19.16%
nvme2n1: ios=0/1166320, merge=0/3, ticks=0/14245, in_queue=12086, util=20.12%
nvme1n1: ios=0/1165926, merge=0/3, ticks=0/13240, in_queue=11625, util=19.35%

查看 SSD 的队列数:

1
2
3
4
5
#cat /sys/block/nvme0n1/queue/nr_requests
1023

# cat /sys/block/sdd/queue/nr_requests
128

innodb_parallel_read_threads

加大 innodb_parallel_read_threads 可以看到 count(*) 的速度能和 innodb_parallel_read_threads 匹配增加

1
2
3
4
5
6
7
8
9
10
11
12
13
14
15
16
17
18
19
20
21
//set global innodb_parallel_read_threads=16
Device: rrqm/s wrqm/s r/s w/s rkB/s wkB/s avgrq-sz avgqu-sz await r_await w_await svctm %util
sdb 0.00 0.00 47901.50 42.00 766424.00 402.00 31.99 13.23 0.28 0.28 0.14 0.02 100.15
dm-3 0.00 0.00 47902.50 52.50 766440.00 730.00 32.00 13.13 0.27 0.27 0.16 0.02 100.40
dm-5 0.00 0.00 47902.50 42.50 766440.00 730.00 32.00 13.19 0.27 0.27 0.20 0.02 100.45

Device: rrqm/s wrqm/s r/s w/s rkB/s wkB/s avgrq-sz avgqu-sz await r_await w_await svctm %util
sdb 0.00 0.00 47570.00 9.00 761112.00 76.00 32.00 13.22 0.28 0.28 0.22 0.02 100.20
dm-3 0.00 0.00 47569.00 12.00 761104.00 164.00 32.00 13.13 0.27 0.27 0.25 0.02 100.25
dm-5 0.00 0.00 47569.00 9.50 761104.00 164.00 32.00 13.16 0.28 0.28 0.32 0.02 100.20

//set global innodb_parallel_read_threads=1
Device: rrqm/s wrqm/s r/s w/s rkB/s wkB/s avgrq-sz avgqu-sz await r_await w_await svctm %util
sdb 0.00 0.00 3986.00 18.50 63776.00 190.00 31.95 0.83 0.21 0.21 0.08 0.21 82.75
dm-3 0.00 0.00 3986.00 23.00 63776.00 326.00 31.98 0.83 0.21 0.21 0.09 0.21 82.95
dm-5 0.00 0.00 3986.00 19.00 63776.00 326.00 32.01 0.83 0.21 0.21 0.11 0.21 83.10

Device: rrqm/s wrqm/s r/s w/s rkB/s wkB/s avgrq-sz avgqu-sz await r_await w_await svctm %util
sdb 0.00 0.00 4152.50 19.50 66440.00 192.00 31.94 0.83 0.20 0.20 0.15 0.20 82.50
dm-3 0.00 0.00 4152.50 24.00 66440.00 328.00 31.97 0.83 0.20 0.20 0.15 0.20 82.70
dm-5 0.00 0.00 4152.50 20.00 66440.00 328.00 32.00 0.83 0.20 0.20 0.17 0.20 82.85

从上面可以看到一个线程去读的时候 iops 是 4000, 如果 16 个线程并发去读 iops 就是 48000,count 速度也提升了 16 倍
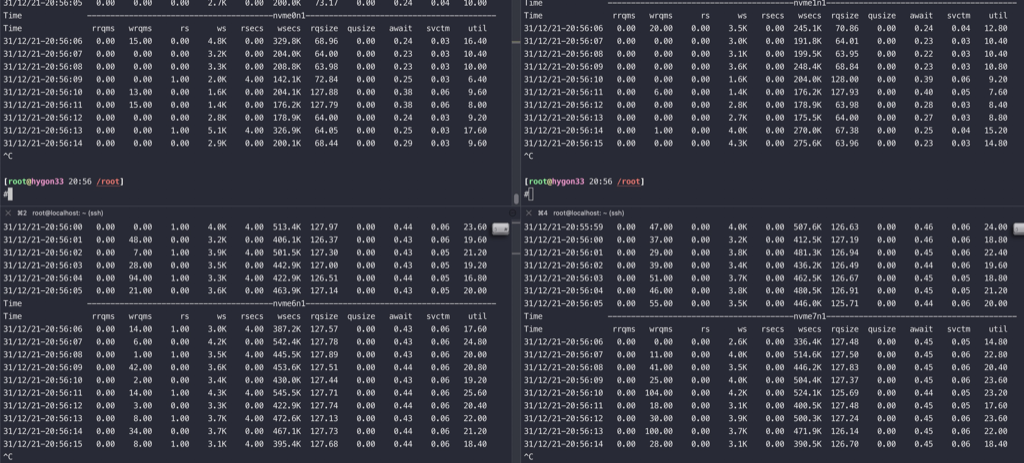
下图是 innodb_parallel_read_threads=4 时的 iotop,可以看到单线程读上限就是 52M 左右,相较 1 的时候 count(*) 的性能正好翻了 4 倍

image-20250117173703569

nvme SSD 的吞吐

1
2
3
4
5
6
7
8
9
10
11
12
13
14
15
16
17
18
19
20
21
22
23
24
//iodepth=1 时 iops 7324,吞吐 117M
#taskset -c 0 fio -iodepth=10 -ioengine=libaio -direct=1 -rw=randread -bs=32k -size=64G -numjobs=1 -runtime=60 -group_reporting -filename=./ren.test -name=Read_Testing
Device: rrqm/s wrqm/s r/s w/s rkB/s wkB/s avgrq-sz avgqu-sz await r_await w_await svctm %util
sda 0.00 8.50 0.00 2.50 0.00 44.00 35.20 0.00 1.20 0.00 1.20 1.00 0.25
nvme0n1 0.00 0.00 7324.00 0.00 117184.00 0.00 32.00 0.59 0.08 0.08 0.00 0.08 59.50
nvme2n1 0.00 0.00 7271.00 0.00 116336.00 0.00 32.00 0.59 0.08 0.08 0.00 0.08 59.50
nvme1n1 0.00 0.00 7376.50 0.00 118024.00 0.00 32.00 0.60 0.08 0.08 0.00 0.08 59.85
dm-0 0.00 0.00 21972.00 0.00 351552.00 0.00 32.00 1.82 0.08 0.08 0.00 0.04 92.85

//iodepth=10 时 iops 51434,吞吐 822M
#taskset -c 0 fio -iodepth=10 -ioengine=libaio -direct=1 -rw=randread -bs=32k -size=64G -numjobs=1 -runtime=60 -group_reporting -filename=./ren.test -name=Read_Testing
Device: rrqm/s wrqm/s r/s w/s rkB/s wkB/s avgrq-sz avgqu-sz await r_await w_await svctm %util
nvme0n1 0.00 0.00 51434.00 0.00 822944.00 0.00 32.00 5.39 0.11 0.11 0.00 0.02 100.25
nvme2n1 0.00 0.00 51584.50 0.00 825352.00 0.00 32.00 5.45 0.11 0.11 0.00 0.02 100.15
nvme1n1 0.00 0.00 51481.00 0.00 823696.00 0.00 32.00 5.50 0.11 0.11 0.00 0.02 100.05
dm-0 0.00 0.00 154499.00 0.00 2471984.00 0.00 32.00 16.45 0.11 0.11 0.00 0.01 100.65

//iodepth=100 时 iops 89666,吞吐 1434M
#taskset -c 0 fio -iodepth=100 -ioengine=libaio -direct=1 -rw=randread -bs=32k -size=64G -numjobs=1 -runtime=60 -group_reporting -filename=./ren.test -name=Read_Testing
Device: rrqm/s wrqm/s r/s w/s rkB/s wkB/s avgrq-sz avgqu-sz await r_await w_await svctm %util
nvme0n1 0.00 0.00 89666.50 0.00 1434664.00 0.00 32.00 12.35 0.14 0.14 0.00 0.01 100.15
nvme2n1 0.00 0.00 89875.50 0.00 1438008.00 0.00 32.00 12.47 0.14 0.14 0.00 0.01 100.20
nvme1n1 0.00 0.00 89802.00 0.00 1436832.00 0.00 32.00 12.63 0.14 0.14 0.00 0.01 100.25
dm-0 0.00 0.00 269342.50 0.00 4309472.00 0.00 32.00 38.53 0.14 0.14 0.00 0.00 102.55

之所以有这么大的差异,是靠 SSD 的多队列,也就是业务层面也要支持多线程同时读写才能发挥出 SSD 的多队列能力,也和目标文件大小相关

从数据上看 %util 对 SSD 参考意义不大,但是 %util 越大越是触摸到 IO 瓶颈了,比如看到 util% 到了 50% 不代表 IO 用到一半了, 50% 代表 1 秒中内有 0.5 秒 SSD 的所有队列都是空闲的

测试数据总结

-direct=1 -buffered=1 -direct=0 -buffered=1 -direct=1 -buffered=0 -direct=0 -buffered=0
NVMe SSD R=10.6k W=4544 R=10.8K W=4642 R=99.8K W=42.8K R=38.6k W=16.5k
SATA SSD R=4312 W=1852 R=5389 W=2314 R=16.9k W=7254 R=15.8k W=6803
ESSD R=2149 W=2150 R=1987 W=1984 R=2462 W=2465 R=2455 W=2458

看起来,对于SSD如果buffered为1的话direct没啥用,如果buffered为0那么direct为1性能要好很多

SATA SSD的IOPS比NVMe性能差很多

SATA SSD当-buffered=1参数下SATA SSD的latency在7-10us之间。

NVMe SSD以及SATA SSD当buffered=0的条件下latency均为2-3us, NVMe SSD latency参考文章第一个表格, 和本次NVMe测试结果一致.

ESSD的latency基本是13-16us。

以上NVMe SSD测试数据是在测试过程中还有mysql在全力导入数据的情况下,用fio测试所得。所以空闲情况下测试结果会更好。

网上测试数据参考

我们来一起看一下具体的数据。首先来看NVMe如何减小了协议栈本身的时间消耗,我们用blktrace工具来分析一组传输在应用程序层、操作系统层、驱动层和硬件层消耗的时间和占比,来了解AHCI和NVMe协议的性能区别:

img

硬盘HDD作为一个参考基准,它的时延是非常大的,达到14ms,而AHCI SATA为125us,NVMe为111us。我们从图中可以看出,NVMe相对AHCI,协议栈及之下所占用的时间比重明显减小,应用程序层面等待的时间占比很高,这是因为SSD物理硬盘速度不够快,导致应用空转。NVMe也为将来Optane硬盘这种低延迟介质的速度提高留下了广阔的空间。

对比LVM 、RAID0和 一块NVMe SSD

曙光H620-G30A机型下测试

各拿两块nvme,分别作LVM和RAID0,另外单独拿一块nvme直接读写,条带用的是4块nvme做的,然后比较顺序、随机读写,测试结果如下:

RAID0(2块盘) NVMe LVM RAID0(4块盘) 线性(4块 linear)
dd write bs=1M count=10240 conv=fsync 10.9秒 23秒 24.6秒 10.9秒 11.9秒
fio -ioengine=libaio -bs=4k -buffered=1 bw=346744KB/s, iops=86686
nvme6n1: util=38.43%
nvme7n1: util=38.96%
bw=380816KB/s, iops=95203
nvme2n1: util=68.31%
bw=175704KB/s, iops=43925
nvme0n1:util=29.60%
nvme1n1: util=25.64%
bw=337495KB/s, iops=84373
nvme6n1: util=20.93%
nvme5n1: util=21.30%
nvme4n1: util=21.12%
nvme7n1: util=20.95%
bw=329721KB/s, iops=82430
nvme0n1: util=67.22%
nvme3n1: util=0%
线性每次只写一块盘
fio -ioengine=libaio -bs=4k -direct=1 -buffered=0 bw=121556KB/s, iops=30389
nvme6n1: util=18.70%
nvme7n1: util=18.91%
bw=126215KB/s, iops=31553
nvme2n1: util=37.27%
bw=117192KB/s, iops=29297
nvme0n1:util=21.16%
nvme1n1: util=13.35%
bw=119145KB/s, iops=29786
nvme6n1: util=9.19%
nvme5n1: util=9.45%
nvme4n1: util=9.45%
nvme7n1: util=9.30%
bw=116688KB/s, iops=29171
nvme0n1: util=37.87%
nvme3n1: util=0%
线性每次只写一块盘
fio -bs=4k -direct=1 -buffered=0 bw=104107KB/s, iops=26026
nvme6n1: util=15.55%
nvme7n1: util=15.00%
bw=105115KB/s, iops=26278
nvme2n1: util=31.25%
bw=101936KB/s, iops=25484
nvme0n1:util=17.76%
nvme1n1: util=12.07%
bw=102517KB/s, iops=25629
nvme6n1: util=8.13%
nvme5n1: util=7.65%
nvme4n1: util=7.57%
nvme7n1: util=7.75%
bw=87280KB/s, iops=21820
nvme0n1: util=31.27%
nvme3n1: util=0%
线性每次只写一块盘
  • 整体看 nvme 最好(顺序写除外),raid0性能接近nvme,LVM最差
  • 顺序写raid0是nvme、LVM的两倍
  • 随机读写带buffered的话 nvme最好,raid0略差(猜测是软件消耗),LVM只有前两者的一半
  • 关掉buffered 三者性能下降都很大,最终差异变小
  • raid0下两块盘非常均衡,LVM下两块盘负载差异比较大
  • 性能不在单块盘到了瓶颈,当阵列中盘数变多后,软件实现的LVM、RAID性能都有下降
  • 开buffer对性能提升非常大
  • 每次测试前都会echo 3 > /proc/sys/vm/drop_caches ; rm -f ./fio.test ;测试跑多次,取稳定值
  • fio 测试里的 iodepth 对应 /sys/block/sdd/queue/nr_requests, SSD 的队列数越性能越好,但是要配合多线程并发读写

顺序读写

然后同时做dd写入测试

1
time taskset -c 0 dd if=/dev/zero of=./tempfile2 bs=1M count=40240 &

下图上面两块nvme做的LVM,下面两块nvme做成RAID0,同时开始测试,可以看到RAID0的两块盘写入速度更快

image-20211231205730735

测试结果

image-20211231205842753

实际单独写一块nvme也比写两块nvme做的LVM要快一倍,对dd这样的顺序读写,软RAID0还是能提升一倍速度的

1
2
3
4
5
6
7
8
9
10
11
12
13
14
15
16
17
18
19
20
21
22
23
24
25
26
27
28
29
30
31
32
33
34
35
[root@hygon33 14:02 /nvme]
#echo 3 > /proc/sys/vm/drop_caches ; rm -f ./tempfile2 ; time taskset -c 16 dd if=/dev/zero of=./tempfile2 bs=1M count=10240 conv=fsync
记录了10240+0 的读入
记录了10240+0 的写出
10737418240字节(11 GB,10 GiB)已复制,23.0399 s,466 MB/s

real 0m23.046s
user 0m0.004s
sys 0m8.033s

[root@hygon33 14:08 /nvme]
#cd ../md0/

[root@hygon33 14:08 /md0]
#echo 3 > /proc/sys/vm/drop_caches ; rm -f ./tempfile2 ; time taskset -c 16 dd if=/dev/zero of=./tempfile2 bs=1M count=10240 conv=fsync
记录了10240+0 的读入
记录了10240+0 的写出
10737418240字节(11 GB,10 GiB)已复制,10.9632 s,979 MB/s

real 0m10.967s
user 0m0.004s
sys 0m10.899s

[root@hygon33 14:08 /md0]
#cd /polarx/

[root@hygon33 14:08 /polarx]
#echo 3 > /proc/sys/vm/drop_caches ; rm -f ./tempfile2 ; time taskset -c 16 dd if=/dev/zero of=./tempfile2 bs=1M count=10240 conv=fsync
记录了10240+0 的读入
记录了10240+0 的写出
10737418240字节(11 GB,10 GiB)已复制,24.6481 s,436 MB/s

real 0m24.653s
user 0m0.008s
sys 0m24.557s

随机读写

SSD单独的随机读IOPS大概是随机写IOPS的10%, 应该是因为write有cache

RAID0是使用mdadm做的软raid,系统层面还是有消耗,没法和RAID卡硬件比较

左边是一块nvme,中间是两块nvme做了LVM,右边是两块nvme做RAID0,看起来速度差不多,一块nvme似乎要好一点点

1
fio -ioengine=libaio -bs=4k -buffered=1 -thread -rw=randwrite -rwmixread=70 -size=16G -filename=./fio.test -name="EBS 4K randwrite test" -iodepth=64 -runtime=60

image-20220101104145331

从观察来看,RAID0的两块盘读写、iops都非常均衡,LVM的两块盘

三个测试分开跑,独立nvme性能最好,LVM最差并且不均衡

image-20220101110016074

三个测试分开跑,去掉 aio,性能都只有原来的一半

1
fio  -bs=4k -direct=1 -buffered=0 -thread -rw=randwrite -rwmixread=70 -size=16G -filename=./fio.test -name="EBS 4K randwrite test" -iodepth=64 -runtime=60

image-20220101110708888

修改fio参数,用最快的 direct=0 buffered=1 aio 结论是raid0最快,直接写nvme略慢,LVM只有raid0的一半

1
2
3
4
5
6
7
8
9
10
11
12
13
14
15
16
17
18
19
20
21
22
23
24
25
26
27
28
29
30
31
32
33
34
35
36
37
38
39
40
41
42
43
44
45
46
47
48
49
50
51
52
53
54
55
56
57
58
59
60
61
62
63
64
65
66
67
68
69
70
71
72
73
74
75
76
77
78
79
80
81
82
83
84
85
86
87
88
89
90
91
92
93
94
95
96
97
98
99
100
101
102
103
104
105
106
107
108
109
110
[root@hygon33 13:43 /md0]
#echo 3 > /proc/sys/vm/drop_caches ; rm -f ./fio.test; fio -ioengine=libaio -bs=4k -direct=0 -buffered=1 -thread -rw=randwrite -rwmixread=70 -size=16G -filename=./fio.test -name="EBS 4K randwrite test" -iodepth=64 -runtime=60
EBS 4K randwrite test: (g=0): rw=randwrite, bs=4K-4K/4K-4K/4K-4K, ioengine=libaio, iodepth=64
fio-2.2.8
Starting 1 thread
EBS 4K randwrite test: Laying out IO file(s) (1 file(s) / 16384MB)
Jobs: 1 (f=1): [w(1)] [98.1% done] [0KB/394.3MB/0KB /s] [0/101K/0 iops] [eta 00m:01s]
EBS 4K randwrite test: (groupid=0, jobs=1): err= 0: pid=21016: Sat Jan 1 13:45:25 2022
write: io=16384MB, bw=329974KB/s, iops=82493, runt= 50844msec
slat (usec): min=3, max=1496, avg= 9.00, stdev= 2.76
clat (usec): min=5, max=2272, avg=764.73, stdev=101.63
lat (usec): min=10, max=2282, avg=774.19, stdev=103.15
clat percentiles (usec):
| 1.00th=[ 510], 5.00th=[ 612], 10.00th=[ 644], 20.00th=[ 684],
| 30.00th=[ 700], 40.00th=[ 716], 50.00th=[ 772], 60.00th=[ 820],
| 70.00th=[ 844], 80.00th=[ 860], 90.00th=[ 884], 95.00th=[ 908],
| 99.00th=[ 932], 99.50th=[ 940], 99.90th=[ 988], 99.95th=[ 1064],
| 99.99th=[ 1336]
bw (KB /s): min=277928, max=490720, per=99.84%, avg=329447.45, stdev=40386.54
lat (usec) : 10=0.01%, 20=0.01%, 50=0.01%, 100=0.01%, 250=0.01%
lat (usec) : 500=0.17%, 750=48.67%, 1000=51.08%
lat (msec) : 2=0.08%, 4=0.01%
cpu : usr=17.79%, sys=81.97%, ctx=113, majf=0, minf=5526
IO depths : 1=0.1%, 2=0.1%, 4=0.1%, 8=0.1%, 16=0.1%, 32=0.1%, >=64=100.0%
submit : 0=0.0%, 4=100.0%, 8=0.0%, 16=0.0%, 32=0.0%, 64=0.0%, >=64=0.0%
complete : 0=0.0%, 4=100.0%, 8=0.0%, 16=0.0%, 32=0.0%, 64=0.1%, >=64=0.0%
issued : total=r=0/w=4194304/d=0, short=r=0/w=0/d=0, drop=r=0/w=0/d=0
latency : target=0, window=0, percentile=100.00%, depth=64

Run status group 0 (all jobs):
WRITE: io=16384MB, aggrb=329974KB/s, minb=329974KB/s, maxb=329974KB/s, mint=50844msec, maxt=50844msec

Disk stats (read/write):
md0: ios=0/2883541, merge=0/0, ticks=0/0, in_queue=0, util=0.00%, aggrios=0/1232592, aggrmerge=0/219971, aggrticks=0/44029, aggrin_queue=0, aggrutil=38.91%
nvme6n1: ios=0/1228849, merge=0/219880, ticks=0/43940, in_queue=0, util=37.19%
nvme7n1: ios=0/1236335, merge=0/220062, ticks=0/44119, in_queue=0, util=38.91%

[root@hygon33 13:46 /nvme]
#echo 3 > /proc/sys/vm/drop_caches ; rm -f ./fio.test; fio -ioengine=libaio -bs=4k -direct=0 -buffered=1 -thread -rw=randwrite -rwmixread=70 -size=16G -filename=./fio.test -name="EBS 4K randwrite test" -iodepth=64 -runtime=60
EBS 4K randwrite test: (g=0): rw=randwrite, bs=4K-4K/4K-4K/4K-4K, ioengine=libaio, iodepth=64
fio-2.2.8
Starting 1 thread
EBS 4K randwrite test: Laying out IO file(s) (1 file(s) / 16384MB)
Jobs: 1 (f=1): [w(1)] [100.0% done] [0KB/314.3MB/0KB /s] [0/80.5K/0 iops] [eta 00m:00s]
EBS 4K randwrite test: (groupid=0, jobs=1): err= 0: pid=21072: Sat Jan 1 13:47:32 2022
write: io=16384MB, bw=309554KB/s, iops=77388, runt= 54198msec
slat (usec): min=3, max=88800, avg= 9.83, stdev=44.88
clat (usec): min=5, max=89662, avg=815.09, stdev=381.75
lat (usec): min=27, max=89748, avg=825.38, stdev=385.05
clat percentiles (usec):
| 1.00th=[ 470], 5.00th=[ 612], 10.00th=[ 652], 20.00th=[ 684],
| 30.00th=[ 716], 40.00th=[ 756], 50.00th=[ 796], 60.00th=[ 836],
| 70.00th=[ 876], 80.00th=[ 932], 90.00th=[ 1012], 95.00th=[ 1096],
| 99.00th=[ 1272], 99.50th=[ 1368], 99.90th=[ 1688], 99.95th=[ 1912],
| 99.99th=[ 3920]
bw (KB /s): min=247208, max=523840, per=99.99%, avg=309507.85, stdev=34709.01
lat (usec) : 10=0.01%, 50=0.01%, 100=0.01%, 250=0.01%, 500=1.73%
lat (usec) : 750=37.71%, 1000=49.60%
lat (msec) : 2=10.91%, 4=0.03%, 10=0.01%, 100=0.01%
cpu : usr=16.00%, sys=79.36%, ctx=138668, majf=0, minf=5522
IO depths : 1=0.1%, 2=0.1%, 4=0.1%, 8=0.1%, 16=0.1%, 32=0.1%, >=64=100.0%
submit : 0=0.0%, 4=100.0%, 8=0.0%, 16=0.0%, 32=0.0%, 64=0.0%, >=64=0.0%
complete : 0=0.0%, 4=100.0%, 8=0.0%, 16=0.0%, 32=0.0%, 64=0.1%, >=64=0.0%
issued : total=r=0/w=4194304/d=0, short=r=0/w=0/d=0, drop=r=0/w=0/d=0
latency : target=0, window=0, percentile=100.00%, depth=64

Run status group 0 (all jobs):
WRITE: io=16384MB, aggrb=309554KB/s, minb=309554KB/s, maxb=309554KB/s, mint=54198msec, maxt=54198msec

Disk stats (read/write):
dm-0: ios=77/1587455, merge=0/0, ticks=184/244940, in_queue=245124, util=98.23%, aggrios=77/1584444, aggrmerge=0/5777, aggrticks=183/193531, aggrin_queue=76, aggrutil=81.60%
sda: ios=77/1584444, merge=0/5777, ticks=183/193531, in_queue=76, util=81.60%

[root@hygon33 13:50 /polarx]
#echo 3 > /proc/sys/vm/drop_caches ; rm -f ./fio.test; fio -ioengine=libaio -bs=4k -direct=0 -buffered=1 -thread -rw=randwrite -rwmixread=70 -size=16G -filename=./fio.test -name="EBS 4K randwrite test" -iodepth=64 -runtime=60
EBS 4K randwrite test: (g=0): rw=randwrite, bs=4K-4K/4K-4K/4K-4K, ioengine=libaio, iodepth=64
fio-2.2.8
Starting 1 thread
EBS 4K randwrite test: Laying out IO file(s) (1 file(s) / 16384MB)
Jobs: 1 (f=1): [w(1)] [100.0% done] [0KB/293.2MB/0KB /s] [0/75.1K/0 iops] [eta 00m:00s]
EBS 4K randwrite test: (groupid=0, jobs=1): err= 0: pid=22787: Sat Jan 1 13:51:16 2022
write: io=10270MB, bw=175269KB/s, iops=43817, runt= 60001msec
slat (usec): min=4, max=2609, avg=19.43, stdev=19.84
clat (usec): min=4, max=6420, avg=1438.87, stdev=483.15
lat (usec): min=17, max=6718, avg=1458.80, stdev=490.29
clat percentiles (usec):
| 1.00th=[ 700], 5.00th=[ 788], 10.00th=[ 852], 20.00th=[ 964],
| 30.00th=[ 1080], 40.00th=[ 1208], 50.00th=[ 1368], 60.00th=[ 1560],
| 70.00th=[ 1752], 80.00th=[ 1944], 90.00th=[ 2128], 95.00th=[ 2224],
| 99.00th=[ 2416], 99.50th=[ 2480], 99.90th=[ 2672], 99.95th=[ 3248],
| 99.99th=[ 5088]
bw (KB /s): min=109992, max=308016, per=99.40%, avg=174219.83, stdev=56844.59
lat (usec) : 10=0.01%, 20=0.01%, 50=0.01%, 100=0.01%, 250=0.01%
lat (usec) : 500=0.01%, 750=2.87%, 1000=20.63%
lat (msec) : 2=59.43%, 4=17.03%, 10=0.03%
cpu : usr=9.11%, sys=57.07%, ctx=762410, majf=0, minf=1769
IO depths : 1=0.1%, 2=0.1%, 4=0.1%, 8=0.1%, 16=0.1%, 32=0.1%, >=64=100.0%
submit : 0=0.0%, 4=100.0%, 8=0.0%, 16=0.0%, 32=0.0%, 64=0.0%, >=64=0.0%
complete : 0=0.0%, 4=100.0%, 8=0.0%, 16=0.0%, 32=0.0%, 64=0.1%, >=64=0.0%
issued : total=r=0/w=2629079/d=0, short=r=0/w=0/d=0, drop=r=0/w=0/d=0
latency : target=0, window=0, percentile=100.00%, depth=64

Run status group 0 (all jobs):
WRITE: io=10270MB, aggrb=175269KB/s, minb=175269KB/s, maxb=175269KB/s, mint=60001msec, maxt=60001msec

Disk stats (read/write):
dm-2: ios=1/3185487, merge=0/0, ticks=0/86364, in_queue=86364, util=46.24%, aggrios=0/1576688, aggrmerge=0/16344, aggrticks=0/40217, aggrin_queue=0, aggrutil=29.99%
nvme0n1: ios=0/1786835, merge=0/16931, ticks=0/44447, in_queue=0, util=29.99%
nvme1n1: ios=1/1366541, merge=0/15758, ticks=0/35987, in_queue=0, util=25.44%

将RAID0从两块nvme改成四块后,整体性能略微下降

1
2
3
4
5
6
7
8
9
10
11
12
13
14
15
16
17
18
19
20
21
22
23
24
25
26
27
28
29
30
31
32
33
34
35
36
#fio  -bs=4k -direct=1 -buffered=0 -thread -rw=randwrite -rwmixread=70 -size=16G -filename=./fio.test -name="EBS 4K randwrite test" -iodepth=64 -runtime=60
EBS 4K randwrite test: (g=0): rw=randwrite, bs=4K-4K/4K-4K/4K-4K, ioengine=sync, iodepth=64
fio-2.2.8
Starting 1 thread
EBS 4K randwrite test: Laying out IO file(s) (1 file(s) / 16384MB)
Jobs: 1 (f=1): [w(1)] [100.0% done] [0KB/99756KB/0KB /s] [0/24.1K/0 iops] [eta 00m:00s]
EBS 4K randwrite test: (groupid=0, jobs=1): err= 0: pid=30608: Sat Jan 1 12:09:29 2022
write: io=5733.9MB, bw=97857KB/s, iops=24464, runt= 60001msec
clat (usec): min=29, max=2885, avg=37.95, stdev=12.19
lat (usec): min=30, max=2886, avg=38.49, stdev=12.20
clat percentiles (usec):
| 1.00th=[ 32], 5.00th=[ 33], 10.00th=[ 34], 20.00th=[ 35],
| 30.00th=[ 36], 40.00th=[ 36], 50.00th=[ 37], 60.00th=[ 37],
| 70.00th=[ 38], 80.00th=[ 39], 90.00th=[ 40], 95.00th=[ 49],
| 99.00th=[ 65], 99.50th=[ 76], 99.90th=[ 109], 99.95th=[ 125],
| 99.99th=[ 203]
bw (KB /s): min=92968, max=108344, per=99.99%, avg=97846.18, stdev=2085.73
lat (usec) : 50=95.20%, 100=4.61%, 250=0.18%, 500=0.01%, 750=0.01%
lat (usec) : 1000=0.01%
lat (msec) : 2=0.01%, 4=0.01%
cpu : usr=4.67%, sys=56.35%, ctx=1467919, majf=0, minf=1144
IO depths : 1=100.0%, 2=0.0%, 4=0.0%, 8=0.0%, 16=0.0%, 32=0.0%, >=64=0.0%
submit : 0=0.0%, 4=100.0%, 8=0.0%, 16=0.0%, 32=0.0%, 64=0.0%, >=64=0.0%
complete : 0=0.0%, 4=100.0%, 8=0.0%, 16=0.0%, 32=0.0%, 64=0.0%, >=64=0.0%
issued : total=r=0/w=1467872/d=0, short=r=0/w=0/d=0, drop=r=0/w=0/d=0
latency : target=0, window=0, percentile=100.00%, depth=64

Run status group 0 (all jobs):
WRITE: io=5733.9MB, aggrb=97856KB/s, minb=97856KB/s, maxb=97856KB/s, mint=60001msec, maxt=60001msec

Disk stats (read/write):
md0: ios=0/1553786, merge=0/0, ticks=0/0, in_queue=0, util=0.00%, aggrios=0/370860, aggrmerge=0/17733, aggrticks=0/6539, aggrin_queue=0, aggrutil=8.41%
nvme6n1: ios=0/369576, merge=0/17648, ticks=0/6439, in_queue=0, util=7.62%
nvme5n1: ios=0/370422, merge=0/17611, ticks=0/6600, in_queue=0, util=7.72%
nvme4n1: ios=0/371559, merge=0/18092, ticks=0/6511, in_queue=0, util=8.41%
nvme7n1: ios=0/371886, merge=0/17584, ticks=0/6606, in_queue=0, util=8.17%

raid6测试

raid6开buffer性能比raid0还要好10-20%,实际是将刷盘延迟异步在做,如果用-buffer=0 raid6的性能只有raid0的一半

image-20220105173206915

1
2
3
4
5
6
7
8
9
10
11
12
13
14
15
16
17
18
19
20
21
22
23
24
25
26
27
28
29
30
31
32
33
34
35
36
37
38
39
40
41
42
43
44
45
46
47
48
49
50
51
52
53
54
55
56
57
58
59
60
61
62
63
64
65
66
67
68
69
70
71
72
73
74
75
76
77
[root@hygon33 17:19 /md6]
#echo 3 > /proc/sys/vm/drop_caches ; rm -f ./fio.test; fio -ioengine=libaio -bs=4k -direct=1 -buffered=1 -thread -rw=randwrite -rwmixread=70 -size=16G -filename=./fio.test -name="EBS 4K randwrite test" -iodepth=64 -runtime=60
EBS 4K randwrite test: (g=0): rw=randwrite, bs=4K-4K/4K-4K/4K-4K, ioengine=libaio, iodepth=64
fio-2.2.8
Starting 1 thread
EBS 4K randwrite test: Laying out IO file(s) (1 file(s) / 16384MB)
Jobs: 1 (f=1): [w(1)] [100.0% done] [0KB/424.9MB/0KB /s] [0/109K/0 iops] [eta 00m:00s]
EBS 4K randwrite test: (groupid=0, jobs=1): err= 0: pid=117679: Wed Jan 5 17:21:13 2022
write: io=16384MB, bw=432135KB/s, iops=108033, runt= 38824msec
slat (usec): min=4, max=7289, avg= 6.06, stdev= 5.28
clat (usec): min=3, max=7973, avg=584.23, stdev=45.35
lat (usec): min=10, max=7986, avg=590.77, stdev=45.75
clat percentiles (usec):
| 1.00th=[ 548], 5.00th=[ 556], 10.00th=[ 564], 20.00th=[ 572],
| 30.00th=[ 580], 40.00th=[ 580], 50.00th=[ 580], 60.00th=[ 588],
| 70.00th=[ 588], 80.00th=[ 596], 90.00th=[ 604], 95.00th=[ 612],
| 99.00th=[ 636], 99.50th=[ 660], 99.90th=[ 796], 99.95th=[ 820],
| 99.99th=[ 916]
bw (KB /s): min=423896, max=455400, per=99.97%, avg=432015.17, stdev=6404.92
lat (usec) : 4=0.01%, 20=0.01%, 50=0.01%, 100=0.01%, 250=0.01%
lat (usec) : 500=0.01%, 750=99.78%, 1000=0.21%
lat (msec) : 2=0.01%, 4=0.01%, 10=0.01%
cpu : usr=21.20%, sys=78.56%, ctx=57, majf=0, minf=1769
IO depths : 1=0.1%, 2=0.1%, 4=0.1%, 8=0.1%, 16=0.1%, 32=0.1%, >=64=100.0%
submit : 0=0.0%, 4=100.0%, 8=0.0%, 16=0.0%, 32=0.0%, 64=0.0%, >=64=0.0%
complete : 0=0.0%, 4=100.0%, 8=0.0%, 16=0.0%, 32=0.0%, 64=0.1%, >=64=0.0%
issued : total=r=0/w=4194304/d=0, short=r=0/w=0/d=0, drop=r=0/w=0/d=0
latency : target=0, window=0, percentile=100.00%, depth=64

Run status group 0 (all jobs):
WRITE: io=16384MB, aggrb=432135KB/s, minb=432135KB/s, maxb=432135KB/s, mint=38824msec, maxt=38824msec

Disk stats (read/write):
md6: ios=0/162790, merge=0/0, ticks=0/0, in_queue=0, util=0.00%, aggrios=83058/153522, aggrmerge=1516568/962072, aggrticks=29792/16802, aggrin_queue=2425, aggrutil=44.71%
nvme0n1: ios=83410/144109, merge=1517412/995022, ticks=31218/16718, in_queue=2416, util=43.62%
nvme3n1: ios=83301/162626, merge=1517086/927594, ticks=24190/17067, in_queue=2364, util=34.14%
nvme2n1: ios=81594/144341, merge=1514750/992273, ticks=32204/16646, in_queue=2504, util=44.71%
nvme1n1: ios=83929/163013, merge=1517025/933399, ticks=31559/16780, in_queue=2416, util=42.83%

[root@hygon33 17:21 /md6]
#echo 3 > /proc/sys/vm/drop_caches ; rm -f ./fio.test; fio -ioengine=libaio -bs=4k -direct=1 -buffered=0 -thread -rw=randwrite -rwmixread=70 -size=16G -filename=./fio.test -name="EBS 4K randwrite test" -iodepth=64 -runtime=60
EBS 4K randwrite test: (g=0): rw=randwrite, bs=4K-4K/4K-4K/4K-4K, ioengine=libaio, iodepth=64
fio-2.2.8
Starting 1 thread
EBS 4K randwrite test: Laying out IO file(s) (1 file(s) / 16384MB)
Jobs: 1 (f=0): [w(1)] [22.9% done] [0KB/51034KB/0KB /s] [0/12.8K/0 iops] [eta 03m:25s]
EBS 4K randwrite test: (groupid=0, jobs=1): err= 0: pid=164871: Wed Jan 5 17:25:17 2022
write: io=3743.6MB, bw=63887KB/s, iops=15971, runt= 60003msec
slat (usec): min=11, max=123152, avg=29.39, stdev=283.93
clat (usec): min=261, max=196197, avg=3975.22, stdev=3526.29
lat (usec): min=300, max=196223, avg=4005.13, stdev=3554.65
clat percentiles (msec):
| 1.00th=[ 3], 5.00th=[ 3], 10.00th=[ 4], 20.00th=[ 4],
| 30.00th=[ 4], 40.00th=[ 4], 50.00th=[ 4], 60.00th=[ 4],
| 70.00th=[ 5], 80.00th=[ 5], 90.00th=[ 5], 95.00th=[ 6],
| 99.00th=[ 7], 99.50th=[ 7], 99.90th=[ 39], 99.95th=[ 88],
| 99.99th=[ 167]
bw (KB /s): min=41520, max=78176, per=100.00%, avg=64093.14, stdev=6896.65
lat (usec) : 500=0.02%, 750=0.03%, 1000=0.02%
lat (msec) : 2=0.73%, 4=64.28%, 10=34.72%, 20=0.06%, 50=0.08%
lat (msec) : 100=0.02%, 250=0.05%
cpu : usr=4.11%, sys=48.69%, ctx=357564, majf=0, minf=2653
IO depths : 1=0.1%, 2=0.1%, 4=0.1%, 8=0.1%, 16=0.1%, 32=0.1%, >=64=100.0%
submit : 0=0.0%, 4=100.0%, 8=0.0%, 16=0.0%, 32=0.0%, 64=0.0%, >=64=0.0%
complete : 0=0.0%, 4=100.0%, 8=0.0%, 16=0.0%, 32=0.0%, 64=0.1%, >=64=0.0%
issued : total=r=0/w=958349/d=0, short=r=0/w=0/d=0, drop=r=0/w=0/d=0
latency : target=0, window=0, percentile=100.00%, depth=64

Run status group 0 (all jobs):
WRITE: io=3743.6MB, aggrb=63886KB/s, minb=63886KB/s, maxb=63886KB/s, mint=60003msec, maxt=60003msec

Disk stats (read/write):
md6: ios=0/1022450, merge=0/0, ticks=0/0, in_queue=0, util=0.00%, aggrios=262364/764703, aggrmerge=430291/192464, aggrticks=38687/55432, aggrin_queue=317, aggrutil=42.63%
nvme0n1: ios=262282/759874, merge=430112/209613, ticks=43304/55197, in_queue=324, util=42.63%
nvme3n1: ios=260535/771153, merge=430415/176326, ticks=25263/55664, in_queue=280, util=26.11%
nvme2n1: ios=263663/758974, merge=430349/208189, ticks=42754/55761, in_queue=280, util=42.14%
nvme1n1: ios=262976/768813, merge=430289/175731, ticks=43430/55109, in_queue=384, util=42.00%

测试完成很久后ssd还维持高水位的读写

1
2
3
4
5
6
7
8
9
10
11
avg-cpu:  %user   %nice %system %iowait  %steal   %idle
0.28 0.00 1.15 0.05 0.00 98.51

Device r/s rkB/s rrqm/s %rrqm r_await rareq-sz w/s wkB/s wrqm/s %wrqm w_await wareq-sz d/s dkB/s drqm/s %drqm d_await dareq-sz aqu-sz %util
dm-0 5.00 56.00 0.00 0.00 0.53 11.20 39.00 292.33 0.00 0.00 0.00 7.50 0.00 0.00 0.00 0.00 0.00 0.00 0.00 0.27
md6 0.00 0.00 0.00 0.00 0.00 0.00 14.00 1794.67 0.00 0.00 0.00 128.19 0.00 0.00 0.00 0.00 0.00 0.00 0.00 0.00
nvme0n1 1164.67 144488.00 34935.33 96.77 0.74 124.06 3203.67 53877.83 10267.00 76.22 0.16 16.82 0.00 0.00 0.00 0.00 0.00 0.00 0.32 32.13
nvme1n1 1172.33 144402.67 34925.00 96.75 0.74 123.18 3888.67 46635.17 7771.33 66.65 0.13 11.99 0.00 0.00 0.00 0.00 0.00 0.00 0.33 29.60
nvme2n1 1166.67 144372.00 34914.00 96.77 0.74 123.75 3263.00 53699.17 10162.67 75.70 0.14 16.46 0.00 0.00 0.00 0.00 0.00 0.00 0.33 27.87
nvme3n1 1157.67 144414.67 34934.33 96.79 0.64 124.75 3894.33 47073.83 7875.00 66.91 0.13 12.09 0.00 0.00 0.00 0.00 0.00 0.00 0.31 20.80
sda 5.00 56.00 0.00 0.00 0.13 11.20 39.00 204.17 0.00 0.00 0.12 5.24 0.00 0.00 0.00 0.00 0.00 0.00 0.00 0.27

fio 结果解读

slat,异步场景下才有

其中slat指的是发起IO的时间,在异步IO模式下,发起IO以后,IO会异步完成。例如调用一个异步的write,虽然write返回成功了,但是IO还未完成,slat约等于发起write的耗时;

slat (usec): min=4, max=6154, avg=48.82, stdev=56.38: The first latency metric you’ll see is the ‘slat’ or submission latency. It is pretty much what it sounds like, meaning “how long did it take to submit this IO to the kernel for processing?”

clat

clat指的是完成时间,从发起IO后到完成IO的时间,在同步IO模式下,clat是指整个写动作完成时间

lat

lat是总延迟时间,指的是IO单元创建到完成的总时间,通常这项数据关注较多。同步场景几乎等于clat,异步场景等于clat+slat
这项数据需要关注的是max,看看有没有极端的高延迟IO;另外还需要关注stdev,这项数据越大说明,IO响应时间波动越大,反之越小,波动越小

clat percentiles (usec):处于某个百分位的io操作时延

cpu : usr=9.11%, sys=57.07%, ctx=762410, majf=0, minf=1769 //用户和系统的CPU占用时间百分比,线程切换次数,major以及minor页面错误的数量。

direct和buffered参数是冲突的,用一个就行,应该是direct=0性能更好,实际不是这样,这里还需要找资料求证下

  • direct``=bool

    If value is true, use non-buffered I/O. This is usually O_DIRECT. Note that OpenBSD and ZFS on Solaris don’t support direct I/O. On Windows the synchronous ioengines don’t support direct I/O. Default: false.

  • buffered``=bool

    If value is true, use buffered I/O. This is the opposite of the direct option. Defaults to true.

iostat 结果解读

iostat输出的数据来源diskstat (/proc/diskstats),推荐:https://bean-li.github.io/dive-into-iostat/

Dm-0就是lvm

1
2
3
4
5
6
7
8
9
10
11
12
13
14
15
avg-cpu:  %user   %nice %system %iowait  %steal   %idle
0.32 0.00 3.34 0.13 0.00 96.21

Device: rrqm/s wrqm/s r/s w/s rkB/s wkB/s avgrq-sz avgqu-sz await r_await w_await svctm %util
sda 0.00 11.40 66.00 7.20 1227.20 74.40 35.56 0.03 0.43 0.47 0.08 0.12 0.88
nvme0n1 0.00 8612.00 0.00 51749.60 0.00 241463.20 9.33 4.51 0.09 0.00 0.09 0.02 78.56
dm-0 0.00 0.00 0.00 60361.80 0.00 241463.20 8.00 152.52 2.53 0.00 2.53 0.01 78.26

avg-cpu: %user %nice %system %iowait %steal %idle
0.36 0.00 3.46 0.17 0.00 96.00

Device: rrqm/s wrqm/s r/s w/s rkB/s wkB/s avgrq-sz avgqu-sz await r_await w_await svctm %util
sda 0.00 8.80 9.20 5.20 1047.20 67.20 154.78 0.01 0.36 0.46 0.19 0.33 0.48
nvme0n1 0.00 11354.20 0.00 50876.80 0.00 248944.00 9.79 5.25 0.10 0.00 0.10 0.02 80.06
dm-0 0.00 0.00 0.00 62231.00 0.00 248944.80 8.00 199.49 3.21 0.00 3.21 0.01 78.86

avgqu_sz,是iostat的一项比较重要的数据。如果队列过长,则表示有大量IO在处理或等待,但是这还不足以说明后端的存储系统达到了处理极限。例如后端存储的并发能力是4096,客户端并发发送了256个IO下去,那么队列长度就是256。即使长时间队列长度是256,也不能说明什么,仅仅表明队列长度是256,有256个IO在处理或者排队。

avgrq-sz:请求是大IO还是小IO

rd_ticks和wr_ticks是把每一个IO消耗时间累加起来,但是硬盘设备一般可以并行处理多个IO,因此,rd_ticks和wr_ticks之和一般会比自然时间(wall-clock time)要大

那么怎么判断IO是在调度队列排队等待,还是在设备上处理呢?iostat有两项数据可以给出一个大致的判断。svctime,这项数据的指的是IO在设备处理中耗费的时间。另外一项数据await,指的是IO从排队到完成的时间,包括了svctime和排队等待的时间。那么通过对比这两项数据,如果两项数据差不多,则说明IO基本没有排队等待,耗费的时间都是设备处理。如果await远大于svctime,则说明有大量的IO在排队,并没有发送给设备处理。

不同厂家SSD性能对比

国产SSD指的是AliFlash

img

img

rq_affinity

参考aliyun测试文档 , rq_affinity增加2的commit: git show 5757a6d76c

1
2
3
4
5
6
7
8
9
10
11
12
13
14
15
16
17
18
19
20
21
22
23
24
25
26
27
28
29
function RunFio
{
numjobs=$1 # 实例中的测试线程数,例如示例中的10
iodepth=$2 # 同时发出I/O数的上限,例如示例中的64
bs=$3 # 单次I/O的块文件大小,例如示例中的4k
rw=$4 # 测试时的读写策略,例如示例中的randwrite
filename=$5 # 指定测试文件的名称,例如示例中的/dev/your_device
nr_cpus=`cat /proc/cpuinfo |grep "processor" |wc -l`
if [ $nr_cpus -lt $numjobs ];then
echo “Numjobs is more than cpu cores, exit!”
exit -1
fi
let nu=$numjobs+1
cpulist=""
for ((i=1;i<10;i++))
do
list=`cat /sys/block/your_device/mq/*/cpu_list | awk '{if(i<=NF) print $i;}' i="$i" | tr -d ',' | tr '\n' ','`
if [ -z $list ];then
break
fi
cpulist=${cpulist}${list}
done
spincpu=`echo $cpulist | cut -d ',' -f 2-${nu}`
echo $spincpu
fio --ioengine=libaio --runtime=30s --numjobs=${numjobs} --iodepth=${iodepth} --bs=${bs} --rw=${rw} --filename=${filename} --time_based=1 --direct=1 --name=test --group_reporting --cpus_allowed=$spincpu --cpus_allowed_policy=split
}
echo 2 > /sys/block/your_device/queue/rq_affinity
sleep 5
RunFio 10 64 4k randwrite filename

对NVME SSD进行测试,左边rq_affinity是2,右边rq_affinity为1,在这个测试参数下rq_affinity为1的性能要好(后许多次测试两者性能差不多)

image-20210607113709945

scheduler 算法

如下,选择了bfq,ssd的话推荐用none或者mq-deadline

1
2
#cat /sys/block/nvme{0,1,2,3}n1/queue/scheduler
mq-deadline kyber [bfq] none

bfq(Budget Fair Queueing),该调度算法令存储设备公平的对待每个线程,为各个进程服务相同数量的扇区。通常bfq适用于多媒体应用、桌面环境,对于很多IO压力很大的场景,例如IO集中在某些进程上的场景,bfq并不适用。

mq-deadline算法并不限制每个进程的 IO 资源,是一种以提高机械硬盘吞吐量为出发点的调度算法,该算法适用于IO压力大且IO集中在某几个进程的场景,比如大数据、数据库等场景

磁盘队列的主要目的是对磁盘的I/O进行合并和排序,以提高磁盘的整理性能,对于传统的机械硬盘而言,由于其读写头需要进行物理寻址,因此请求排序和合并调度是非常必要的。但对于SSD硬盘,由于其不需要进行物理寻址,因此磁盘队列的最用相对于小一点

修改

  • 临时修改全部磁盘的I/O调度算法,以mq-deadline为例(临时生效):

echo mq-deadline > /sys/block/sd*/queue/scheduler

  • 永久修改I/O调度算法,以mq-deadline为例(重启后生效):

vim /lib/udev/rules.d/60-block-scheduler.rules

img

将图中的bfq改为none或者mq-deadline。

  • 验证查看磁盘使用的调度算法:

使用lsblk -t查看SCHED列。

1
2
3
4
5
6
7
8
9
10
11
12
13
14
15
16
17
# lsblk -t
NAME ALIGNMENT MIN-IO OPT-IO PHY-SEC LOG-SEC ROTA SCHED RQ-SIZE RA WSAME
sda 0 512 0 512 512 0 mq-deadline 64 2048 0B
├─sda1 0 512 0 512 512 0 mq-deadline 64 2048 0B
├─sda2 0 512 0 512 512 0 mq-deadline 64 2048 0B
└─sda3 0 512 0 512 512 0 mq-deadline 64 2048 0B
├─klas-root 0 512 0 512 512 0 128 4096 0B
├─klas-swap 0 512 0 512 512 0 128 4096 0B
└─klas-backup 0 512 0 512 512 0 128 4096 0B
nvme3n1 0 512 0 512 512 0 bfq 256 2048 0B
└─vgpolarx-polarx 0 131072 524288 512 512 0 128 4096 0B
nvme0n1 0 512 0 512 512 0 bfq 256 2048 0B
└─vgpolarx-polarx 0 131072 524288 512 512 0 128 4096 0B
nvme2n1 0 512 0 512 512 0 bfq 256 2048 0B
└─vgpolarx-polarx 0 131072 524288 512 512 0 128 4096 0B
nvme1n1 0 512 0 512 512 0 bfq 256 2048 0B
└─vgpolarx-polarx 0 131072 524288 512 512 0 128 4096 0B

修改bfq调度器的idle时间(临时生效,重启后失效。)

bfq的idle时间默认是8ms,将默认值修改为0

  1. 执行如下命令修改idle值。此处以sdb举例,修改idle为0。

    1
    echo 0 > /sys/block/sdb/queue/iosched/slice_idle

none VS bfq

从下图可以看到 iops 减少到 none 的20-40%之间,并且抖动很大

image-20231011090249159

用sysbench write only 场景下 压鲲鹏机器+麒麟(4块nvme做条带LVM )+官方MySQL 也看到了QPS 很差且长期跌0,红框是改成none,红框之前的部分是bfq

img

下图是 sysbench write only 场景不同 scheduler 算法的 QPS,可以看到 bfq 很差,mq-deadline 和 none 几乎差不多

image-20231011095227886

对应的 iotop

image-20231011090609546

image-20231011090625857

磁盘挂载参数

内核一般配置的脏页回写超时时间是30s,理论上page cache能buffer住所有的脏页,但是ext4文件系统的默认挂载参数开始支持日志(journal),文件的inode被修改后,需要刷到journal里,这样系统crash了文件系统能恢复过来,内核配置默认5s刷一次journal。

ext4还有一个配置项叫挂载方式,有orderedwriteback两个选项,区别是ordered在把inode刷到journal里之前,会把inode的所有脏页先回写到磁盘里,如果不希望inode这么快写回到磁盘则可以用writeback参数。当SSD开始写盘的时候会严重影响SSD读能力

1
2
# 编辑/etc/fstab,挂载参数设置为defaults,noatime,nodiratime,delalloc,nobarrier,data=writeback
/dev/lvm1 /data ext4 defaults,noatime,nodiratime,delalloc,nobarrier,data=writeback 0 0

noatime 读取文件时,将禁用对元数据的更新。它还启用了 nodiratime 行为,该行为会在读取目录时禁用对元数据的更新

nodelalloc 参数是关闭了ext4的delayed allocation 特性。所谓delayed allocation 是指,把磁盘block的分配推后到真正要写数据的时候,比如写入文件的时候,先写内存,当数据需要落盘的时候,再由文件系统分配磁盘块,这有利于文件系统做出更佳的磁盘块分配决策,比如可以分配大片连续的磁盘块。显然 nodelalloc 性能要差些

delalloc吞吐高,但是偶发性延迟抖动,平均延迟略高
nodelalloc延迟稳定,但是吞吐会下降,偶发性会延迟剧烈抖动.

nobarrier 参数是不保证先写入文件系统日志然后才写入数据,也就是不保证系统崩溃后文件系统恢复的正确性,但是对写入性能有提升

1
2
3
4
5
6
7
参数说明:
noatime:不更新文件系统上inode访问时间,可以提升性能。
nobarrier:禁用用于文件系统的日志及数据完整性的写入操作,可以提高文件系统的性能。
nodelalloc: 在数据从用户空间copy 到page cache 就分配block
nobarrier: 关闭jbd中的写屏障,可以提升性能
stripe: 条带大小,单位未block
writeback:,则实际的数据下刷不会存在于jbd2的commit路径中,减少由于jbd2 commit transaction产生的延迟

优化case

10个GB的原始文件里面都是随机数,如何快速建索引支持分页查询top(k,n)场景,机器配置是24核,JVM堆内存限制2.5G,磁盘读写为490-500MB/s左右。

最后成绩在22.9s,去掉评测方法引入的1.1s,5次查询含建索引总时间21.8s,因为读10GB文件就需要21.5s时间。当向SSD开始写索引文件后SSD读取性能下降厉害,实际期望的是写出索引到SSD的时候会被PageCache,没触发刷脏。但是这里的刷盘就是ext4挂载参数 ordered 导致了刷盘。

整个方案是:原始文件切割成小分片,喂给24个worker;每个worker读数据,处理数据,定期批量写索引出去;最后查询会去读每个worker生成的所有索引文件,通过跳表快速seek。

img

LVM性能对比

磁盘信息

1
2
3
4
5
6
7
8
9
10
11
12
13
14
15
16
#lsblk
NAME MAJ:MIN RM SIZE RO TYPE MOUNTPOINT
sda 8:0 0 223.6G 0 disk
├─sda1 8:1 0 3M 0 part
├─sda2 8:2 0 1G 0 part /boot
├─sda3 8:3 0 96G 0 part /
├─sda4 8:4 0 10G 0 part /tmp
└─sda5 8:5 0 116.6G 0 part /home
nvme0n1 259:4 0 2.7T 0 disk
└─nvme0n1p1 259:5 0 2.7T 0 part
└─vg1-drds 252:0 0 5.4T 0 lvm /drds
nvme1n1 259:0 0 2.7T 0 disk
└─nvme1n1p1 259:2 0 2.7T 0 part /u02
nvme2n1 259:1 0 2.7T 0 disk
└─nvme2n1p1 259:3 0 2.7T 0 part
└─vg1-drds 252:0 0 5.4T 0 lvm /drds

单块nvme SSD盘跑mysql server,运行sysbench导入测试数据

1
2
3
4
5
6
7
8
9
10
11
12
13
14
15
16
17
18
19
20
21
22
23
24
25
26
27
28
29
30
31
32
33
34
35
36
37
38
39
40
41
42
43
44
45
46
47
48
49
50
51
52
53
54
55
56
57
#iostat -x nvme1n1 1
Linux 3.10.0-327.ali2017.alios7.x86_64 (k28a11352.eu95sqa) 05/13/2021 _x86_64_ (64 CPU)

avg-cpu: %user %nice %system %iowait %steal %idle
0.32 0.00 0.17 0.07 0.00 99.44

Device: rrqm/s wrqm/s r/s w/s rkB/s wkB/s avgrq-sz avgqu-sz await r_await w_await svctm %util
nvme1n1 0.00 47.19 0.19 445.15 2.03 43110.89 193.62 0.31 0.70 0.03 0.70 0.06 2.85

avg-cpu: %user %nice %system %iowait %steal %idle
1.16 0.00 0.36 0.17 0.00 98.31

Device: rrqm/s wrqm/s r/s w/s rkB/s wkB/s avgrq-sz avgqu-sz await r_await w_await svctm %util
nvme1n1 0.00 122.00 0.00 3290.00 0.00 271052.00 164.77 1.65 0.50 0.00 0.50 0.05 17.00

#iostat 1
Linux 3.10.0-327.ali2017.alios7.x86_64 (k28a11352.eu95sqa) 05/13/2021 _x86_64_ (64 CPU)

avg-cpu: %user %nice %system %iowait %steal %idle
0.14 0.00 0.13 0.05 0.00 99.67

Device: tps kB_read/s kB_wrtn/s kB_read kB_wrtn
sda 49.21 554.51 2315.83 1416900 5917488
nvme1n1 5.65 2.34 844.73 5989 2158468
nvme2n1 0.06 1.13 0.00 2896 0
nvme0n1 0.06 1.13 0.00 2900 0
dm-0 0.02 0.41 0.00 1036 0

avg-cpu: %user %nice %system %iowait %steal %idle
1.39 0.00 0.23 0.08 0.00 98.30

Device: tps kB_read/s kB_wrtn/s kB_read kB_wrtn
sda 8.00 0.00 60.00 0 60
nvme1n1 868.00 0.00 132100.00 0 132100
nvme2n1 0.00 0.00 0.00 0 0
nvme0n1 0.00 0.00 0.00 0 0
dm-0 0.00 0.00 0.00 0 0

avg-cpu: %user %nice %system %iowait %steal %idle
1.44 0.00 0.14 0.09 0.00 98.33

Device: tps kB_read/s kB_wrtn/s kB_read kB_wrtn
sda 0.00 0.00 0.00 0 0
nvme1n1 766.00 0.00 132780.00 0 132780
nvme2n1 0.00 0.00 0.00 0 0
nvme0n1 0.00 0.00 0.00 0 0
dm-0 0.00 0.00 0.00 0 0

avg-cpu: %user %nice %system %iowait %steal %idle
1.41 0.00 0.16 0.09 0.00 98.34

Device: tps kB_read/s kB_wrtn/s kB_read kB_wrtn
sda 105.00 0.00 532.00 0 532
nvme1n1 760.00 0.00 122236.00 0 122236
nvme2n1 0.00 0.00 0.00 0 0
nvme0n1 0.00 0.00 0.00 0 0
dm-0 0.00 0.00 0.00 0 0

如果同样写lvm,由两块nvme组成

1
2
3
4
5
6
7
8
9
10
11
12
13
14
15
16
17
18
19
20
21
22
23
24
25
26
27
28
29
30
31
32
33
34
35
36
37
38
39
40
41
42
43
44
45
46
47
48
49
50
51
Device:         rrqm/s   wrqm/s     r/s     w/s    rkB/s    wkB/s avgrq-sz avgqu-sz   await r_await w_await  svctm  %util
nvme2n1 0.00 0.00 0.00 0.00 0.00 0.00 0.00 0.00 0.00 0.00 0.00 0.00 0.00
nvme0n1 0.00 137.00 0.00 5730.00 0.00 421112.00 146.98 2.95 0.52 0.00 0.52 0.05 27.30

avg-cpu: %user %nice %system %iowait %steal %idle
1.17 0.00 0.34 0.19 0.00 98.30

Device: rrqm/s wrqm/s r/s w/s rkB/s wkB/s avgrq-sz avgqu-sz await r_await w_await svctm %util
nvme2n1 0.00 0.00 0.00 0.00 0.00 0.00 0.00 0.00 0.00 0.00 0.00 0.00 0.00
nvme0n1 0.00 109.00 0.00 2533.00 0.00 271236.00 214.16 1.08 0.43 0.00 0.43 0.06 15.90

avg-cpu: %user %nice %system %iowait %steal %idle
1.38 0.00 0.42 0.20 0.00 98.00

Device: rrqm/s wrqm/s r/s w/s rkB/s wkB/s avgrq-sz avgqu-sz await r_await w_await svctm %util
nvme2n1 0.00 0.00 0.00 0.00 0.00 0.00 0.00 0.00 0.00 0.00 0.00 0.00 0.00
nvme0n1 0.00 118.00 0.00 3336.00 0.00 320708.00 192.27 1.50 0.45 0.00 0.45 0.06 20.00

[root@k28a11352.eu95sqa /var/lib]
#iostat 1
Linux 3.10.0-327.ali2017.alios7.x86_64 (k28a11352.eu95sqa) 05/13/2021 _x86_64_ (64 CPU)

avg-cpu: %user %nice %system %iowait %steal %idle
0.40 0.00 0.20 0.07 0.00 99.33

Device: tps kB_read/s kB_wrtn/s kB_read kB_wrtn
sda 38.96 334.64 1449.68 1419236 6148304
nvme1n1 324.95 1.43 31201.30 6069 132329072
nvme2n1 0.07 0.90 0.00 3808 0
nvme0n1 256.24 1.60 22918.46 6801 97200388
dm-0 266.98 1.38 22918.46 5849 97200388

avg-cpu: %user %nice %system %iowait %steal %idle
1.20 0.00 0.42 0.25 0.00 98.12

Device: tps kB_read/s kB_wrtn/s kB_read kB_wrtn
sda 0.00 0.00 0.00 0 0
nvme1n1 0.00 0.00 0.00 0 0
nvme2n1 0.00 0.00 0.00 0 0
nvme0n1 4460.00 0.00 332288.00 0 332288
dm-0 4608.00 0.00 332288.00 0 332288

avg-cpu: %user %nice %system %iowait %steal %idle
1.35 0.00 0.38 0.22 0.00 98.06

Device: tps kB_read/s kB_wrtn/s kB_read kB_wrtn
sda 48.00 0.00 200.00 0 200
nvme1n1 0.00 0.00 0.00 0 0
nvme2n1 0.00 0.00 0.00 0 0
nvme0n1 4187.00 0.00 332368.00 0 332368
dm-0 4348.00 0.00 332368.00 0 332368

数据总结

  • 性能排序 NVMe SSD > SATA SSD > SAN > ESSD > HDD
  • 本地ssd性能最好、sas机械盘(RAID10)性能最差
  • san存储走特定的光纤网络,不是走tcp的san(至少从网卡看不到san的流量),性能居中
  • 从rt来看 ssd:san:sas 大概是 1:3:15
  • san比本地sas机械盘性能要好,这也许取决于san的网络传输性能和san存储中的设备(比如用的ssd而不是机械盘)
  • NVMe SSD比SATA SSD快很多,latency更稳定
  • 阿里云的云盘ESSD比本地SAS RAID10阵列性能还好
  • 软RAID、LVM等阵列都会导致性能损耗,即使多盘一起读写也不如单盘性能
  • 不同测试场景(4K/8K/ 读写、随机与否)会导致不同品牌性能数据差异较大

工具

smartctl

1
2
//raid 阵列查看
smartctl --all /dev/sda -d megaraid,1

参考资料

http://cizixs.com/2017/01/03/how-slow-is-disk-and-network

https://tobert.github.io/post/2014-04-17-fio-output-explained.html

https://zhuanlan.zhihu.com/p/40497397

https://linux.die.net/man/1/fio

块存储NVMe云盘原型实践

机械硬盘随机IO慢的超乎你的想象

搭载固态硬盘的服务器究竟比搭机械硬盘快多少?

SSD基本工作原理

SSD原理解读

Linux 后台开发必知的 I/O 优化知识总结

SSD性能怎么测?看这一篇就够了

kubernetes calico网络

cni 网络

cni0 is a Linux network bridge device, all veth devices will connect to this bridge, so all Pods on the same node can communicate with each other, as explained in Kubernetes Network Model and the hotel analogy above.

cni(Container Network Interface)

CNI 全称为 Container Network Interface,是用来定义容器网络的一个 规范containernetworking/cni 是一个 CNCF 的 CNI 实现项目,包括基本额 bridge,macvlan等基本网络插件。

一般将cni各种网络插件的可执行文件二进制放到 /opt/cni/bin ,在 /etc/cni/net.d/ 下创建配置文件,剩下的就交给 K8s 或者 containerd 了,我们不关心也不了解其实现。

比如:

1
2
3
4
5
6
7
8
9
10
11
12
13
14
15
16
17
#ls -lh /opt/cni/bin/
总用量 90M
-rwxr-x--- 1 root root 4.0M 12月 23 09:39 bandwidth
-rwxr-x--- 1 root root 35M 12月 23 09:39 calico
-rwxr-x--- 1 root root 35M 12月 23 09:39 calico-ipam
-rwxr-x--- 1 root root 3.0M 12月 23 09:39 flannel
-rwxr-x--- 1 root root 3.5M 12月 23 09:39 host-local
-rwxr-x--- 1 root root 3.1M 12月 23 09:39 loopback
-rwxr-x--- 1 root root 3.8M 12月 23 09:39 portmap
-rwxr-x--- 1 root root 3.3M 12月 23 09:39 tuning

[root@hygon3 15:55 /root]
#ls -lh /etc/cni/net.d/
总用量 12K
-rw-r--r-- 1 root root 607 12月 23 09:39 10-calico.conflist
-rw-r----- 1 root root 292 12月 23 09:47 10-flannel.conflist
-rw------- 1 root root 2.6K 12月 23 09:39 calico-kubeconfig

CNI 插件都是直接通过 exec 的方式调用,而不是通过 socket 这样 C/S 方式,所有参数都是通过环境变量、标准输入输出来实现的。

Step-by-step communication from Pod 1 to Pod 6:

  1. Package leaves *Pod 1 netns* through the *eth1* interface and reaches the root netns* through the virtual interface veth1*;
  2. Package leaves veth1* and reaches cni0*, looking for Pod 6*’s* address;
  3. Package leaves cni0* and is redirected to eth0*;
  4. Package leaves *eth0* from Master 1* and reaches the gateway*;
  5. Package leaves the *gateway* and reaches the *root netns* through the eth0* interface on Worker 1*;
  6. Package leaves eth0* and reaches cni0*, looking for Pod 6*’s* address;
  7. Package leaves *cni0* and is redirected to the *veth6* virtual interface;
  8. Package leaves the *root netns* through *veth6* and reaches the *Pod 6 netns* though the *eth6* interface;

image-20220115124747936

kubernetes calico 网络

1
2
3
4
kubectl apply -f https://docs.projectcalico.org/manifests/calico.yaml

#或者老版本的calico
curl https://docs.projectcalico.org/v3.15/manifests/calico.yaml -o calico.yaml

默认calico用的是ipip封包(这个性能跟原生网络差多少有待验证,本质也是overlay网络,比flannel那种要好很多吗?)

跨宿主机的两个容器之间的流量链路是:

cali-容器eth0->宿主机cali27dce37c0e8->tunl0->内核ipip模块封包->物理网卡(ipip封包后)—远程–> 物理网卡->内核ipip模块解包->tunl0->cali-容器

image.png

Calico IPIP模式对物理网络无侵入,符合云原生容器网络要求;使用IPIP封包,性能略低于Calico BGP模式;无法使用传统防火墙管理、也无法和存量网络直接打通。Pod在Node做SNAT访问外部,Pod流量不易被监控。

calico ipip网络不通

集群有五台机器192.168.0.110-114, 同时每个node都有另外一个ip:192.168.3.110-114,部分节点之间不通。每台机器部署好calico网络后,会分配一个 /26 CIRD 子网(64个ip)。

案例1

目标机是10.122.127.128(宿主机ip 192.168.3.112),如果从10.122.17.64(宿主机ip 192.168.3.110) ping 10.122.127.128不通,查看10.122.127.128路由表:

1
2
3
4
5
6
[root@az3-k8s-13 ~]# ip route |grep tunl0
10.122.17.64/26 via 10.122.127.128 dev tunl0 //这条路由不通
[root@az3-k8s-13 ~]# ip route del 10.122.17.64/26 via 10.122.127.128 dev tunl0 ; ip route add 10.122.17.64/26 via 192.168.3.110 dev tunl0 proto bird onlink

[root@az3-k8s-13 ~]# ip route |grep tunl0
10.122.17.64/26 via 192.168.3.110 dev tunl0 proto bird onlink //这样就通了

在10.122.127.128抓包如下,明显可以看到icmp request到了 tunl0网卡,tunl0网卡也回复了,但是回复包没有经过kernel ipip模块封装后发到eth1上:

image.png

正常机器应该是这样,上图不正常的时候缺少红框中的reply:

image.png

解决:

1
2
ip route del 10.122.17.64/26 via 10.122.127.128 dev tunl0 ; 
ip route add 10.122.17.64/26 via 192.168.3.110 dev tunl0 proto bird onlink

删除错误路由增加新的路由就可以了,新增路由的意思是从tunl0发给10.122.17.64/26的包下一跳是 192.168.3.110。

via 192.168.3.110 表示下一跳的ip

onlink参数的作用:
使用这个参数将会告诉内核,不必检查网关是否可达。因为在linux内核中,网关与本地的网段不同是被认为不可达的,从而拒绝执行添加路由的操作。

因为tunl0网卡ip的 CIDR 是32,也就是不属于任何子网,那么这个网卡上的路由没有网关,配置路由的话必须是onlink, 内核存也没法根据子网来选择到这块网卡,所以还会加上 dev 指定网卡。

案例2

集群有五台机器192.168.0.110-114, 同时每个node都有另外一个ip:192.168.3.110-114,只有node2没有192.168.3.111这个ip,结果node2跟其他节点都不通:

1
2
3
4
5
6
7
8
9
10
11
12
#calicoctl node status
Calico process is running.

IPv4 BGP status
+---------------+-------------------+-------+------------+-------------+
| PEER ADDRESS | PEER TYPE | STATE | SINCE | INFO |
+---------------+-------------------+-------+------------+-------------+
| 192.168.0.111 | node-to-node mesh | up | 2020-08-29 | Established |
| 192.168.3.112 | node-to-node mesh | up | 2020-08-29 | Established |
| 192.168.3.113 | node-to-node mesh | up | 2020-08-29 | Established |
| 192.168.3.114 | node-to-node mesh | up | 2020-08-29 | Established |
+---------------+-------------------+-------+------------+-------------+

从node4 ping node2,然后在node2上抓包,可以看到 icmp request都发到了node2上,但是node2收到后没有发给tunl0:

image.png

所以icmp没有回复,这里的问题在于kernel收到包后为什么不给tunl0

同样,在node2上ping node4,同时在node2上抓包,可以看到发给node4的request包和reply包:

image.png

从request包可以看到src ip 是0.111, dest ip是 3.113,因为 node2 没有192.168.3.111这个ip

非常关键的我们看到node4的回复包 src ip 不是3.113,而是0.113(根据node4的路由就应该是0.113)

image.png

这就是问题所在,从node4过来的ipip包src ip都是0.113,实际这里ipip能认识的只是3.113.

如果这个时候在3.113机器上把0.113网卡down掉,那么3.113上的:

10.122.124.128/26 via 192.168.0.111 dev tunl0 proto bird onlink 路由被自动删除,3.113将不再回复request。这是因为calico记录的node2的ip是192.168.0.111,所以会自动增加

解决办法,在node4上删除这条路由记录,也就是强制让回复包走3.113网卡,这样收发的ip就能对应上了

1
2
3
4
ip route del 192.168.0.0/24 dev eth0 proto kernel scope link src 192.168.0.113
//同时将默认路由改到3.113
ip route del default via 192.168.0.253 dev eth0;
ip route add default via 192.168.3.253 dev eth1

最终OK后,node4上的ip route是这样的:

1
2
3
4
5
6
7
8
9
10
11
12
13
14
15
[root@az3-k8s-14 ~]# ip route
default via 192.168.3.253 dev eth1
10.122.17.64/26 via 192.168.3.110 dev tunl0 proto bird onlink
10.122.124.128/26 via 192.168.0.111 dev tunl0 proto bird onlink
10.122.127.128/26 via 192.168.3.112 dev tunl0 proto bird onlink
blackhole 10.122.157.128/26 proto bird
10.122.157.129 dev cali19f6ea143e3 scope link
10.122.157.130 dev cali09e016ead53 scope link
10.122.157.131 dev cali0ad3225816d scope link
10.122.157.132 dev cali55a5ff1a4aa scope link
10.122.157.133 dev cali01cf8687c65 scope link
10.122.157.134 dev cali65232d7ada6 scope link
10.122.173.128/26 via 192.168.3.114 dev tunl0 proto bird onlink
172.17.0.0/16 dev docker0 proto kernel scope link src 172.17.0.1
192.168.3.0/24 dev eth1 proto kernel scope link src 192.168.3.113

正常后的抓包, 注意这里drequest的est ip 和reply的 src ip终于一致了:

1
2
3
4
5
6
7
8
9
//request
00:16:3e:02:06:1e > ee:ff:ff:ff:ff:ff, ethertype IPv4 (0x0800), length 118: (tos 0x0, ttl 64, id 57971, offset 0, flags [DF], proto IPIP (4), length 104)
192.168.0.111 > 192.168.3.110: (tos 0x0, ttl 64, id 18953, offset 0, flags [DF], proto ICMP (1), length 84)
10.122.124.128 > 10.122.17.64: ICMP echo request, id 22001, seq 4, length 64

//reply
ee:ff:ff:ff:ff:ff > 00:16:3e:02:06:1e, ethertype IPv4 (0x0800), length 118: (tos 0x0, ttl 64, id 2565, offset 0, flags [none], proto IPIP (4), length 104)
192.168.3.110 > 192.168.0.111: (tos 0x0, ttl 64, id 26374, offset 0, flags [none], proto ICMP (1), length 84)
10.122.17.64 > 10.122.124.128: ICMP echo reply, id 22001, seq 4, length 64

总结下来这两个案例都还是对路由不够了解,特别是案例2,因为有了多个网卡后导致路由更复杂。calico ipip的基本原理就是利用内核进行ipip封包,然后修改路由来保证网络的畅通。

netns 操作

以下case创建一个名为 ren 的netns,然后在里面增加一对虚拟网卡veth1 veth1_p, veth1放置在ren里面,veth1_p 放在物理机上,给他们配置上ip并up就能通了。

1
2
3
4
5
6
7
8
9
10
11
12
13
14
15
16
17
18
19
20
21
22
23
24
25
26
27
28
29
30
31
32
33
34
35
36
37
38
39
40
41
42
43
44
45
46
47
48
49
50
51
52
53
 1004  [2021-10-27 10:49:08] ip netns add ren
1005 [2021-10-27 10:49:12] ip netns show
1006 [2021-10-27 10:49:22] ip netns exec ren route //为空
1007 [2021-10-27 10:49:29] ip netns exec ren iptables -L
1008 [2021-10-27 10:49:55] ip link add veth1 type veth peer name veth1_p //此时宿主机上能看到这两块网卡
1009 [2021-10-27 10:50:07] ip link set veth1 netns ren //将veth1从宿主机默认网络空间挪到ren中,宿主机中看不到veth1了
1010 [2021-10-27 10:50:18] ip netns exec ren route
1011 [2021-10-27 10:50:25] ip netns exec ren iptables -L
1012 [2021-10-27 10:50:39] ifconfig
1013 [2021-10-27 10:50:51] ip link list
1014 [2021-10-27 10:51:29] ip netns exec ren ip link list
1017 [2021-10-27 10:53:27] ip netns exec ren ip addr add 172.19.0.100/24 dev veth1
1018 [2021-10-27 10:53:31] ip netns exec ren ip link list
1019 [2021-10-27 10:53:39] ip netns exec ren ifconfig
1020 [2021-10-27 10:53:42] ip netns exec ren ifconfig -a
1021 [2021-10-27 10:54:13] ip netns exec ren ip link set dev veth1 up
1022 [2021-10-27 10:54:16] ip netns exec ren ifconfig
1023 [2021-10-27 10:54:22] ping 172.19.0.100
1024 [2021-10-27 10:54:35] ifconfig -a
1025 [2021-10-27 10:55:03] ip netns exec ren ip addr add 172.19.0.101/24 dev veth1_p
1026 [2021-10-27 10:55:10] ip addr add 172.19.0.101/24 dev veth1_p
1027 [2021-10-27 10:55:16] ifconfig veth1_p
1028 [2021-10-27 10:55:30] ip link set dev veth1_p up
1029 [2021-10-27 10:55:32] ifconfig veth1_p
1030 [2021-10-27 10:55:38] ping 172.19.0.101
1031 [2021-10-27 10:55:43] ping 172.19.0.100
1032 [2021-10-27 10:55:53] ip link set dev veth1_p down
1033 [2021-10-27 10:55:54] ping 172.19.0.100
1034 [2021-10-27 10:55:58] ping 172.19.0.101
1035 [2021-10-27 10:56:08] ifconfig veth1_p
1036 [2021-10-27 10:56:32] ping 172.19.0.101
1037 [2021-10-27 10:57:04] ip netns exec ren route
1038 [2021-10-27 10:57:52] ip netns exec ren ping 172.19.0.101
1039 [2021-10-27 10:57:58] ip link set dev veth1_p up
1040 [2021-10-27 10:57:59] ip netns exec ren ping 172.19.0.101
1041 [2021-10-27 10:58:06] ip netns exec ren ping 172.19.0.100
1042 [2021-10-27 10:58:14] ip netns exec ren ifconfig
1043 [2021-10-27 10:58:19] ip netns exec ren route
1044 [2021-10-27 10:58:26] ip netns exec ren ping 172.19.0.100 -I veth1
1045 [2021-10-27 10:58:58] ifconfig veth1_p
1046 [2021-10-27 10:59:10] ping 172.19.0.100
1047 [2021-10-27 10:59:26] ip netns exec ren ping 172.19.0.101 -I veth1

把网卡加入到docker0的bridge下
1160 [2021-10-27 12:17:37] brctl show
1161 [2021-10-27 12:18:05] ip link set dev veth3_p master docker0
1162 [2021-10-27 12:18:09] ip link set dev veth1_p master docker0
1163 [2021-10-27 12:18:13] ip link set dev veth2 master docker0
1164 [2021-10-27 12:18:15] brctl show

brctl showmacs br0
brctl show cni0
brctl addif cni0 veth1 veth2 veth3 //往cni bridge添加多个容器peer 网卡

Linux 上存在一个默认的网络命名空间,Linux 中的 1 号进程初始使用该默认空间。Linux 上其它所有进程都是由 1 号进程派生出来的,在派生 clone 的时候如果没有额外特别指定,所有的进程都将共享这个默认网络空间。

所有的网络设备刚创建出来都是在宿主机默认网络空间下的。可以通过 ip link set 设备名 netns 网络空间名 将设备移动到另外一个空间里去,socket也是归属在某一个网络命名空间下的,由创建socket进程所在的netns来决定socket所在的netns

1
2
3
4
5
6
7
8
9
10
11
12
//file: net/socket.c
int sock_create(int family, int type, int protocol, struct socket **res)
{
return __sock_create(current->nsproxy->net_ns, family, type, protocol, res, 0);
}

//file: include/net/sock.h
static inline
void sock_net_set(struct sock *sk, struct net *net)
{
write_pnet(&sk->sk_net, net);
}

内核提供了三种操作命名空间的方式,分别是 clone、setns 和 unshare。ip netns add 使用的是 unshare,原理和 clone 是类似的。

Image

每个 net 下都包含了自己的路由表、iptable 以及内核参数配置等等

参考资料

https://morven.life/notes/networking-3-ipip/

https://www.cnblogs.com/bakari/p/10564347.html

https://www.cnblogs.com/goldsunshine/p/10701242.html

手工拉起flannel网络

kubernetes calico网络

cni 网络

cni0 is a Linux network bridge device, all veth devices will connect to this bridge, so all Pods on the same node can communicate with each other, as explained in Kubernetes Network Model and the hotel analogy above.

cni(Container Network Interface)

CNI 全称为 Container Network Interface,是用来定义容器网络的一个 规范containernetworking/cni 是一个 CNCF 的 CNI 实现项目,包括基本额 bridge,macvlan等基本网络插件。

一般将cni各种网络插件的可执行文件二进制放到 /opt/cni/bin ,在 /etc/cni/net.d/ 下创建配置文件,剩下的就交给 K8s 或者 containerd 了,我们不关心也不了解其实现。

比如:

1
2
3
4
5
6
7
8
9
10
11
12
13
14
15
16
17
#ls -lh /opt/cni/bin/
总用量 90M
-rwxr-x--- 1 root root 4.0M 12月 23 09:39 bandwidth
-rwxr-x--- 1 root root 35M 12月 23 09:39 calico
-rwxr-x--- 1 root root 35M 12月 23 09:39 calico-ipam
-rwxr-x--- 1 root root 3.0M 12月 23 09:39 flannel
-rwxr-x--- 1 root root 3.5M 12月 23 09:39 host-local
-rwxr-x--- 1 root root 3.1M 12月 23 09:39 loopback
-rwxr-x--- 1 root root 3.8M 12月 23 09:39 portmap
-rwxr-x--- 1 root root 3.3M 12月 23 09:39 tuning

[root@hygon3 15:55 /root]
#ls -lh /etc/cni/net.d/
总用量 12K
-rw-r--r-- 1 root root 607 12月 23 09:39 10-calico.conflist
-rw-r----- 1 root root 292 12月 23 09:47 10-flannel.conflist
-rw------- 1 root root 2.6K 12月 23 09:39 calico-kubeconfig

CNI 插件都是直接通过 exec 的方式调用,而不是通过 socket 这样 C/S 方式,所有参数都是通过环境变量、标准输入输出来实现的。

Step-by-step communication from Pod 1 to Pod 6:

  1. Package leaves *Pod 1 netns* through the *eth1* interface and reaches the root netns* through the virtual interface veth1*;
  2. Package leaves veth1* and reaches cni0*, looking for Pod 6*’s* address;
  3. Package leaves cni0* and is redirected to eth0*;
  4. Package leaves *eth0* from Master 1* and reaches the gateway*;
  5. Package leaves the *gateway* and reaches the *root netns* through the eth0* interface on Worker 1*;
  6. Package leaves eth0* and reaches cni0*, looking for Pod 6*’s* address;
  7. Package leaves *cni0* and is redirected to the *veth6* virtual interface;
  8. Package leaves the *root netns* through *veth6* and reaches the *Pod 6 netns* though the *eth6* interface;

image-20220115124747936

kubernetes calico 网络

1
2
3
4
kubectl apply -f https://docs.projectcalico.org/manifests/calico.yaml

#或者老版本的calico
curl https://docs.projectcalico.org/v3.15/manifests/calico.yaml -o calico.yaml

默认calico用的是ipip封包(这个性能跟原生网络差多少有待验证,本质也是overlay网络,比flannel那种要好很多吗?)

跨宿主机的两个容器之间的流量链路是:

cali-容器eth0->宿主机cali27dce37c0e8->tunl0->内核ipip模块封包->物理网卡(ipip封包后)—远程–> 物理网卡->内核ipip模块解包->tunl0->cali-容器

image.png

Calico IPIP模式对物理网络无侵入,符合云原生容器网络要求;使用IPIP封包,性能略低于Calico BGP模式;无法使用传统防火墙管理、也无法和存量网络直接打通。Pod在Node做SNAT访问外部,Pod流量不易被监控。

img

calico ipip网络不通

集群有五台机器192.168.0.110-114, 同时每个node都有另外一个ip:192.168.3.110-114,部分节点之间不通。每台机器部署好calico网络后,会分配一个 /26 CIRD 子网(64个ip)。

案例1

目标机是10.122.127.128(宿主机ip 192.168.3.112),如果从10.122.17.64(宿主机ip 192.168.3.110) ping 10.122.127.128不通,查看10.122.127.128路由表:

1
2
3
4
5
6
[root@az3-k8s-13 ~]# ip route |grep tunl0
10.122.17.64/26 via 10.122.127.128 dev tunl0 //这条路由不通
[root@az3-k8s-13 ~]# ip route del 10.122.17.64/26 via 10.122.127.128 dev tunl0 ; ip route add 10.122.17.64/26 via 192.168.3.110 dev tunl0 proto bird onlink

[root@az3-k8s-13 ~]# ip route |grep tunl0
10.122.17.64/26 via 192.168.3.110 dev tunl0 proto bird onlink //这样就通了

在10.122.127.128抓包如下,明显可以看到icmp request到了 tunl0网卡,tunl0网卡也回复了,但是回复包没有经过kernel ipip模块封装后发到eth1上:

image.png

正常机器应该是这样,上图不正常的时候缺少红框中的reply:

image.png

解决:

1
2
ip route del 10.122.17.64/26 via 10.122.127.128 dev tunl0 ; 
ip route add 10.122.17.64/26 via 192.168.3.110 dev tunl0 proto bird onlink

删除错误路由增加新的路由就可以了,新增路由的意思是从tunl0发给10.122.17.64/26的包下一跳是 192.168.3.110。

via 192.168.3.110 表示下一跳的ip

onlink参数的作用:
使用这个参数将会告诉内核,不必检查网关是否可达。因为在linux内核中,网关与本地的网段不同是被认为不可达的,从而拒绝执行添加路由的操作。

因为tunl0网卡ip的 CIDR 是32,也就是不属于任何子网,那么这个网卡上的路由没有网关,配置路由的话必须是onlink, 内核存也没法根据子网来选择到这块网卡,所以还会加上 dev 指定网卡。

案例2

集群有五台机器192.168.0.110-114, 同时每个node都有另外一个ip:192.168.3.110-114,只有node2没有192.168.3.111这个ip,结果node2跟其他节点都不通:

1
2
3
4
5
6
7
8
9
10
11
12
#calicoctl node status
Calico process is running.

IPv4 BGP status
+---------------+-------------------+-------+------------+-------------+
| PEER ADDRESS | PEER TYPE | STATE | SINCE | INFO |
+---------------+-------------------+-------+------------+-------------+
| 192.168.0.111 | node-to-node mesh | up | 2020-08-29 | Established |
| 192.168.3.112 | node-to-node mesh | up | 2020-08-29 | Established |
| 192.168.3.113 | node-to-node mesh | up | 2020-08-29 | Established |
| 192.168.3.114 | node-to-node mesh | up | 2020-08-29 | Established |
+---------------+-------------------+-------+------------+-------------+

从node4 ping node2,然后在node2上抓包,可以看到 icmp request都发到了node2上,但是node2收到后没有发给tunl0:

image.png

所以icmp没有回复,这里的问题在于kernel收到包后为什么不给tunl0

同样,在node2上ping node4,同时在node2上抓包,可以看到发给node4的request包和reply包:

image.png

从request包可以看到src ip 是0.111, dest ip是 3.113,因为 node2 没有192.168.3.111这个ip

非常关键的我们看到node4的回复包 src ip 不是3.113,而是0.113(根据node4的路由就应该是0.113)

image.png

这就是问题所在,从node4过来的ipip包src ip都是0.113,实际这里ipip能认识的只是3.113.

如果这个时候在3.113机器上把0.113网卡down掉,那么3.113上的:

10.122.124.128/26 via 192.168.0.111 dev tunl0 proto bird onlink 路由被自动删除,3.113将不再回复request。这是因为calico记录的node2的ip是192.168.0.111,所以会自动增加

解决办法,在node4上删除这条路由记录,也就是强制让回复包走3.113网卡,这样收发的ip就能对应上了

1
2
3
4
ip route del 192.168.0.0/24 dev eth0 proto kernel scope link src 192.168.0.113
//同时将默认路由改到3.113
ip route del default via 192.168.0.253 dev eth0;
ip route add default via 192.168.3.253 dev eth1

最终OK后,node4上的ip route是这样的:

1
2
3
4
5
6
7
8
9
10
11
12
13
14
15
[root@az3-k8s-14 ~]# ip route
default via 192.168.3.253 dev eth1
10.122.17.64/26 via 192.168.3.110 dev tunl0 proto bird onlink
10.122.124.128/26 via 192.168.0.111 dev tunl0 proto bird onlink
10.122.127.128/26 via 192.168.3.112 dev tunl0 proto bird onlink
blackhole 10.122.157.128/26 proto bird
10.122.157.129 dev cali19f6ea143e3 scope link
10.122.157.130 dev cali09e016ead53 scope link
10.122.157.131 dev cali0ad3225816d scope link
10.122.157.132 dev cali55a5ff1a4aa scope link
10.122.157.133 dev cali01cf8687c65 scope link
10.122.157.134 dev cali65232d7ada6 scope link
10.122.173.128/26 via 192.168.3.114 dev tunl0 proto bird onlink
172.17.0.0/16 dev docker0 proto kernel scope link src 172.17.0.1
192.168.3.0/24 dev eth1 proto kernel scope link src 192.168.3.113

正常后的抓包, 注意这里reques dest ip 和reply的 src ip终于一致了:

1
2
3
4
5
6
7
8
9
//request
00:16:3e:02:06:1e > ee:ff:ff:ff:ff:ff, ethertype IPv4 (0x0800), length 118: (tos 0x0, ttl 64, id 57971, offset 0, flags [DF], proto IPIP (4), length 104)
192.168.0.111 > 192.168.3.110: (tos 0x0, ttl 64, id 18953, offset 0, flags [DF], proto ICMP (1), length 84)
10.122.124.128 > 10.122.17.64: ICMP echo request, id 22001, seq 4, length 64

//reply
ee:ff:ff:ff:ff:ff > 00:16:3e:02:06:1e, ethertype IPv4 (0x0800), length 118: (tos 0x0, ttl 64, id 2565, offset 0, flags [none], proto IPIP (4), length 104)
192.168.3.110 > 192.168.0.111: (tos 0x0, ttl 64, id 26374, offset 0, flags [none], proto ICMP (1), length 84)
10.122.17.64 > 10.122.124.128: ICMP echo reply, id 22001, seq 4, length 64

总结下来这两个案例都还是对路由不够了解,特别是案例2,因为有了多个网卡后导致路由更复杂。calico ipip的基本原理就是利用内核进行ipip封包,然后修改路由来保证网络的畅通。

抓包

如下图,172.16.40.116是宿主机ip,192.168.196.0 是tunl0 ip

image-20230531141428895

参考资料

https://morven.life/notes/networking-3-ipip/

https://www.cnblogs.com/bakari/p/10564347.html

https://www.cnblogs.com/goldsunshine/p/10701242.html

手工拉起flannel网络

kubernetes Flannel网络剖析

cni(Container Network Interface)

CNI 全称为 Container Network Interface,是用来定义容器网络的一个 规范containernetworking/cni 是一个 CNCF 的 CNI 实现项目,包括基本的 bridge,macvlan等基本网络插件。

一般将cni各种网络插件的可执行文件二进制放到 /usr/libexec/cni/ ,在 /etc/cni/net.d/ 下创建配置文件,剩下的就交给 K8s 或者 containerd 了,我们不关心也不了解其实现。

比如:

1
2
3
4
5
6
7
8
9
10
11
12
13
14
15
16
17
18
19
20
21
22
23
24
25
26
27
# ls -lh /usr/libexec/cni/
总用量 133M
-rwxr-xr-x 1 root root 4.4M 8月 18 11:51 bandwidth
-rwxr-xr-x 1 root root 4.3M 3月 6 2021 bridge
-rwxr-x--- 1 root root 31M 8月 18 11:51 calico
-rwxr-x--- 1 root root 30M 8月 18 11:51 calico-ipam
-rwxr-xr-x 1 root root 12M 3月 6 2021 dhcp
-rwxr-xr-x 1 root root 5.6M 3月 6 2021 firewall
-rwxr-xr-x 1 root root 3.1M 8月 18 11:51 flannel
-rwxr-xr-x 1 root root 3.8M 3月 6 2021 host-device
-rwxr-xr-x 1 root root 3.9M 8月 18 11:51 host-local
-rwxr-xr-x 1 root root 4.0M 3月 6 2021 ipvlan
-rwxr-xr-x 1 root root 3.6M 8月 18 11:51 loopback
-rwxr-xr-x 1 root root 4.0M 3月 6 2021 macvlan
-rwxr-xr-x 1 root root 4.2M 8月 18 11:51 portmap
-rwxr-xr-x 1 root root 4.2M 3月 6 2021 ptp
-rwxr-xr-x 1 root root 2.7M 3月 6 2021 sample
-rwxr-xr-x 1 root root 3.2M 3月 6 2021 sbr
-rwxr-xr-x 1 root root 2.8M 3月 6 2021 static
-rwxr-xr-x 1 root root 3.7M 8月 18 11:51 tuning
-rwxr-xr-x 1 root root 4.0M 3月 6 2021 vlan

#ls -lh /etc/cni/net.d/
总用量 12K
-rw-r--r-- 1 root root 607 12月 23 09:39 10-calico.conflist
-rw-r----- 1 root root 292 12月 23 09:47 10-flannel.conflist
-rw------- 1 root root 2.6K 12月 23 09:39 calico-kubeconfig

CNI 插件都是直接通过 exec 的方式调用,而不是通过 socket 这样 C/S 方式,所有参数都是通过环境变量、标准输入输出来实现的。

跨主机通信流程

Step-by-step communication from Pod 1 to Pod 6:

  1. Package leaves *Pod 1 netns* through the *eth1* interface and reaches the root netns* through the virtual interface veth1*;
  2. Package leaves veth1* and reaches cni0*, looking for Pod 6*’s* address;
  3. Package leaves cni0* and is redirected to eth0*;
  4. Package leaves *eth0* from Master 1* and reaches the gateway*;
  5. Package leaves the *gateway* and reaches the *root netns* through the eth0* interface on Worker 1*;
  6. Package leaves eth0* and reaches cni0*, looking for Pod 6*’s* address;
  7. Package leaves *cni0* and is redirected to the *veth6* virtual interface;
  8. Package leaves the *root netns* through *veth6* and reaches the *Pod 6 netns* though the *eth6* interface;

image-20220115124747936

cni0 is a Linux network bridge device, all veth devices will connect to this bridge, so all Pods on the same node can communicate with each other, as explained in Kubernetes Network Model and the hotel analogy above.

默认cni 网络是没法跨宿主机的,跨宿主机需要走overlay(比如flannel的vxlan)或者仅限宿主机全在一个二层网络可达(比如用flannel的host-gw模式)

flannel vxlan网络

什么是 flannel

Flannel is a simple and easy way to configure a layer 3 network fabric designed for Kubernetes.

Flannel 工作原理

Flannel runs a small, single binary agent called flanneld on each host, and is responsible for allocating a subnet lease to each host out of a larger, preconfigured address space. Flannel uses either the Kubernetes API or etcd directly to store the network configuration, the allocated subnets, and any auxiliary data (such as the host’s public IP). Packets are forwarded using one of several backend mechanisms including VXLAN and various cloud integrations.

核心原理就是将pod网络包通过vxlan协议封装成一个udp包,udp包的ip是数据ip,内层是pod原始网络通信包。

假如POD1访问POD4:

  1. 从POD1中出来的包先到Bridge cni0上(因为POD1对应的veth挂在了cni0上),目标mac地址是cni0的Mac
  2. 然后进入到宿主机网络,宿主机有路由 10.244.2.0/24 via 10.244.2.0 dev flannel.1 onlink ,也就是目标ip 10.244.2.3的包交由 flannel.1 来处理,目标mac地址是POD4所在机器的flannel.1的Mac
  3. flanneld 进程将包封装成vxlan 丢到eth0从宿主机1离开(封装后的目标ip是192.168.2.91,现在都是由内核来完成flanneld这个封包过程,性能好)
  4. 这个封装后的vxlan udp包正确路由到宿主机2
  5. 然后经由 flanneld 解包成 10.244.2.3 ,命中宿主机2上的路由:10.244.2.0/24 dev cni0 proto kernel scope link src 10.244.2.1 ,交给cni0(这里会过宿主机iptables
  6. cni0将包送给POD4

img

flannel容器启动的时候会给自己所在的node注入一些信息:

1
2
3
4
5
6
7
#kubectl describe node hygon4  |grep -i flannel
Annotations: flannel.alpha.coreos.com/backend-data: {"VNI":1,"VtepMAC":"66:c6:ba:a2:8f:a1"}
flannel.alpha.coreos.com/backend-type: vxlan
flannel.alpha.coreos.com/kube-subnet-manager: true
flannel.alpha.coreos.com/public-ip: 10.176.4.245 ---宿主机ip,vxlan封包所用

"VtepMAC":"66:c6:ba:a2:8f:a1"----宿主机网卡 flannel.1的mac

flannel.1 知道如何通过物理网卡打包网络包到目标地址,flanneld 会在每个host 添加 arp,以及将本机的 vxlan fdb 添加到新的 host上

1
2
3
4
5
6
7
8
9
10
11
12
13
14
15
16
17
18
19
20
21
22
23
24
25
26
27
//这个 flannel 集群有四个 host,这是其中一个host 
//4e:95:a9:e2:ed:28是对方 host 上 flannel.1 的 mac
#ip neigh show dev flannel.1
172.19.2.0 lladdr 4e:95:a9:e2:ed:28 PERMANENT
172.19.3.0 lladdr 2e:8b:65:d7:54:3e PERMANENT
172.19.1.0 lladdr 6a:78:f3:db:b1:9e PERMANENT

#bridge fdb show flannel.1
01:00:5e:00:00:01 dev enp125s0f0 self permanent
01:00:5e:00:00:01 dev enp125s0f1 self permanent
01:00:5e:00:00:01 dev enp125s0f2 self permanent
01:00:5e:00:00:01 dev enp125s0f3 self permanent
33:33:00:00:00:01 dev enp125s0f3 self permanent
33:33:ff:8e:d6:ac dev enp125s0f3 self permanent
01:00:5e:00:00:01 dev enp2s0f0 self permanent
01:00:5e:00:00:01 dev enp2s0f1 self permanent
33:33:00:00:00:01 dev cni0 self permanent
01:00:5e:00:00:01 dev cni0 self permanent
f2:64:e3:49:4c:c8 dev cni0 vlan 1 master cni0 permanent
f2:64:e3:49:4c:c8 dev cni0 master cni0 permanent
72:d6:f3:54:7d:d6 dev vethe54b12b5 master cni0


# ip neigh show dev flannel.1 //另一个host
172.19.2.0 lladdr 4e:95:a9:e2:ed:28 PERMANENT
172.19.3.0 lladdr 2e:8b:65:d7:54:3e PERMANENT
172.19.0.0 lladdr 92:5c:b2:af:37:62 PERMANENT

包流程:

image-20220915113511706

ARP 和 FDB:

ARP (Address Resolution Protocol) table is used by a Layer 3 device (router, switch, server, desktop) to store the IP address to MAC address entries for a specific network device.

The FDB (forwarding database) table is used by a Layer 2 device (switch/bridge) to store the MAC addresses that have been learned and which ports that MAC address was learned on. The MAC addresses are learned through transparent bridging on switches and dedicated bridges.

抓包演示packet流转以及封包解包

一次完整的抓包过程演示包的流转,从hygon3上的pod 192.168.0.4(22:d8:63:6c:e8:96) 访问 hygon4上的pod 192.168.2.56(52:e6:8e:02:80:35)

1
2
3
4
5
6
7
8
9
10
11
12
13
14
15
16
17
18
19
20
21
22
23
24
25
26
27
28
29
30
31
32
33
34
35
36
37
38
39
40
41
42
43
44
45
46
47
48
49
50
51
52
53
54
55
56
57
58
59
60
61
62
63
64
65
66
67
68
69
70
71
72
73
74
75
76
77
78
79
80
81
82
83
84
85
86
//hygon3上的pod 192.168.0.4(22:d8:63:6c:e8:96) 访问 hygon4上的pod 192.168.2.56(52:e6:8e:02:80:35),在cni0(a2:99:4f:dc:9d:5c)上抓包,跨机不走peer veth
[root@hygon3 11:08 /root]
#tcpdump -i cni0 host 192.168.2.56 -nnetvv
dropped privs to tcpdump
tcpdump: listening on cni0, link-type EN10MB (Ethernet), capture size 262144 bytes
22:d8:63:6c:e8:96 > a2:99:4f:dc:9d:5c, ethertype IPv4 (0x0800), length 614: (tos 0x0, ttl 64, id 53303, offset 0, flags [DF], proto TCP (6), length 600)
192.168.0.4.40712 > 192.168.2.56.3100: Flags [P.], cksum 0x85d7 (incorrect -> 0x801a), seq 150533649:150534197, ack 3441674662, win 507, options [nop,nop,TS val 1239838869 ecr 2297983667], length 548

//hygon3上的pod 192.168.0.4 访问 hygon4上的pod 192.168.2.56,在本机flannel.1(a2:06:5e:83:44:78)上抓包
[root@hygon3 10:53 /root]
#tcpdump -i flannel.1 host 192.168.0.4 -nnetvv
dropped privs to tcpdump
tcpdump: listening on flannel.1, link-type EN10MB (Ethernet), capture size 262144 bytes
a2:06:5e:83:44:78 > 66:c6:ba:a2:8f:a1, ethertype IPv4 (0x0800), length 729: (tos 0x0, ttl 63, id 52997, offset 0, flags [DF], proto TCP (6), length 715)
192.168.0.4.40712 > 192.168.2.56.3100: Flags [P.], cksum 0x864a (incorrect -> 0x02ae), seq 150429115:150429778, ack 3441664870, win 507, options [nop,nop,TS val 1239381169 ecr 2297525566], length 663

[root@hygon3 11:13 /root] //通过arp 可以看到对端 flannel.1 的mac地址被缓存到了本地
#arp -n |grep 66:c6:ba:a2:8f:a1
192.168.2.0 ether 66:c6:ba:a2:8f:a1 CM flannel.1
#ip route
default via 10.176.3.247 dev p1p1
172.17.0.0/16 dev docker0 proto kernel scope link src 172.17.0.1
192.168.0.0/24 dev cni0 proto kernel scope link src 192.168.0.1
192.168.1.0/24 via 192.168.1.0 dev flannel.1 onlink
192.168.2.0/24 via 192.168.2.0 dev flannel.1 onlink
192.168.3.0/24 via 192.168.3.0 dev flannel.1 onlink
#ip a
18: flannel.1: <BROADCAST,MULTICAST,UP,LOWER_UP> mtu 1450 qdisc noqueue state UNKNOWN group default
link/ether a2:06:5e:83:44:78 brd ff:ff:ff:ff:ff:ff
inet 192.168.0.0/32 brd 192.168.0.0 scope global flannel.1
valid_lft forever preferred_lft forever
19: cni0: <BROADCAST,MULTICAST,UP,LOWER_UP> mtu 1450 qdisc noqueue state UP group default qlen 1000
link/ether a2:99:4f:dc:9d:5c brd ff:ff:ff:ff:ff:ff
inet 192.168.0.1/24 brd 192.168.0.255 scope global cni0
valid_lft forever preferred_lft forever

//宿主机物理网卡抓包,被封成了udp的vxlan包
[root@hygon3 11:12 /root]
#tcpdump -i p1p1 udp and port 8472 -nnetvv
0c:42:a1:db:b1:a8 > 88:66:39:89:9b:cc, ethertype IPv4 (0x0800), length 967: (tos 0x0, ttl 64, id 33722, offset 0, flags [none], proto UDP (17), length 953)
10.176.3.245.45173 > 10.176.4.245.8472: [bad udp cksum 0x88c6 -> 0xe4db!] OTV, flags [I] (0x08), overlay 0, instance 1
a2:06:5e:83:44:78 > 66:c6:ba:a2:8f:a1, ethertype IPv4 (0x0800), length 917: (tos 0x0, ttl 63, id 53539, offset 0, flags [DF], proto TCP (6), length 903)
192.168.0.4.40712 > 192.168.2.56.3100: Flags [P.], cksum 0x8706 (incorrect -> 0xe31b), seq 150613328:150614179, ack 3441682214, win 507, options [nop,nop,TS val 1240166469 ecr 2298311268], length 851

---------跨机分割线--------

[root@hygon4 11:15 /root] //udp ttl为61,经过了3跳(icmp ttl为63),不过这些都和vxlan内容无关了
#tcpdump -i p1p1 udp and port 8472 -nnetvv
88:66:39:2b:3f:ec > 0c:42:a1:e9:77:2c, ethertype IPv4 (0x0800), length 736: (tos 0x0, ttl 61, id 49748, offset 0, flags [none], proto UDP (17), length 722)
10.176.3.245.45173 > 10.176.4.245.8472: [udp sum ok] OTV, flags [I] (0x08), overlay 0, instance 1
a2:06:5e:83:44:78 > 66:c6:ba:a2:8f:a1, ethertype IPv4 (0x0800), length 686: (tos 0x0, ttl 63, id 53631, offset 0, flags [DF], proto TCP (6), length 672)
192.168.0.4.40712 > 192.168.2.56.3100: Flags [P.], cksum 0x7f0c (correct), seq 150646020:150646640, ack 3441685158, win 507, options [nop,nop,TS val 1240301769 ecr 2298444568], length 620
0c:42:a1:e9:77:2c > 88:66:39:2b:3f:ec, ethertype IPv4 (0x0800), length 180: (tos 0x0, ttl 64, id 57062, offset 0, flags [none], proto UDP (17), length 166)
10.176.4.245.41515 > 10.176.3.245.8472: [bad udp cksum 0x9a23 -> 0x8e11!] OTV, flags [I] (0x08), overlay 0, instance 1
66:c6:ba:a2:8f:a1 > a2:06:5e:83:44:78, ethertype IPv4 (0x0800), length 130: (tos 0x0, ttl 63, id 12391, offset 0, flags [DF], proto TCP (6), length 116)
192.168.2.56.3100 > 192.168.0.4.40712: Flags [P.], cksum 0x83f3 (incorrect -> 0x77e1), seq 1:65, ack 620, win 501, options [nop,nop,TS val 2298447868 ecr 1240301769], length 64

//到对端hygon4上抓包, 因为途中都是vxlan,所以ttl、mac地址都不变
[root@hygon4 10:55 /root]
#tcpdump -i flannel.1 host 192.168.2.56 -nnetvv
dropped privs to tcpdump
tcpdump: listening on flannel.1, link-type EN10MB (Ethernet), capture size 262144 bytes
a2:06:5e:83:44:78 > 66:c6:ba:a2:8f:a1, ethertype IPv4 (0x0800), length 933: (tos 0x0, ttl 63, id 52807, offset 0, flags [DF], proto TCP (6), length 919)
192.168.0.4.40712 > 192.168.2.56.3100: Flags [P.], cksum 0x8d0d (correct), seq 150361706:150362573, ack 3441658790, win 507, options [nop,nop,TS val 1239073069 ecr 2297216169], length 867

#ip a //only for flannel.1 and cni0
10: flannel.1: <BROADCAST,MULTICAST,UP,LOWER_UP> mtu 1450 qdisc noqueue state UNKNOWN group default
link/ether 66:c6:ba:a2:8f:a1 brd ff:ff:ff:ff:ff:ff
inet 192.168.2.0/32 brd 192.168.2.0 scope global flannel.1
valid_lft forever preferred_lft forever
11: cni0: <BROADCAST,MULTICAST,UP,LOWER_UP> mtu 1450 qdisc noqueue state UP group default qlen 1000
link/ether 16:97:3a:7b:53:00 brd ff:ff:ff:ff:ff:ff
inet 192.168.2.1/24 brd 192.168.2.255 scope global cni0
valid_lft forever preferred_lft forever

[root@hygon4 11:24 /root]
#arp -n | grep 44:78
192.168.0.0 ether a2:06:5e:83:44:78 CM flannel.1

//mac地址替换,ttl减1
[root@hygon4 10:55 /root]
#tcpdump -i cni0 host 192.168.2.56 -nnetvv
dropped privs to tcpdump
tcpdump: listening on cni0, link-type EN10MB (Ethernet), capture size 262144 bytes
16:97:3a:7b:53:00 > 52:e6:8e:02:80:35, ethertype IPv4 (0x0800), length 935: (tos 0x0, ttl 62, id 52829, offset 0, flags [DF], proto TCP (6), length 921)
192.168.0.4.40712 > 192.168.2.56.3100: Flags [P.], cksum 0x7aa8 (correct), seq 150369440:150370309, ack 3441659494, win 507, options [nop,nop,TS val 1239115869 ecr 2297259166], length 869

这个流转流程如下图:

flannel-network-flow

对应宿主机查询到的ip、路由信息(和上图不是对应的)

1
2
3
4
5
6
7
8
9
10
11
12
13
#ip -d -4 addr show cni0
475: cni0: <BROADCAST,MULTICAST,UP,LOWER_UP> mtu 1450 qdisc noqueue state UP group default qlen 1000
link/ether 8e:34:ba:e2:a4:c6 brd ff:ff:ff:ff:ff:ff promiscuity 0 minmtu 68 maxmtu 65535
bridge forward_delay 1500 hello_time 200 max_age 2000 ageing_time 30000 stp_state 0 priority 32768 vlan_filtering 0 vlan_protocol 802.1Q bridge_id 8000.8e:34:ba:e2:a4:c6 designated_root 8000.8e:34:ba:e2:a4:c6 root_port 0 root_path_cost 0 topology_change 0 topology_change_detected 0 hello_timer 0.00 tcn_timer 0.00 topology_change_timer 0.00 gc_timer 161.46 vlan_default_pvid 1 vlan_stats_enabled 0 group_fwd_mask 0 group_address 01:80:c2:00:00:00 mcast_snooping 1 mcast_router 1 mcast_query_use_ifaddr 0 mcast_querier 0 mcast_hash_elasticity 4 mcast_hash_max 512 mcast_last_member_count 2 mcast_startup_query_count 2 mcast_last_member_interval 100 mcast_membership_interval 26000 mcast_querier_interval 25500 mcast_query_interval 12500 mcast_query_response_interval 1000 mcast_startup_query_interval 3124 mcast_stats_enabled 0 mcast_igmp_version 2 mcast_mld_version 1 nf_call_iptables 0 nf_call_ip6tables 0 nf_call_arptables 0 numtxqueues 1 numrxqueues 1 gso_max_size 65536 gso_max_segs 65535
inet 192.168.3.1/24 brd 192.168.3.255 scope global cni0
valid_lft forever preferred_lft forever

#ip -d -4 addr show flannel.1 //vxlan id 1 local 10.133.2.252 dev bond0 --指定了物理网卡
474: flannel.1: <BROADCAST,MULTICAST,UP,LOWER_UP> mtu 1450 qdisc noqueue state UNKNOWN group default
link/ether fe:49:64:ae:36:af brd ff:ff:ff:ff:ff:ff promiscuity 0 minmtu 68 maxmtu 65535
vxlan id 1 local 10.133.2.252 dev bond0 srcport 0 0 dstport 8472 nolearning ttl auto ageing 300 udpcsum noudp6zerocsumtx noudp6zerocsumrx numtxqueues 1 numrxqueues 1 gso_max_size 65536 gso_max_segs 65535
inet 192.168.3.0/32 brd 192.168.3.0 scope global flannel.1
valid_lft forever preferred_lft forever

包流转示意图

image-20220119114929034

flannel网络不通排查案例

当网络不通时,可以根据以上演示的包流转路径在不同的网络设备上抓包来定位哪个环节不通

firewalld

在麒麟系统的物理机上通过kubeadm setup集群,发现有的环境flannel网络不通,在宿主机上ping 其它物理机flannel.0网卡的ip,通过在对端宿主机抓包发现icmp收到后被防火墙扔掉了,抓包中可以看到错误信息:icmp unreachable - admin prohibited

下图中正常的icmp是直接ping 物理机ip

image-20211228203650921

The “admin prohibited filter” seen in the tcpdump output means there is a firewall blocking a connection. It does it by sending back an ICMP packet meaning precisely that: the admin of that firewall doesn’t want those packets to get through. It could be a firewall at the destination site. It could be a firewall in between. It could be iptables on the Linux system.

发现有问题的环境中宿主机的防火墙设置报错了:

1
2
12月 28 23:35:08 hygon253 firewalld[10493]: WARNING: COMMAND_FAILED: '/usr/sbin/iptables -w10 -t filter -X DOCKER-ISOLATION-STAGE-1' failed: iptables: No chain/target/match by that name.
12月 28 23:35:08 hygon253 firewalld[10493]: WARNING: COMMAND_FAILED: '/usr/sbin/iptables -w10 -t filter -F DOCKER-ISOLATION-STAGE-2' failed: iptables: No chain/target/match by that name.

应该是因为启动docker的时候 firewalld 是运行着的

Do you have firewalld enabled, and was it (re)started after docker was started? If so, then it’s likely that firewalld wiped docker’s IPTables rules. Restarting the docker daemon should re-create those rules.

停掉 firewalld 服务可以解决这个问题,k8s集群

flannel网络不通

Starting from Docker 1.13 default iptables policy for FORWARDING is DROP

flannel能收到包,但是cni0收不到包,说明包进到了目标宿主机,但是从flannel解开udp转送到cni的时候出了问题,大概率是iptables 拦截了包

1
2
3
4
5
6
7
8
9
10
11
12
13
14
It seems docker version >=1.13 will add iptables rule like below,and it make this issue happen:
iptables -P FORWARD DROP

All you need to do is add a rule below:
iptables -P FORWARD ACCEPT //将FORWARD 默认规则(没有匹配到其它规则的话)改成ACCEPT

//flannel 会检查 forward chain并将之改成 accept?以下是flannel 容器日志
I0913 07:52:30.965060 1 main.go:698] Using interface with name enp2s0f0 and address 192.168.0.1
I0913 07:52:30.965128 1 main.go:720] Defaulting external address to interface address (192.168.0.1)
I0913 07:52:30.965134 1 main.go:733] Defaulting external v6 address to interface address (<nil>)
I0913 07:52:30.965243 1 vxlan.go:137] VXLAN config: VNI=1 Port=0 GBP=false Learning=false DirectRouting=false
I0913 07:52:30.966878 1 kube.go:339] Setting NodeNetworkUnavailable
I0913 07:52:30.977942 1 main.go:340] Setting up masking rules
I0913 07:52:31.332105 1 main.go:361] Changing default FORWARD chain policy to ACCEPT

宿主机多 ip 下 flannel 网络不通

宿主机有两个ip,flannel组网ip是192.168,但是默认路由在1.1.网络下,此时能 ping 通,但是curl不通端口

1
2
3
4
5
6
7
8
9
10
11
12
13
14
15
16
17
18
19
20
21
#tcpdump -i enp2s0f0 -nettvv host 192.168.0.3 and udp
tcpdump: listening on enp2s0f0, link-type EN10MB (Ethernet), capture size 262144 bytes

//握手请求syn包,udp src ip:192.168.0.1
1660897108.334556 0c:42:a1:4f:d1:e2 > 0c:42:a1:4f:d1:ee, ethertype IPv4 (0x0800), length 124: (tos 0x0, ttl 64, id 32118, offset 0, flags [none], proto UDP (17), length 110)
192.168.0.1.56773 > 192.168.0.3.otv: [bad udp cksum 0x81c0 -> 0x459f!] OTV, flags [I] (0x08), overlay 0, instance 1
56:fa:69:e3:dc:6b > 4e:95:a9:e2:ed:28, ethertype IPv4 (0x0800), length 74: (tos 0x0, ttl 63, id 41108, offset 0, flags [DF], proto TCP (6), length 60)
172.19.0.6.35118 > 172.19.2.39.http: Flags [S], cksum 0x10c8 (correct), seq 582983385, win 64860, options [mss 1410,sackOK,TS val 2648241865 ecr 0,nop,wscale 7], length 0

//对端回复syn包, 注意udp的目标ip:1.1.1.198,应该是 192.168.0.1 才对,mac是192.168.0.1 的,mac和ip不匹配,所以被内核扔掉(但是icmp不会被扔,原因未知)
1660897108.334738 0c:42:a1:4f:d1:ee > 0c:42:a1:4f:d1:e2, ethertype IPv4 (0x0800), length 124: (tos 0x0, ttl 64, id 41433, offset 0, flags [none], proto UDP (17), length 110)
192.168.0.3.38086 > 1.1.1.198.otv: [bad udp cksum 0x5aff -> 0x1769!] OTV, flags [I] (0x08), overlay 0, instance 1
4e:95:a9:e2:ed:28 > 56:fa:69:e3:dc:6b, ethertype IPv4 (0x0800), length 74: (tos 0x0, ttl 63, id 0, offset 0, flags [DF], proto TCP (6), length 60)
172.19.2.39.http > 172.19.0.6.35118: Flags [S.], cksum 0x8027 (correct), seq 3633913151, ack 582983386, win 64308, options [mss 1410,sackOK,TS val 3514485603 ecr 2648241865,nop,wscale 7], length 0

//没有回复第三次握手,继续发syn,因为收到syn+ack后被扔掉了
1660897109.363382 0c:42:a1:4f:d1:e2 > 0c:42:a1:4f:d1:ee, ethertype IPv4 (0x0800), length 124: (tos 0x0, ttl 64, id 32123, offset 0, flags [none], proto UDP (17), length 110)
192.168.0.1.60933 > 192.168.0.3.otv: [bad udp cksum 0x81c0 -> 0x355f!] OTV, flags [I] (0x08), overlay 0, instance 1
56:fa:69:e3:dc:6b > 4e:95:a9:e2:ed:28, ethertype IPv4 (0x0800), length 74: (tos 0x0, ttl 63, id 41109, offset 0, flags [DF], proto TCP (6), length 60)
172.19.0.6.35118 > 172.19.2.39.http: Flags [S], cksum 0x0cc3 (correct), seq 582983385, win 64860, options [mss 1410,sackOK,TS val 2648242894 ecr 0,nop,wscale 7], length 0

多ip宿主机的网卡及路由

1
2
3
4
5
6
7
8
9
10
11
12
13
14
15
16
17
18
19
5: enp125s0f3: <BROADCAST,MULTICAST,UP,LOWER_UP> mtu 1500 qdisc fq_codel state UP group default qlen 1000
link/ether 64:2c:ac:e9:78:3d brd ff:ff:ff:ff:ff:ff
inet 1.1.1.198/25 brd 1.1.1.255 scope global dynamic noprefixroute enp125s0f3
valid_lft 12463sec preferred_lft 12463sec
inet6 fe80::859a:7861:378e:d6ac/64 scope link noprefixroute
valid_lft forever preferred_lft forever
6: enp2s0f0: <BROADCAST,MULTICAST,UP,LOWER_UP> mtu 1500 qdisc mq state UP group default qlen 1000
link/ether 0c:42:a1:4f:d1:e2 brd ff:ff:ff:ff:ff:ff
inet 192.168.0.1/24 brd 192.168.0.255 scope global noprefixroute enp2s0f0
valid_lft forever preferred_lft forever

#ip route
default via 1.1.1.254 dev enp125s0f3 proto dhcp metric 101
1.1.1.128/25 dev enp125s0f3 proto kernel scope link src 1.1.1.198 metric 101
172.17.0.0/16 dev docker0 proto kernel scope link src 172.17.0.1 linkdown
172.19.0.0/24 dev cni0 proto kernel scope link src 172.19.0.1
172.19.2.0/24 via 172.19.2.0 dev flannel.1 onlink
172.19.3.0/24 via 172.19.3.0 dev flannel.1 onlink
192.168.0.0/24 dev enp2s0f0 proto kernel scope link src 192.168.0.1 metric 100

解决办法:真正生效的是 flannel.1 中的地址

1
2
3
4
5
//比如 flannel 选用了以下公网ip(默认路由上的ip)导致flannel网络不通,应该选内网ip
#ip -details link show flannel.1
29: flannel.1: <BROADCAST,MULTICAST,UP,LOWER_UP> mtu 1450 qdisc noqueue state UNKNOWN mode DEFAULT group default
link/ether 96:ad:e2:29:29:09 brd ff:ff:ff:ff:ff:ff promiscuity 0 minmtu 68 maxmtu 65535
vxlan id 1 local 30.1.1.1 dev eno1 srcport 0 0 dstport 8472 nolearning ttl auto ageing 300 udpcsum noudp6zerocsumtx noudp6zerocsumrx addrgenmode eui64 numtxqueues 1 numrxqueues 1 gso_max_size 65536 gso_max_segs 65535

解决办法得先删掉 flannel 网络,然后在 flannel.yaml 中指定内网网卡:

1
2
3
4
5
6
7
8
9
10
11
12
13
14
15
16
17
containers:
- name: kube-flannel
image: registry:5000/quay.io/coreos/flannel:v0.14.0
command:
- /opt/bin/flanneld
args:
- --ip-masq
- --kube-subnet-mgr
#指定网卡, enp33s0f0 为内网网卡,不是默认路由
#- --iface=enp33s0f0
#— --iface-regex=[enp0s8|enp0s9]

//然后会看到 flannel.1 的地址用的是 enp33s0f0(192.168.0.1)
#ip -details link show flannel.1
40: flannel.1: <BROADCAST,MULTICAST,UP,LOWER_UP> mtu 1450 qdisc noqueue state UNKNOWN mode DEFAULT group default
link/ether 92:5c:b2:af:37:62 brd ff:ff:ff:ff:ff:ff promiscuity 0 minmtu 68 maxmtu 65535
vxlan id 1 local 192.168.0.1 dev enp2s0f0 srcport 0 0 dstport 8472 nolearning ttl auto ageing 300 udpcsum noudp6zerocsumtx noudp6zerocsumrx addrgenmode eui64 numtxqueues 1 numrxqueues 1 gso_max_size 65536 gso_max_segs 65535

If you happen to have different interfaces to be matched, you can match it on a regex pattern. Let’s say the worker nodes could’ve enp0s8 or enp0s9 configured, then the flannel args would be — --iface-regex=[enp0s8|enp0s9]

修改node的annotation中flannel的 public-ip。如果因为 public-ip 不对导致网络不通,在annotation中修改public-ip没用,这个值是 flannel 读取underlay 网络配置后写进来的,同时也写到了 flannel.1 的 config 中

1
2
kubectl annotate node ky1 flannel.alpha.coreos.com/public-ip-
kubectl annotate node ky1 flannel.alpha.coreos.com/public-ip=192.168.0.1

容器调试

可以起一个容器,里面带有各种工具,然后attach 到目标容器 :https://github.com/zeromake/docker-debug/blob/master/README-zh-Hans.md

1
./docker-debug-linux-amd64 --image=CentOS8 nginx top -Hp 12 //可以先把工具安装在CentOS8,然后attach 到被调试的 nginx容器

抓包和调试 – nsenter

1
2
3
4
5
6
7
8
9
10
11
12
13
14
15
16
17
18
19
20
21
22
23
24
25
26
27
28
29
30
31
32
33
34
35
36
37
38
39
40
获取pid:docker inspect -f {{.State.Pid}} c8f874efea06

进入namespace:nsenter --net --pid --target 17277
nsenter --net --pid --target `docker inspect -f {{.State.Pid}} c8f874efea06`

//只进入network namespace,这样看到的文件还是宿主机的,能直接用tcpdump,但是看到的网卡是容器的
nsenter --target 17277 --net

// ip netns 获取容器网络信息
1022 [2021-04-14 15:53:06] docker inspect -f '{{.State.Pid}}' ab4e471edf50 //获取容器进程id
1023 [2021-04-14 15:53:30] ls /proc/79828/ns/net
1024 [2021-04-14 15:53:57] ln -sfT /proc/79828/ns/net /var/run/netns/ab4e471edf50 //link 以便ip netns List能访问

// 宿主机上查看容器ip
1026 [2021-04-14 15:54:11] ip netns list
1028 [2021-04-14 15:55:19] ip netns exec ab4e471edf50 ifconfig

//nsenter 调试网络
Get the pause container's sandboxkey:
root@worker01:~# docker inspect k8s_POD_ubuntu-5846f86795-bcbqv_default_ea44489d-3dd4-11e8-bb37-02ecc586c8d5_0 | grep SandboxKey
"SandboxKey": "/var/run/docker/netns/82ec9e32d486",
root@worker01:~#
Now, using nsenter you can see the container's information.
root@worker01:~# nsenter --net=/var/run/docker/netns/82ec9e32d486 ip addr show
1: lo: <LOOPBACK,UP,LOWER_UP> mtu 65536 qdisc noqueue state UNKNOWN group default qlen 1
link/loopback 00:00:00:00:00:00 brd 00:00:00:00:00:00
inet 127.0.0.1/8 scope host lo
valid_lft forever preferred_lft forever
3: eth0@if7: <BROADCAST,MULTICAST,UP,LOWER_UP> mtu 1450 qdisc noqueue state UP group default
link/ether 0a:58:0a:f4:01:02 brd ff:ff:ff:ff:ff:ff link-netnsid 0
inet 10.244.1.2/24 scope global eth0
valid_lft forever preferred_lft forever
Identify the peer_ifindex, and finally you can see the veth pair endpoint in root namespace.
root@worker01:~# nsenter --net=/var/run/docker/netns/82ec9e32d486 ethtool -S eth0
NIC statistics:
peer_ifindex: 7
root@worker01:~#
root@worker01:~# ip -d link show | grep '7: veth'
7: veth5e43ca47@if3: <BROADCAST,MULTICAST,UP,LOWER_UP> mtu 1450 qdisc noqueue master cni0 state UP mode DEFAULT group default
root@worker01:~#

nsenter相当于在setns的示例程序之上做了一层封装,使我们无需指定命名空间的文件描述符,而是指定进程号即可,详细case

1
2
3
4
5
6
7
8
9
10
11
12
13
14
15
16
17
18
19
#docker inspect cb7b05d82153 | grep -i SandboxKey   //根据 pause 容器id找network namespace
"SandboxKey": "/var/run/docker/netns/d6b2ef3cf886",

[root@hygon252 19:00 /root]
#nsenter --net=/var/run/docker/netns/d6b2ef3cf886 ip addr show
3: eth0@if496: <BROADCAST,MULTICAST,UP,LOWER_UP> mtu 1450 qdisc noqueue state UP group default //496对应宿主机上的veth编号
link/ether 1e:95:dd:d9:88:bd brd ff:ff:ff:ff:ff:ff link-netnsid 0
inet 192.168.3.22/24 brd 192.168.3.255 scope global eth0
valid_lft forever preferred_lft forever
#nsenter --net=/var/run/docker/netns/d6b2ef3cf886 ethtool -S eth0
NIC statistics:
peer_ifindex: 496

#ip -d -4 addr show cni0
475: cni0: <BROADCAST,MULTICAST,UP,LOWER_UP> mtu 1450 qdisc noqueue state UP group default qlen 1000
link/ether 8e:34:ba:e2:a4:c6 brd ff:ff:ff:ff:ff:ff promiscuity 0 minmtu 68 maxmtu 65535
bridge forward_delay 1500 hello_time 200 max_age 2000 ageing_time 30000 stp_state 0 priority 32768 vlan_filtering 0 vlan_protocol 802.1Q bridge_id 8000.8e:34:ba:e2:a4:c6 designated_root 8000.8e:34:ba:e2:a4:c6 root_port 0 root_path_cost 0 topology_change 0 topology_change_detected 0 hello_timer 0.00 tcn_timer 0.00 topology_change_timer 0.00 gc_timer 43.31 vlan_default_pvid 1 vlan_stats_enabled 0 group_fwd_mask 0 group_address 01:80:c2:00:00:00 mcast_snooping 1 mcast_router 1 mcast_query_use_ifaddr 0 mcast_querier 0 mcast_hash_elasticity 4 mcast_hash_max 512 mcast_last_member_count 2 mcast_startup_query_count 2 mcast_last_member_interval 100 mcast_membership_interval 26000 mcast_querier_interval 25500 mcast_query_interval 12500 mcast_query_response_interval 1000 mcast_startup_query_interval 3124 mcast_stats_enabled 0 mcast_igmp_version 2 mcast_mld_version 1 nf_call_iptables 0 nf_call_ip6tables 0 nf_call_arptables 0 numtxqueues 1 numrxqueues 1 gso_max_size 65536 gso_max_segs 65535
inet 192.168.3.1/24 brd 192.168.3.255 scope global cni0
valid_lft forever preferred_lft forever

清理

cni信息

1
2
3
4
5
6
7
8
/etc/cni/net.d/*
/var/lib/cni/ 下存放有ip分配信息

#cat /run/flannel/subnet.env
FLANNEL_NETWORK=192.168.0.0/16
FLANNEL_SUBNET=192.168.0.1/24
FLANNEL_MTU=1450
FLANNEL_IPMASQ=true

calico创建的tunl0网卡是个tunnel,可以通过 ip tunnel show来查看,清理不掉(重启可以清理掉tunl0)

1
2
3
4
5
ip link set dev tunl0 name tunl0_fallback
或者
/sbin/ip link set eth1 down
/sbin/ip link set eth1 name eth123
/sbin/ip link set eth123 up

清理和创建flannel网络

查看容器网卡和宿主机上的虚拟网卡veth pair:

1
2
ip link //宿主机上执行
cat /sys/class/net/eth0/iflink //容器中执行

清理

1
2
ip link delete cni0
ip link delete flannel.1

创建

1
2
3
4
5
6
7
8
9
ip link add cni0 type bridge
ip addr add dev cni0 172.30.0.0/24

查看A simpler solution:
ip -details link show
ls -l /sys/class/net/ - virtual ones will show all in virtual and lan is on the PCI bus.

brctl show cni0
brctl addif cni0 veth1 veth2 veth3 //往cni bridge添加多个容器peer 网卡

完全可以手工创建cni0、flannel.1等网络设备,然后将 veth添加到cni0网桥上,再在宿主机配置ip route,基本一个纯手工版本打造的flannel vxlan网络就实现了,深入理解到此任何flannel网络问题都可以解决了。

flannel ip在多个node之间分配错乱

当铲掉重新部署的时候可能cni等网络有残留,导致下一次部署会报ip已存在的错误

1
(combined from similar events): Failed create pod sandbox: rpc error: code = Unknown desc = failed to set up sandbox container "f7aa44bf81b27bf0ff6c02339df2d2743cf952c1519fead4c563892d2d41a979" network for pod "nginx-deployment-6c8c86b759-f8fb7": NetworkPlugin cni failed to set up pod "nginx-deployment-6c8c86b759-f8fb7_default" network: failed to set bridge addr: "cni0" already has an IP address different from 172.19.2.1/24

可以铲掉网卡重新分配,或者给cni重新分配错误信息提示的ip

1
ifconfig cni0 172.19.2.1/24

or

1
2
3
ip link set cni0 down && ip link set flannel.1 down 
ip link delete cni0 && ip link delete flannel.1
systemctl restart containerd && systemctl restart kubelet

host-gw

实现超级简单,就是在宿主机上配置路由规则,把其它宿主机ip当成其上所有pod的下一跳,不用封包解包,所以性能奇好,但是要求所有宿主机在一个2层网络,因为ip路由规则要求是直达其它宿主机。

手工配置实现就是vxlan的超级精简版,略!

netns 操作

以下case创建一个名为 ren 的netns,然后在里面增加一对虚拟网卡veth1 veth1_p, veth1放置在ren里面,veth1_p 放在物理机上,给他们配置上ip并up就能通了。

1
2
3
4
5
6
7
8
9
10
11
12
13
14
15
16
17
18
19
20
21
22
23
24
25
26
27
28
29
30
31
32
33
34
35
36
37
38
39
40
41
42
43
44
45
46
47
48
49
50
51
52
53
 1004  [2021-10-27 10:49:08] ip netns add ren
1005 [2021-10-27 10:49:12] ip netns show
1006 [2021-10-27 10:49:22] ip netns exec ren route //为空
1007 [2021-10-27 10:49:29] ip netns exec ren iptables -L
1008 [2021-10-27 10:49:55] ip link add veth1 type veth peer name veth1_p //此时宿主机上能看到这两块网卡
1009 [2021-10-27 10:50:07] ip link set veth1 netns ren //将veth1从宿主机默认网络空间挪到ren中,宿主机中看不到veth1了
1010 [2021-10-27 10:50:18] ip netns exec ren route
1011 [2021-10-27 10:50:25] ip netns exec ren iptables -L
1012 [2021-10-27 10:50:39] ifconfig
1013 [2021-10-27 10:50:51] ip link list
1014 [2021-10-27 10:51:29] ip netns exec ren ip link list
1017 [2021-10-27 10:53:27] ip netns exec ren ip addr add 172.19.0.100/24 dev veth1
1018 [2021-10-27 10:53:31] ip netns exec ren ip link list
1019 [2021-10-27 10:53:39] ip netns exec ren ifconfig
1020 [2021-10-27 10:53:42] ip netns exec ren ifconfig -a
1021 [2021-10-27 10:54:13] ip netns exec ren ip link set dev veth1 up
1022 [2021-10-27 10:54:16] ip netns exec ren ifconfig
1023 [2021-10-27 10:54:22] ping 172.19.0.100
1024 [2021-10-27 10:54:35] ifconfig -a
1025 [2021-10-27 10:55:03] ip netns exec ren ip addr add 172.19.0.101/24 dev veth1_p
1026 [2021-10-27 10:55:10] ip addr add 172.19.0.101/24 dev veth1_p
1027 [2021-10-27 10:55:16] ifconfig veth1_p
1028 [2021-10-27 10:55:30] ip link set dev veth1_p up
1029 [2021-10-27 10:55:32] ifconfig veth1_p
1030 [2021-10-27 10:55:38] ping 172.19.0.101
1031 [2021-10-27 10:55:43] ping 172.19.0.100
1032 [2021-10-27 10:55:53] ip link set dev veth1_p down
1033 [2021-10-27 10:55:54] ping 172.19.0.100
1034 [2021-10-27 10:55:58] ping 172.19.0.101
1035 [2021-10-27 10:56:08] ifconfig veth1_p
1036 [2021-10-27 10:56:32] ping 172.19.0.101
1037 [2021-10-27 10:57:04] ip netns exec ren route
1038 [2021-10-27 10:57:52] ip netns exec ren ping 172.19.0.101
1039 [2021-10-27 10:57:58] ip link set dev veth1_p up
1040 [2021-10-27 10:57:59] ip netns exec ren ping 172.19.0.101
1041 [2021-10-27 10:58:06] ip netns exec ren ping 172.19.0.100
1042 [2021-10-27 10:58:14] ip netns exec ren ifconfig
1043 [2021-10-27 10:58:19] ip netns exec ren route
1044 [2021-10-27 10:58:26] ip netns exec ren ping 172.19.0.100 -I veth1
1045 [2021-10-27 10:58:58] ifconfig veth1_p
1046 [2021-10-27 10:59:10] ping 172.19.0.100
1047 [2021-10-27 10:59:26] ip netns exec ren ping 172.19.0.101 -I veth1

把网卡加入到docker0的bridge下
1160 [2021-10-27 12:17:37] brctl show
1161 [2021-10-27 12:18:05] ip link set dev veth3_p master docker0
1162 [2021-10-27 12:18:09] ip link set dev veth1_p master docker0
1163 [2021-10-27 12:18:13] ip link set dev veth2 master docker0
1164 [2021-10-27 12:18:15] brctl show

brctl showmacs br0
brctl show cni0
brctl addif cni0 veth1 veth2 veth3 //往cni bridge添加多个容器peer 网卡

Linux 上存在一个默认的网络命名空间,Linux 中的 1 号进程初始使用该默认空间。Linux 上其它所有进程都是由 1 号进程派生出来的,在派生 clone 的时候如果没有额外特别指定,所有的进程都将共享这个默认网络空间。

所有的网络设备刚创建出来都是在宿主机默认网络空间下的。可以通过 ip link set 设备名 netns 网络空间名 将设备移动到另外一个空间里去,socket也是归属在某一个网络命名空间下的,由创建socket进程所在的netns来决定socket所在的netns

1
2
3
4
5
6
7
8
9
10
11
12
//file: net/socket.c
int sock_create(int family, int type, int protocol, struct socket **res)
{
return __sock_create(current->nsproxy->net_ns, family, type, protocol, res, 0);
}

//file: include/net/sock.h
static inline
void sock_net_set(struct sock *sk, struct net *net)
{
write_pnet(&sk->sk_net, net);
}

内核提供了三种操作命名空间的方式,分别是 clone、setns 和 unshare。ip netns add 使用的是 unshare,原理和 clone 是类似的。

Image

每个 net 下都包含了自己的路由表、iptable 以及内核参数配置等等

etcd 中存储的 flannel 配置

1
2
3
4
5
6
7
8
9
10
11
12
13
14
15
16
17
18
19
20
21
22
23
24
25
26
27
28
29
30
31
32
kubectl exec -it etcd-uos21 -n=kube-system -- /bin/sh

然后:
ETCDCTL_API=3 etcdctl --key /etc/kubernetes/pki/etcd/peer.key --cert /etc/kubernetes/pki/etcd/peer.crt --cacert /etc/kubernetes/pki/etcd/ca.crt --endpoints=https://localhost:2379 get /registry/configmaps/kube-system/kube-flannel-cfg

cni-conf.json�{
"name": "cbr0",
"cniVersion": "0.3.1",
"plugins": [
{
"type": "flannel",
"delegate": {
"hairpinMode": true,
"isDefaultGateway": true
}
},
{
"type": "portmap",
"capabilities": {
"portMappings": true
}
}
]
}
Z
net-conf.jsonI{
"Network": "172.19.0.0/18",
"Backend": {
"Type": "vxlan"
}
}
"

总结

通过无论是对flannel还是calico的学习,不管是使用vxlan还是host-gw发现这些所谓的overlay网络不过是披着一层udp的皮而已,只要我们对ip route/mac地址足够了解,这些新技术剖析下来仍然逃不过 RFC1180 描述的几个最基础的知识点(基础知识的力量)的使用而已,这一切硬核的基础知识无比简单,只要你多看看我这篇旧文《就是要你懂网络–一个网络包的旅程》

参考资料

https://morven.life/notes/networking-3-ipip/

https://www.cnblogs.com/bakari/p/10564347.html

https://www.cnblogs.com/goldsunshine/p/10701242.html

手工拉起flannel网络

《就是要你懂网络–一个网络包的旅程》

不同CPU性能大PK

前言

比较Hygon7280、Intel、AMD、鲲鹏920、飞腾2500的性能情况

CPU型号 Hygon 7280 AMD 7H12 AMD 7T83 Intel 8163 鲲鹏920 飞腾2500 倚天710
物理核数 32 32 64 24 48 64 128core
超线程 2 2 2 2
2 2 2 2 2 2 1
NUMA Node 8 2 4 2 4 16 2
L1d 32K 32K 32K 32K 64K 32K 64K
L2 512K 512K 512K 1024K 512K 2048K 1024K

AMD 7T83 有8个Die, 每个Die L3大小 32M,L2 大小4MiB, 每个Die上 L1I/L1D 各256KiB,每个Die有8core,2、3代都是带有独立 IO Die
倚天710是一路服务器,单芯片2块对称的 Die

image-20220528105526139

参与比较的几款CPU参数

IPC的说明:

IPC: insns per cycle insn/cycles 也就是每个时钟周期能执行的指令数量,越大程序跑的越快

程序的执行时间 = 指令数/(主频*IPC) //单核下,多核的话再除以核数

Hygon 7280

Hygon 7280 就是AMD Zen架构,最大IPC能到5.

1
2
3
4
5
6
7
8
9
10
11
12
13
14
15
16
17
18
19
20
21
22
23
24
25
26
27
28
29
30
架构:                           x86_64
CPU 运行模式: 32-bit, 64-bit
字节序: Little Endian
Address sizes: 43 bits physical, 48 bits virtual
CPU: 128
在线 CPU 列表: 0-127
每个核的线程数: 2
每个座的核数: 32
座: 2
NUMA 节点: 8
厂商 ID: HygonGenuine
CPU 系列: 24
型号: 1
型号名称: Hygon C86 7280 32-core Processor
步进: 1
CPU MHz: 2194.586
BogoMIPS: 3999.63
虚拟化: AMD-V
L1d 缓存: 2 MiB
L1i 缓存: 4 MiB
L2 缓存: 32 MiB
L3 缓存: 128 MiB
NUMA 节点0 CPU: 0-7,64-71
NUMA 节点1 CPU: 8-15,72-79
NUMA 节点2 CPU: 16-23,80-87
NUMA 节点3 CPU: 24-31,88-95
NUMA 节点4 CPU: 32-39,96-103
NUMA 节点5 CPU: 40-47,104-111
NUMA 节点6 CPU: 48-55,112-119
NUMA 节点7 CPU: 56-63,120-127

架构说明:

每个CPU有4个Die,每个Die有两个CCX(2 core-Complexes),每个CCX最多有4core(例如7280/7285)共享一个L3 cache;每个Die有两个Memory Channel,每个CPU带有8个Memory Channel,并且每个Memory Channel最多支持2根Memory;

海光7系列架构图:

img

曙光H620-G30A 机型硬件结构,CPU是hygon 7280(截图只截取了Socket0)

image-20211231202402561

AMD EPYC 7T83(NC)

两路服务器,4 numa node,Z3架构

img

image-20220902113036283

image-20220902113336705

详细信息:

1
2
3
4
5
6
7
8
9
10
11
12
13
14
15
16
17
18
19
20
21
22
23
24
25
26
27
28
29
30
31
32
33
34
35
36
37
38
39
40
41
#lscpu
Architecture: x86_64
CPU op-mode(s): 32-bit, 64-bit
Byte Order: Little Endian
CPU(s): 256
On-line CPU(s) list: 0-255
Thread(s) per core: 2
Core(s) per socket: 64
Socket(s): 2
NUMA node(s): 4
Vendor ID: AuthenticAMD
CPU family: 25
Model: 1
Model name: AMD EPYC 7T83 64-Core Processor
Stepping: 1
CPU MHz: 2154.005
CPU max MHz: 2550.0000
CPU min MHz: 1500.0000
BogoMIPS: 5090.93
Virtualization: AMD-V
L1d cache: 32K
L1i cache: 32K
L2 cache: 512K
L3 cache: 32768K
NUMA node0 CPU(s): 0-31,128-159
NUMA node1 CPU(s): 32-63,160-191
NUMA node2 CPU(s): 64-95,192-223
NUMA node3 CPU(s): 96-127,224-255

#cat /sys/devices/system/cpu/cpu{0,1,8,16,30,31,32,128}/cache/index3/shared_cpu_map
00000000,00000000,00000000,000000ff,00000000,00000000,00000000,000000ff
00000000,00000000,00000000,0000ff00,00000000,00000000,00000000,0000ff00
00000000,00000000,00000000,00ff0000,00000000,00000000,00000000,00ff0000
00000000,00000000,00000000,ff000000,00000000,00000000,00000000,ff000000
00000000,00000000,000000ff,00000000,00000000,00000000,000000ff,00000000
00000000,00000000,00000000,000000ff,00000000,00000000,00000000,000000ff

#cat /sys/devices/system/cpu/cpu0/cache/index2/shared_cpu_map
00000000,00000000,00000000,00000001,00000000,00000000,00000000,00000001

L3是8个物理核,16个超线程共享,相当于单核2MB,一块CPU有8个L3,总共是256MB

1
2
3
4
5
6
7
8
9
10
11
12
13
14
15
16
#cat cpu0/cache/index3/shared_cpu_list
0-7,128-135
#cat cpu0/cache/index3/size
32768K
#cat cpu0/cache/index2/shared_cpu_list
0,128

#cat /sys/devices/system/cpu/cpu{0,1,8,16,30,31,32,128}/cache/index3/shared_cpu_list
0-7,128-135
0-7,128-135
8-15,136-143
16-23,144-151
24-31,152-159
24-31,152-159
32-39,160-167
0-7,128-135

L1D、L1I各为 2MiB,单物理核为32KB

空跑nop的IPC为6(有点吓人)

1
2
3
4
5
6
7
8
9
10
11
12
13
14
15
16
#perf stat ./cpu/test
Performance counter stats for process id '449650':

2,574.29 msec task-clock # 1.000 CPUs utilized
0 context-switches # 0.000 K/sec
0 cpu-migrations # 0.000 K/sec
0 page-faults # 0.000 K/sec
8,985,622,182 cycles # 3.491 GHz (83.33%)
4,390,929 stalled-cycles-frontend # 0.05% frontend cycles idle (83.34%)
4,387,560,442 stalled-cycles-backend # 48.83% backend cycles idle (83.34%)
53,711,907,863 instructions # 5.98 insn per cycle
# 0.08 stalled cycles per insn (83.34%)
418,902,363 branches # 162.725 M/sec (83.34%)
15,036 branch-misses # 0.00% of all branches (83.32%)

2.574347594 seconds time elapsed

sysbench 测试7T83 比7H12 略好,可能是ECS、OS等带来的差异。

测试环境:4.19.91-011.ali4000.alios7.x86_64,5.7.34-log MySQL Community Server (GPL)

测试核数 AMD EPYC 7H12 2.5G(QPS、IPC) 说明
单核 24363 0.58 CPU跑满
一对HT 33519 0.40 CPU跑满
2物理核(0-1) 48423 0.57 CPU跑满
2物理核(0,32) 跨node 46232 0.55 CPU跑满
2物理核(0,64) 跨socket 45072 0.52 CPU跑满
4物理核(0-3) 97759 0.58 CPU跑满
16物理核(0-15) 367992 0.55 CPU跑满,sys占比20%,si 10%
32物理核(0-31) 686998 0.51 CPU跑满,sys占比20%, si 12%
64物理核(0-63) 1161079 0.50 CPU跑到95%以上,sys占比20%, si 12%
64物理核(0-31,64-95) 964441 0.49 socket2上的32核一直比较闲,数据无参考意义
64物理核(0-31,64-95) 1147846 0.48 重启mysqld,立即绑核,sysbench 在32-63上,导致0-31的CPU只能跑到89%

说明,压测过程动态通过taskset绑核,所以会有数据残留其它核的cache问题

跨socket taskset绑核的时候要压很久任务才会跨socket迁移过去,也就是刚taskset后CPU是跑不满的

1
2
3
4
5
6
7
8
9
10
11
12
13
14
15
16
17
18
19
20
#numastat -p 437803

Per-node process memory usage (in MBs) for PID 437803 (mysqld)
Node 0 Node 1 Node 2
--------------- --------------- ---------------
Huge 0.00 0.00 0.00
Heap 1.15 0.00 5403.27
Stack 0.00 0.00 0.09
Private 1921.60 16.22 10647.66
---------------- --------------- --------------- ---------------
Total 1922.75 16.22 16051.02

Node 3 Total
--------------- ---------------
Huge 0.00 0.00
Heap 0.03 5404.45
Stack 0.00 0.09
Private 16.20 12601.68
---------------- --------------- ---------------
Total 16.23 18006.22

AMD EPYC 7H12(ECS)

AMD EPYC 7H12 64-Core(ECS,非物理机),最大IPC能到5.

1
2
3
4
5
6
7
8
9
10
11
12
13
14
15
16
17
18
19
20
21
22
23
24
25
26
# lscpu
Architecture: x86_64
CPU op-mode(s): 32-bit, 64-bit
Byte Order: Little Endian
CPU(s): 64
On-line CPU(s) list: 0-63
Thread(s) per core: 2
Core(s) per socket: 16
座: 2
NUMA 节点: 2
厂商 ID: AuthenticAMD
CPU 系列: 23
型号: 49
型号名称: AMD EPYC 7H12 64-Core Processor
步进: 0
CPU MHz: 2595.124
BogoMIPS: 5190.24
虚拟化: AMD-V
超管理器厂商: KVM
虚拟化类型: 完全
L1d 缓存: 32K
L1i 缓存: 32K
L2 缓存: 512K
L3 缓存: 16384K
NUMA 节点0 CPU: 0-31
NUMA 节点1 CPU: 32-63

AMD EPYC 7T83 ECS

1
2
3
4
5
6
7
8
9
10
11
12
13
14
15
16
17
18
19
20
21
22
23
24
25
26
27
28
29
30
31
32
33
[root@bugu88 cpu0]# cd /sys/devices/system/cpu/cpu0
[root@bugu88 cpu0]# cat cache/index0/size
32K
[root@bugu88 cpu0]# cat cache/index1/size
32K
[root@bugu88 cpu0]# cat cache/index2/size
512K
[root@bugu88 cpu0]# cat cache/index3/size
32768K
[root@bugu88 cpu0]# lscpu
Architecture: x86_64
CPU op-mode(s): 32-bit, 64-bit
Byte Order: Little Endian
CPU(s): 16
On-line CPU(s) list: 0-15
Thread(s) per core: 2
Core(s) per socket: 8
座: 1
NUMA 节点: 1
厂商 ID: AuthenticAMD
CPU 系列: 25
型号: 1
型号名称: AMD EPYC 7T83 64-Core Processor
步进: 1
CPU MHz: 2545.218
BogoMIPS: 5090.43
超管理器厂商: KVM
虚拟化类型: 完全
L1d 缓存: 32K
L1i 缓存: 32K
L2 缓存: 512K
L3 缓存: 32768K
NUMA 节点0 CPU: 0-15

stream:

1
2
3
4
5
6
7
8
9
10
11
12
13
14
15
16
17
18
19
[root@bugu88 lmbench-master]# for i in $(seq 0 15); do echo $i; numactl -C $i -m 0 ./bin/stream -W 5 -N 5 -M 64M; done
0
STREAM copy latency: 0.68 nanoseconds
STREAM copy bandwidth: 23509.84 MB/sec
STREAM scale latency: 0.69 nanoseconds
STREAM scale bandwidth: 23285.51 MB/sec
STREAM add latency: 0.96 nanoseconds
STREAM add bandwidth: 25043.73 MB/sec
STREAM triad latency: 1.40 nanoseconds
STREAM triad bandwidth: 17121.79 MB/sec
1
STREAM copy latency: 0.68 nanoseconds
STREAM copy bandwidth: 23513.96 MB/sec
STREAM scale latency: 0.68 nanoseconds
STREAM scale bandwidth: 23580.06 MB/sec
STREAM add latency: 0.96 nanoseconds
STREAM add bandwidth: 25049.96 MB/sec
STREAM triad latency: 1.35 nanoseconds
STREAM triad bandwidth: 17741.93 MB/sec

Intel 8163

这次对比测试的Intel 8163 CPU信息如下,最大IPC 是4:

1
2
3
4
5
6
7
8
9
10
11
12
13
14
15
16
17
18
19
20
21
22
23
24
25
26
27
28
29
30
31
32
33
34
35
36
37
38
39
40
41
42
43
44
45
46
47
48
49
50
51
52
53
#lscpu
Architecture: x86_64
CPU op-mode(s): 32-bit, 64-bit
Byte Order: Little Endian
CPU(s): 96
On-line CPU(s) list: 0-95
Thread(s) per core: 2
Core(s) per socket: 24
Socket(s): 2
NUMA node(s): 1
Vendor ID: GenuineIntel
CPU family: 6
Model: 85
Model name: Intel(R) Xeon(R) Platinum 8163 CPU @ 2.50GHz
Stepping: 4
CPU MHz: 2499.121
CPU max MHz: 3100.0000
CPU min MHz: 1000.0000
BogoMIPS: 4998.90
Virtualization: VT-x
L1d cache: 32K
L1i cache: 32K
L2 cache: 1024K
L3 cache: 33792K
NUMA node0 CPU(s): 0-95

-----8269CY
#lscpu
Architecture: x86_64
CPU op-mode(s): 32-bit, 64-bit
Byte Order: Little Endian
CPU(s): 104
On-line CPU(s) list: 0-103
Thread(s) per core: 2
Core(s) per socket: 26
Socket(s): 2
NUMA node(s): 2
Vendor ID: GenuineIntel
CPU family: 6
Model: 85
Model name: Intel(R) Xeon(R) Platinum 8269CY CPU @ 2.50GHz
Stepping: 7
CPU MHz: 3200.000
CPU max MHz: 3800.0000
CPU min MHz: 1200.0000
BogoMIPS: 4998.89
Virtualization: VT-x
L1d cache: 32K
L1i cache: 32K
L2 cache: 1024K
L3 cache: 36608K
NUMA node0 CPU(s): 0-25,52-77
NUMA node1 CPU(s): 26-51,78-103

不同 intel 型号的差异

如下图是8269CY和E5-2682上跑的MySQL在相同业务、相同流量下的差异:

image-20221121105650582

CPU使用率差异(下图8051C是E5-2682,其它是 8269CY,主频也有30%的差异)

image-20221121110004127

鲲鹏920

1
2
3
4
5
6
7
8
9
10
11
12
13
14
15
16
17
18
19
20
21
22
23
24
25
26
27
28
29
30
31
32
33
34
35
36
37
38
39
40
41
42
43
44
[root@ARM 19:15 /root/lmbench3]
#numactl -H
available: 4 nodes (0-3)
node 0 cpus: 0 1 2 3 4 5 6 7 8 9 10 11 12 13 14 15 16 17 18 19 20 21 22 23
node 0 size: 192832 MB
node 0 free: 146830 MB
node 1 cpus: 24 25 26 27 28 29 30 31 32 33 34 35 36 37 38 39 40 41 42 43 44 45 46 47
node 1 size: 193533 MB
node 1 free: 175354 MB
node 2 cpus: 48 49 50 51 52 53 54 55 56 57 58 59 60 61 62 63 64 65 66 67 68 69 70 71
node 2 size: 193533 MB
node 2 free: 175718 MB
node 3 cpus: 72 73 74 75 76 77 78 79 80 81 82 83 84 85 86 87 88 89 90 91 92 93 94 95
node 3 size: 193532 MB
node 3 free: 183643 MB
node distances:
node 0 1 2 3
0: 10 12 20 22
1: 12 10 22 24
2: 20 22 10 12
3: 22 24 12 10

#lscpu
Architecture: aarch64
Byte Order: Little Endian
CPU(s): 96
On-line CPU(s) list: 0-95
Thread(s) per core: 1
Core(s) per socket: 48
Socket(s): 2
NUMA node(s): 4
Model: 0
CPU max MHz: 2600.0000
CPU min MHz: 200.0000
BogoMIPS: 200.00
L1d cache: 64K
L1i cache: 64K
L2 cache: 512K
L3 cache: 24576K
NUMA node0 CPU(s): 0-23
NUMA node1 CPU(s): 24-47
NUMA node2 CPU(s): 48-71
NUMA node3 CPU(s): 72-95
Flags: fp asimd evtstrm aes pmull sha1 sha2 crc32 atomics fphp asimdhp cpuid asimdrdm jscvt fcma dcpop asimddp asimdfhm

飞腾2500

飞腾2500用nop去跑IPC的话,只能到1,但是跑其它代码能到2.33

1
2
3
4
5
6
7
8
9
10
11
12
13
14
15
16
17
18
19
20
21
22
23
24
25
26
27
28
29
30
31
32
33
34
35
36
37
38
39
40
41
42
43
44
45
46
47
48
49
50
51
52
53
54
55
56
57
58
59
60
61
62
63
64
65
66
67
68
69
70
71
72
73
74
75
76
77
78
79
80
81
82
83
84
85
86
87
88
89
90
#lscpu
Architecture: aarch64
Byte Order: Little Endian
CPU(s): 128
On-line CPU(s) list: 0-127
Thread(s) per core: 1
Core(s) per socket: 64
Socket(s): 2
NUMA node(s): 16
Model: 3
BogoMIPS: 100.00
L1d cache: 32K
L1i cache: 32K
L2 cache: 2048K
L3 cache: 65536K
NUMA node0 CPU(s): 0-7
NUMA node1 CPU(s): 8-15
NUMA node2 CPU(s): 16-23
NUMA node3 CPU(s): 24-31
NUMA node4 CPU(s): 32-39
NUMA node5 CPU(s): 40-47
NUMA node6 CPU(s): 48-55
NUMA node7 CPU(s): 56-63
NUMA node8 CPU(s): 64-71
NUMA node9 CPU(s): 72-79
NUMA node10 CPU(s): 80-87
NUMA node11 CPU(s): 88-95
NUMA node12 CPU(s): 96-103
NUMA node13 CPU(s): 104-111
NUMA node14 CPU(s): 112-119
NUMA node15 CPU(s): 120-127
Flags: fp asimd evtstrm aes pmull sha1 sha2 crc32 cpuid

#perf stat ./nop
failed to read counter stalled-cycles-frontend
failed to read counter stalled-cycles-backend
failed to read counter branches

Performance counter stats for './nop':

78638.700540 task-clock (msec) # 0.999 CPUs utilized
1479 context-switches # 0.019 K/sec
55 cpu-migrations # 0.001 K/sec
37 page-faults # 0.000 K/sec
165127619524 cycles # 2.100 GHz
<not supported> stalled-cycles-frontend
<not supported> stalled-cycles-backend
165269372437 instructions # 1.00 insns per cycle
<not supported> branches
3057191 branch-misses # 0.00% of all branches

78.692839007 seconds time elapsed

#dmidecode -t processor
# dmidecode 3.0
Getting SMBIOS data from sysfs.
SMBIOS 3.2.0 present.
# SMBIOS implementations newer than version 3.0 are not
# fully supported by this version of dmidecode.

Handle 0x0004, DMI type 4, 48 bytes
Processor Information
Socket Designation: BGA3576
Type: Central Processor
Family: <OUT OF SPEC>
Manufacturer: PHYTIUM
ID: 00 00 00 00 70 1F 66 22
Version: S2500
Voltage: 0.8 V
External Clock: 50 MHz
Max Speed: 2100 MHz
Current Speed: 2100 MHz
Status: Populated, Enabled
Upgrade: Other
L1 Cache Handle: 0x0005
L2 Cache Handle: 0x0007
L3 Cache Handle: 0x0008
Serial Number: N/A
Asset Tag: No Asset Tag
Part Number: NULL
Core Count: 64
Core Enabled: 64
Thread Count: 64
Characteristics:
64-bit capable
Multi-Core
Hardware Thread
Execute Protection
Enhanced Virtualization
Power/Performance Control

其它

2Die,2node

1
2
3
4
5
6
7
8
9
10
11
12
13
14
15
16
17
18
19
20
21
22
23
24
25
26
27
28
29
30
31
32
33
34
35
36
37
38
39
40
41
42
43
44
45
46
47
48
49
50
51
52
53
54
55
56
57
58
59
60
61
62
63
64
65
66
67
68
69
70
71
72
73
74
75
#lscpu
Architecture: aarch64
Byte Order: Little Endian
CPU(s): 128
On-line CPU(s) list: 0-127
Thread(s) per core: 1
Core(s) per socket: 128
Socket(s): 1
NUMA node(s): 2
Model: 0
BogoMIPS: 100.00
L1d cache: 64K
L1i cache: 64K
L2 cache: 1024K
L3 cache: 65536K //64core share
NUMA node0 CPU(s): 0-63
NUMA node1 CPU(s): 64-127
Flags: fp asimd evtstrm aes pmull sha1 sha2 crc32 atomics fphp asimdhp cpuid asimdrdm jscvt fcma lrcpc dcpop sha3 sm3 sm4 asimddp sha512 sve asimdfhm dit uscat ilrcpc flagm ssbs sb dcpodp sve2 sveaes svepmull svebitperm svesha3 svesm4 flagm2 frint svei8mm svebf16 i8mm bf16 dgh

#cat cpu{0,1,8,16,30,31,32,127}/cache/index3/shared_cpu_list
0-63
0-63
0-63
0-63
0-63
0-63
0-63
64-127

#grep -E "core|64.000" lat.log
core:0
64.00000 59.653
core:8
64.00000 62.265
core:16
64.00000 59.411
core:24
64.00000 55.836
core:32
64.00000 55.909
core:40
64.00000 56.176
core:48
64.00000 57.240
core:56
64.00000 59.485
core:64
64.00000 131.818
core:72
64.00000 127.182
core:80
64.00000 122.452
core:88
64.00000 121.673
core:96
64.00000 126.533
core:104
64.00000 125.673
core:112
64.00000 124.188
core:120
64.00000 130.202

#numactl -H
available: 2 nodes (0-1)
node 0 cpus: 0 1 2 3 4 5 6 7 8 9 10 11 12 13 14 15 16 17 18 19 20 21 22 23 24 25 26 27 28 29 30 31 32 33 34 35 36 37 38 39 40 41 42 43 44 45 46 47 48 49 50 51 52 53 54 55 56 57 58 59 60 61 62 63
node 0 size: 515652 MB
node 0 free: 514913 MB
node 1 cpus: 64 65 66 67 68 69 70 71 72 73 74 75 76 77 78 79 80 81 82 83 84 85 86 87 88 89 90 91 92 93 94 95 96 97 98 99 100 101 102 103 104 105 106 107 108 109 110 111 112 113 114 115 116 117 118 119 120 121 122 123 124 125 126 127
node 1 size: 516086 MB
node 1 free: 514815 MB
node distances:
node 0 1
0: 10 15
1: 15 10

单核以及HT计算Prime性能比较

以上两款CPU但从物理上的指标来看似乎AMD要好很多,从工艺上AMD也要领先一代(2年),从单核参数上来说是2.0 VS 2.5GHz,但是IPC 是5 VS 4,算下来理想的单核性能刚好一致(2*5=2.5 *4)。

从外面的一些跑分结果显示也是AMD 要好,但是实际性能怎么样呢?

测试命令,这个测试命令无论在哪个CPU下,用2个物理核用时都是一个物理核的一半,所以这个计算是可以完全并行的

1
taskset -c 1 /usr/bin/sysbench --num-threads=1 --test=cpu --cpu-max-prime=50000 run //单核用一个threads,绑核; HT用2个threads,绑一对HT

测试结果为耗时,单位秒

测试项 AMD EPYC 7H12 2.5G CentOS 7.9 Hygon 7280 2.1GHz CentOS Hygon 7280 2.1GHz 麒麟 Intel 8269 2.50G Intel 8163 CPU @ 2.50GHz Intel E5-2682 v4 @ 2.50GHz
单核 prime 50000 耗时 59秒 IPC 0.56 77秒 IPC 0.55 89秒 IPC 0.56; 83 0.41 105秒 IPC 0.41 109秒 IPC 0.39
HT prime 50000 耗时 57秒 IPC 0.31 74秒 IPC 0.29 87秒 IPC 0.29 48 0.35 60秒 IPC 0.36 74秒 IPC 0.29

相同CPU下的 指令数 基本= 耗时 * IPC * 核数

以上测试结果显示Hygon 7280单核计算能力是要强过Intel 8163的,但是超线程在这个场景下太不给力,相当于没有。

当然上面的计算Prime太单纯了,代表不了复杂的业务场景,所以接下来用MySQL的查询场景来看看。

如果是arm芯片在计算prime上明显要好过x86,猜测是除法取余指令上有优化

1
2
#taskset -c 11 sysbench cpu --threads=1 --events=50000  run
sysbench 1.0.20 (using bundled LuaJIT 2.1.0-beta2)

测试结果为10秒钟的event

测试项 FT2500 2.1G 鲲鹏920-4826 2.6GHz Intel 8163 CPU @ 2.50GHz Hygon C86 7280 2.1GHz AMD 7T83
单核 prime 10秒 events 21626 IPC 0.89 30299 IPC 1.01 8435 IPC 0.41 10349 IPC 0.63 40112 IPC 1.38

对比MySQL sysbench和tpcc性能

分别将MySQL 5.7.34社区版部署到intel+AliOS以及hygon 7280+CentOS上,将mysqld绑定到单核,一样的压力配置均将CPU跑到100%,然后用sysbench测试点查, HT表示将mysqld绑定到一对HT核。

sysbench点查

测试命令类似如下:

1
sysbench --test='/usr/share/doc/sysbench/tests/db/select.lua' --oltp_tables_count=1 --report-interval=1 --oltp-table-size=10000000  --mysql-port=3307 --mysql-db=sysbench_single --mysql-user=root --mysql-password='Bj6f9g96!@#'  --max-requests=0   --oltp_skip_trx=on --oltp_auto_inc=on  --oltp_range_size=5  --mysql-table-engine=innodb --rand-init=on   --max-time=300 --mysql-host=x86.51 --num-threads=4 run

测试结果(测试中的差异AMD、Hygon CPU跑在CentOS7.9, intel CPU、Kunpeng 920 跑在AliOS上, xdb表示用集团的xdb替换社区的MySQL Server, 麒麟是国产OS):

测试核数 AMD EPYC 7H12 2.5G Hygon 7280 2.1G Hygon 7280 2.1GHz 麒麟 Intel 8269 2.50G Intel 8163 2.50G Intel 8163 2.50G XDB5.7 鲲鹏 920-4826 2.6G 鲲鹏 920-4826 2.6G XDB8.0 FT2500 alisql 8.0 本地–socket
单核 24674 0.54 13441 0.46 10236 0.39 28208 0.75 25474 0.84 29376 0.89 9694 0.49 8301 0.46 3602 0.53
一对HT 36157 0.42 21747 0.38 19417 0.37 36754 0.49 35894 0.6 40601 0.65 无HT 无HT 无HT
4物理核 94132 0.52 49822 0.46 38033 0.37 90434 0.69 350% 87254 0.73 106472 0.83 34686 0.42 28407 0.39 14232 0.53
16物理核 325409 0.48 171630 0.38 134980 0.34 371718 0.69 1500% 332967 0.72 446290 0.85 //16核比4核好! 116122 0.35 94697 0.33 59199 0.6 8core:31210 0.59
32物理核 542192 0.43 298716 0.37 255586 0.33 642548 0.64 2700% 588318 0.67 598637 0.81 CPU 2400% 228601 0.36 177424 0.32 114020 0.65
  • 麒麟OS下CPU很难跑满,大致能跑到90%-95%左右,麒麟上装的社区版MySQL-5.7.29;飞腾要特别注意mysqld所在socket,同时以上飞腾数据都是走–sock压测所得,32core走网络压测QPS为:99496(15%的网络损耗)[^说明]

Mysqld 二进制代码所在 page cache带来的性能影响

如果是飞腾跨socket影响很大,mysqld二进制跨socket性能会下降30%以上

对于鲲鹏920,双路服务器上测试,mysqld绑在node0, 但是分别将mysqld二进制load进不同的node上的page cache,然后执行点查

mysqld node0 node1 node2 node3
QPS 190120 IPC 0.40 182518 IPC 0.39 189046 IPC 0.40 186533 IPC 0.40

以上数据可以看出这里node0到node1还是很慢的,居然比跨socket还慢,反过来说鲲鹏跨socket性能很好

绑定mysqld到不同node的page cache操作

1
2
3
4
5
6
7
8
9
10
11
12
13
14
15
16
17
18
19
20
21
22
23
24
#systemctl stop mysql-server

[root@poc65 /root/vmtouch]
#vmtouch -e /usr/local/mysql/bin/mysqld
Files: 1
Directories: 0
Evicted Pages: 5916 (23M)
Elapsed: 0.00322 seconds

#vmtouch -v /usr/local/mysql/bin/mysqld
/usr/local/mysql/bin/mysqld
[ ] 0/5916

Files: 1
Directories: 0
Resident Pages: 0/5916 0/23M 0%
Elapsed: 0.000204 seconds

#taskset -c 24 md5sum /usr/local/mysql/bin/mysqld

#grep mysqld /proc/`pidof mysqld`/numa_maps //检查mysqld具体绑定在哪个node上
00400000 default file=/usr/local/mysql/bin/mysqld mapped=3392 active=1 N0=3392 kernelpagesize_kB=4
0199b000 default file=/usr/local/mysql/bin/mysqld anon=10 dirty=10 mapped=134 active=10 N0=134 kernelpagesize_kB=4
01a70000 default file=/usr/local/mysql/bin/mysqld anon=43 dirty=43 mapped=120 active=43 N0=120 kernelpagesize_kB=4

网卡以及node距离带来的性能差异

在鲲鹏920+mysql5.7+alios,将内存分配锁在node0上,然后分别绑核在1、24、48、72core,进行sysbench点查对比

Core1 Core24 Core48 Core72
QPS 10800 10400 7700 7700

以上测试的时候业务进程分配的内存全限制在node0上(下面的网卡中断测试也是同样内存结构)

1
2
3
4
5
6
7
8
9
10
#/root/numa-maps-summary.pl </proc/123853/numa_maps
N0 : 5085548 ( 19.40 GB)
N1 : 4479 ( 0.02 GB)
N2 : 1 ( 0.00 GB)
active : 0 ( 0.00 GB)
anon : 5085455 ( 19.40 GB)
dirty : 5085455 ( 19.40 GB)
kernelpagesize_kB: 2176 ( 0.01 GB)
mapmax : 348 ( 0.00 GB)
mapped : 4626 ( 0.02 GB)

对比测试,将内存锁在node3上,重复进行以上测试结果如下:

Core1 Core24 Core48 Core72
QPS 10500 10000 8100 8000
1
2
3
4
5
6
7
8
9
10
11
#/root/numa-maps-summary.pl </proc/54478/numa_maps
N0 : 16 ( 0.00 GB)
N1 : 4401 ( 0.02 GB)
N2 : 1 ( 0.00 GB)
N3 : 1779989 ( 6.79 GB)
active : 0 ( 0.00 GB)
anon : 1779912 ( 6.79 GB)
dirty : 1779912 ( 6.79 GB)
kernelpagesize_kB: 1108 ( 0.00 GB)
mapmax : 334 ( 0.00 GB)
mapped : 4548 ( 0.02 GB)

机器上网卡eth1插在node0上,由以上两组对比测试发现网卡影响比内存跨node影响更大,网卡影响有20%。而内存的影响基本看不到(就近好那么一点点,但是不明显,只能解释为cache命中率很高了)

此时软中断都在node0上,如果将软中断绑定到node3上,第72core的QPS能提升到8500,并且非常稳定。同时core0的QPS下降到10000附近。

网卡软中断以及网卡远近的测试结论

测试机器只是用了一块网卡,网卡插在node0上。

一般网卡中断会占用一些CPU,如果把网卡中断挪到其它node的core上,在鲲鹏920上测试,业务跑在node3(使用全部24core),网卡中断分别在node0和node3,QPS分别是:179000 VS 175000 (此时把中断放到node0或者是和node3最近的node2上差别不大)

如果将业务跑在node0上(全部24core),网卡中断分别在node0和node1上得到的QPS分别是:204000 VS 212000

tpcc 1000仓

测试结果(测试中Hygon 7280分别跑在CentOS7.9和麒麟上, 鲲鹏/intel CPU 跑在AliOS、麒麟是国产OS):

tpcc测试数据,结果为1000仓,tpmC (NewOrders) ,未标注CPU 则为跑满了

测试核数 Intel 8269 2.50G Intel 8163 2.50G Hygon 7280 2.1GHz 麒麟 Hygon 7280 2.1G CentOS 7.9 鲲鹏 920-4826 2.6G 鲲鹏 920-4826 2.6G XDB8.0
1物理核 12392 9902 4706 7011 6619 4653
一对HT 17892 15324 8950 11778 无HT 无HT
4物理核 51525 40877 19387 380% 30046 23959 20101
8物理核 100792 81799 39664 750% 60086 42368 40572
16物理核 160798 抖动 140488 CPU抖动 75013 1400% 106419 1300-1550% 70581 1200% 79844
24物理核 188051 164757 1600-2100% 100841 1800-2000% 130815 1600-2100% 88204 1600% 115355
32物理核 195292 185171 2000-2500% 116071 1900-2400% 142746 1800-2400% 102089 1900% 143567
48物理核 19969l 195730 2100-2600% 128188 2100-2800% 149782 2000-2700% 116374 2500% 206055 4500%

tpcc并发到一定程度后主要是锁导致性能上不去,所以超多核意义不大。

如果在Hygon 7280 2.1GHz 麒麟上起两个MySQLD实例,每个实例各绑定32物理core,性能刚好翻倍:image-20210823082702539

测试过程CPU均跑满(未跑满的话会标注出来),IPC跑不起来性能就必然低,超线程虽然总性能好了但是会导致IPC降低(参考前面的公式)。可以看到对本来IPC比较低的场景,启用超线程后一般对性能会提升更大一些。

CPU核数增加到32核后,MySQL社区版性能追平xdb, 此时sysbench使用120线程压性能较好(AMD得240线程压)

32核的时候对比下MySQL 社区版在Hygon7280和Intel 8163下的表现:

image-20210817181752243

三款CPU的性能指标

测试项 AMD EPYC 7H12 2.5G Hygon 7280 2.1GHz Intel 8163 CPU @ 2.50GHz
内存带宽(MiB/s) 12190.50 6206.06 7474.45
内存延时(遍历很大一个数组) 0.334ms 0.336ms 0.429ms

在lmbench上的测试数据

stream主要用于测试带宽,对应的时延是在带宽跑满情况下的带宽。

lat_mem_rd用来测试操作不同数据大小的时延。总的来说带宽看stream、时延看lat_mem_rd

飞腾2500

用stream测试带宽和latency,可以看到带宽随着numa距离不断减少、对应的latency不断增加,到最近的numa node有10%的损耗,这个损耗和numactl给出的距离完全一致。跨socket访问内存latency是node内的3倍,带宽是三分之一,但是socket1性能和socket0性能完全一致

1
2
3
4
5
6
7
8
9
10
11
12
13
14
15
16
17
18
19
20
21
22
23
24
25
26
27
28
29
30
31
32
33
34
35
36
37
38
39
40
41
42
43
44
45
46
47
48
49
50
51
52
53
54
55
56
57
58
59
60
61
62
63
64
65
66
67
68
69
70
71
72
73
74
75
76
77
78
79
80
81
82
83
84
85
86
87
88
89
90
91
92
93
94
95
96
time for i in $(seq 7 8 128); do echo $i; numactl -C $i -m 0 ./bin/stream -W 5 -N 5 -M 64M; done

#numactl -C 7 -m 0 ./bin/stream -W 5 -N 5 -M 64M
STREAM copy latency: 2.84 nanoseconds
STREAM copy bandwidth: 5638.21 MB/sec
STREAM scale latency: 2.72 nanoseconds
STREAM scale bandwidth: 5885.97 MB/sec
STREAM add latency: 2.26 nanoseconds
STREAM add bandwidth: 10615.13 MB/sec
STREAM triad latency: 4.53 nanoseconds
STREAM triad bandwidth: 5297.93 MB/sec

#numactl -C 7 -m 1 ./bin/stream -W 5 -N 5 -M 64M
STREAM copy latency: 3.16 nanoseconds
STREAM copy bandwidth: 5058.71 MB/sec
STREAM scale latency: 3.15 nanoseconds
STREAM scale bandwidth: 5074.78 MB/sec
STREAM add latency: 2.35 nanoseconds
STREAM add bandwidth: 10197.36 MB/sec
STREAM triad latency: 5.12 nanoseconds
STREAM triad bandwidth: 4686.37 MB/sec

#numactl -C 7 -m 2 ./bin/stream -W 5 -N 5 -M 64M
STREAM copy latency: 3.85 nanoseconds
STREAM copy bandwidth: 4150.98 MB/sec
STREAM scale latency: 3.95 nanoseconds
STREAM scale bandwidth: 4054.30 MB/sec
STREAM add latency: 2.64 nanoseconds
STREAM add bandwidth: 9100.12 MB/sec
STREAM triad latency: 6.39 nanoseconds
STREAM triad bandwidth: 3757.70 MB/sec

#numactl -C 7 -m 3 ./bin/stream -W 5 -N 5 -M 64M
STREAM copy latency: 3.69 nanoseconds
STREAM copy bandwidth: 4340.24 MB/sec
STREAM scale latency: 3.62 nanoseconds
STREAM scale bandwidth: 4422.18 MB/sec
STREAM add latency: 2.47 nanoseconds
STREAM add bandwidth: 9704.82 MB/sec
STREAM triad latency: 5.74 nanoseconds
STREAM triad bandwidth: 4177.85 MB/sec

[root@101a05001.cloud.a05.am11 /root/lmbench3]
#numactl -C 7 -m 7 ./bin/stream -W 5 -N 5 -M 64M
STREAM copy latency: 3.95 nanoseconds
STREAM copy bandwidth: 4051.51 MB/sec
STREAM scale latency: 3.94 nanoseconds
STREAM scale bandwidth: 4060.63 MB/sec
STREAM add latency: 2.54 nanoseconds
STREAM add bandwidth: 9434.51 MB/sec
STREAM triad latency: 6.13 nanoseconds
STREAM triad bandwidth: 3913.36 MB/sec

[root@101a05001.cloud.a05.am11 /root/lmbench3]
#numactl -C 7 -m 10 ./bin/stream -W 5 -N 5 -M 64M
STREAM copy latency: 8.80 nanoseconds
STREAM copy bandwidth: 1817.78 MB/sec
STREAM scale latency: 8.59 nanoseconds
STREAM scale bandwidth: 1861.65 MB/sec
STREAM add latency: 5.55 nanoseconds
STREAM add bandwidth: 4320.68 MB/sec
STREAM triad latency: 13.94 nanoseconds
STREAM triad bandwidth: 1721.76 MB/sec

[root@101a05001.cloud.a05.am11 /root/lmbench3]
#numactl -C 7 -m 11 ./bin/stream -W 5 -N 5 -M 64M
STREAM copy latency: 9.27 nanoseconds
STREAM copy bandwidth: 1726.52 MB/sec
STREAM scale latency: 9.31 nanoseconds
STREAM scale bandwidth: 1718.10 MB/sec
STREAM add latency: 5.65 nanoseconds
STREAM add bandwidth: 4250.89 MB/sec
STREAM triad latency: 14.09 nanoseconds
STREAM triad bandwidth: 1703.66 MB/sec

[root@101a05001.cloud.a05.am11 /root/lmbench3]
#numactl -C 88 -m 11 ./bin/stream -W 5 -N 5 -M 64M //在另外一个socket上测试本numa,和node0性能完全一致
STREAM copy latency: 2.93 nanoseconds
STREAM copy bandwidth: 5454.67 MB/sec
STREAM scale latency: 2.96 nanoseconds
STREAM scale bandwidth: 5400.03 MB/sec
STREAM add latency: 2.28 nanoseconds
STREAM add bandwidth: 10543.42 MB/sec
STREAM triad latency: 4.52 nanoseconds
STREAM triad bandwidth: 5308.40 MB/sec

[root@101a05001.cloud.a05.am11 /root/lmbench3]
#numactl -C 7 -m 15 ./bin/stream -W 5 -N 5 -M 64M
STREAM copy latency: 8.73 nanoseconds
STREAM copy bandwidth: 1831.77 MB/sec
STREAM scale latency: 8.81 nanoseconds
STREAM scale bandwidth: 1815.13 MB/sec
STREAM add latency: 5.63 nanoseconds
STREAM add bandwidth: 4265.21 MB/sec
STREAM triad latency: 13.09 nanoseconds
STREAM triad bandwidth: 1833.68 MB/sec

Lat_mem_rd 用cpu7访问node0和node15对比结果,随着数据的加大,延时在加大,64M时能有3倍差距,和上面测试一致

下图 第一列 表示读写数据的大小(单位M),第二列表示访问延时(单位纳秒),一般可以看到在L1/L2/L3 cache大小的地方延时会有跳跃,远超过L3大小后,延时就是内存延时了

image-20210924185044090

1
numactl -C 7 -m 0 ./bin/lat_mem_rd -W 5 -N 5 -t 64M  //-C 7 cpu 7, -m 0 node0, -W 热身 -t stride

同样的机型,开关numa的测试结果,关numa 时延、带宽都差了几倍

image-20220323153507557

关闭numa的机器上测试结果随机性很强,这应该是和内存分配在那里有关系,不过如果机器一直保持这个状态反复测试的话,快的core一直快,慢的core一直慢,这是因为物理地址分配有一定的规律,在物理内存没怎么变化的情况下,快的core恰好分到的内存比较近。

同时不同机器状态(内存使用率)测试结果也不一样

鲲鹏920

1
2
3
4
5
6
7
8
9
10
11
12
13
14
15
16
17
18
19
20
21
22
23
24
25
26
27
28
29
30
31
32
33
34
35
36
37
38
39
40
41
42
43
44
45
46
47
48
49
#for i in $(seq 0 15); do echo core:$i; numactl -N $i -m 7 ./bin/stream  -W 5 -N 5 -M 64M; done
STREAM copy latency: 1.84 nanoseconds
STREAM copy bandwidth: 8700.75 MB/sec
STREAM scale latency: 1.86 nanoseconds
STREAM scale bandwidth: 8623.60 MB/sec
STREAM add latency: 2.18 nanoseconds
STREAM add bandwidth: 10987.04 MB/sec
STREAM triad latency: 3.03 nanoseconds
STREAM triad bandwidth: 7926.87 MB/sec

#numactl -C 7 -m 1 ./bin/stream -W 5 -N 5 -M 64M
STREAM copy latency: 2.05 nanoseconds
STREAM copy bandwidth: 7802.45 MB/sec
STREAM scale latency: 2.08 nanoseconds
STREAM scale bandwidth: 7681.87 MB/sec
STREAM add latency: 2.19 nanoseconds
STREAM add bandwidth: 10954.76 MB/sec
STREAM triad latency: 3.17 nanoseconds
STREAM triad bandwidth: 7559.86 MB/sec

#numactl -C 7 -m 2 ./bin/stream -W 5 -N 5 -M 64M
STREAM copy latency: 3.51 nanoseconds
STREAM copy bandwidth: 4556.86 MB/sec
STREAM scale latency: 3.58 nanoseconds
STREAM scale bandwidth: 4463.66 MB/sec
STREAM add latency: 2.71 nanoseconds
STREAM add bandwidth: 8869.79 MB/sec
STREAM triad latency: 5.92 nanoseconds
STREAM triad bandwidth: 4057.12 MB/sec

#numactl -C 7 -m 3 ./bin/stream -W 5 -N 5 -M 64M
STREAM copy latency: 3.94 nanoseconds
STREAM copy bandwidth: 4064.25 MB/sec
STREAM scale latency: 3.82 nanoseconds
STREAM scale bandwidth: 4188.67 MB/sec
STREAM add latency: 2.86 nanoseconds
STREAM add bandwidth: 8390.70 MB/sec
STREAM triad latency: 4.78 nanoseconds
STREAM triad bandwidth: 5024.25 MB/sec

#numactl -C 24 -m 3 ./bin/stream -W 5 -N 5 -M 64M
STREAM copy latency: 4.10 nanoseconds
STREAM copy bandwidth: 3904.63 MB/sec
STREAM scale latency: 4.03 nanoseconds
STREAM scale bandwidth: 3969.41 MB/sec
STREAM add latency: 3.07 nanoseconds
STREAM add bandwidth: 7816.08 MB/sec
STREAM triad latency: 5.06 nanoseconds
STREAM triad bandwidth: 4738.66 MB/sec

海光7280

可以看到跨numa(一个numa也就是一个socket,等同于跨socket)RT从1.5上升到2.5,这个数据比鲲鹏920要好很多

1
2
3
4
5
6
7
8
9
10
11
12
13
14
15
16
17
18
19
20
21
22
23
24
25
26
27
28
29
30
31
32
33
34
35
36
37
38
39
40
41
42
43
44
45
46
47
48
49
50
51
52
53
54
55
56
57
58
59
60
61
62
63
64
65
66
67
68
69
70
71
72
73
74
75
76
77
78
79
80
81
[root@hygon8 14:32 /root/lmbench-master]
#lscpu
架构: x86_64
CPU 运行模式: 32-bit, 64-bit
字节序: Little Endian
Address sizes: 43 bits physical, 48 bits virtual
CPU: 128
在线 CPU 列表: 0-127
每个核的线程数: 2
每个座的核数: 32
座: 2
NUMA 节点: 8
厂商 ID: HygonGenuine
CPU 系列: 24
型号: 1
型号名称: Hygon C86 7280 32-core Processor
步进: 1
CPU MHz: 2194.586
BogoMIPS: 3999.63
虚拟化: AMD-V
L1d 缓存: 2 MiB
L1i 缓存: 4 MiB
L2 缓存: 32 MiB
L3 缓存: 128 MiB
NUMA 节点0 CPU: 0-7,64-71
NUMA 节点1 CPU: 8-15,72-79
NUMA 节点2 CPU: 16-23,80-87
NUMA 节点3 CPU: 24-31,88-95
NUMA 节点4 CPU: 32-39,96-103
NUMA 节点5 CPU: 40-47,104-111
NUMA 节点6 CPU: 48-55,112-119
NUMA 节点7 CPU: 56-63,120-127

//可以看到7号core比15、23、31号core明显要快,就近访问node 0的内存,跨numa node(跨Die)没有内存交织分配
[root@hygon8 14:32 /root/lmbench-master]
#time for i in $(seq 7 8 64); do echo $i; numactl -C $i -m 0 ./bin/stream -W 5 -N 5 -M 64M; done
7
STREAM copy latency: 1.38 nanoseconds
STREAM copy bandwidth: 11559.53 MB/sec
STREAM scale latency: 1.16 nanoseconds
STREAM scale bandwidth: 13815.87 MB/sec
STREAM add latency: 1.40 nanoseconds
STREAM add bandwidth: 17145.85 MB/sec
STREAM triad latency: 1.44 nanoseconds
STREAM triad bandwidth: 16637.18 MB/sec
15
STREAM copy latency: 1.67 nanoseconds
STREAM copy bandwidth: 9591.77 MB/sec
STREAM scale latency: 1.56 nanoseconds
STREAM scale bandwidth: 10242.50 MB/sec
STREAM add latency: 1.45 nanoseconds
STREAM add bandwidth: 16581.00 MB/sec
STREAM triad latency: 2.00 nanoseconds
STREAM triad bandwidth: 12028.83 MB/sec
23
STREAM copy latency: 1.65 nanoseconds
STREAM copy bandwidth: 9701.49 MB/sec
STREAM scale latency: 1.53 nanoseconds
STREAM scale bandwidth: 10427.98 MB/sec
STREAM add latency: 1.42 nanoseconds
STREAM add bandwidth: 16846.10 MB/sec
STREAM triad latency: 1.97 nanoseconds
STREAM triad bandwidth: 12189.72 MB/sec
31
STREAM copy latency: 1.64 nanoseconds
STREAM copy bandwidth: 9742.86 MB/sec
STREAM scale latency: 1.52 nanoseconds
STREAM scale bandwidth: 10510.80 MB/sec
STREAM add latency: 1.45 nanoseconds
STREAM add bandwidth: 16559.86 MB/sec
STREAM triad latency: 1.92 nanoseconds
STREAM triad bandwidth: 12490.01 MB/sec
39
STREAM copy latency: 2.55 nanoseconds
STREAM copy bandwidth: 6286.25 MB/sec
STREAM scale latency: 2.51 nanoseconds
STREAM scale bandwidth: 6383.11 MB/sec
STREAM add latency: 1.76 nanoseconds
STREAM add bandwidth: 13660.83 MB/sec
STREAM triad latency: 3.68 nanoseconds
STREAM triad bandwidth: 6523.02 MB/sec

如果这种芯片在bios里设置Die interleaving,4块die当成一个numa node吐出来给OS

1
2
3
4
5
6
7
8
9
10
11
12
13
14
15
16
17
18
19
20
21
22
23
24
25
26
27
28
29
30
31
32
33
34
35
36
37
38
39
40
41
42
43
44
45
46
47
48
49
50
51
52
53
54
55
56
57
58
59
60
61
62
63
64
65
66
67
68
69
70
71
72
73
74
75
76
77
78
79
80
81
82
#lscpu
架构: x86_64
CPU 运行模式: 32-bit, 64-bit
字节序: Little Endian
Address sizes: 43 bits physical, 48 bits virtual
CPU: 128
在线 CPU 列表: 0-127
每个核的线程数: 2
每个座的核数: 32
座: 2
NUMA 节点: 2
厂商 ID: HygonGenuine
CPU 系列: 24
型号: 1
型号名称: Hygon C86 7280 32-core Processor
步进: 1
CPU MHz: 2108.234
BogoMIPS: 3999.45
虚拟化: AMD-V
L1d 缓存: 2 MiB
L1i 缓存: 4 MiB
L2 缓存: 32 MiB
L3 缓存: 128 MiB
//注意这里和真实物理架构不一致,bios配置了Die Interleaving Enable
//表示每路内多个Die内存交织分配,这样整个一路就是一个大Die
NUMA 节点0 CPU: 0-31,64-95
NUMA 节点1 CPU: 32-63,96-127


//enable die interleaving 后继续streaming测试
//最终测试结果表现就是7/15/23/31 core性能一致,因为默认一个numa内内存交织分配
//可以看到同一路下的四个die内存交织访问,所以4个node内存延时一样了(被平均),都不如就近快
[root@hygon3 16:09 /root/lmbench-master]
#time for i in $(seq 7 8 64); do echo $i; numactl -C $i -m 0 ./bin/stream -W 5 -N 5 -M 64M; done
7
STREAM copy latency: 1.48 nanoseconds
STREAM copy bandwidth: 10782.58 MB/sec
STREAM scale latency: 1.20 nanoseconds
STREAM scale bandwidth: 13364.38 MB/sec
STREAM add latency: 1.46 nanoseconds
STREAM add bandwidth: 16408.32 MB/sec
STREAM triad latency: 1.53 nanoseconds
STREAM triad bandwidth: 15696.00 MB/sec
15
STREAM copy latency: 1.51 nanoseconds
STREAM copy bandwidth: 10601.25 MB/sec
STREAM scale latency: 1.24 nanoseconds
STREAM scale bandwidth: 12855.87 MB/sec
STREAM add latency: 1.46 nanoseconds
STREAM add bandwidth: 16382.42 MB/sec
STREAM triad latency: 1.53 nanoseconds
STREAM triad bandwidth: 15691.48 MB/sec
23
STREAM copy latency: 1.50 nanoseconds
STREAM copy bandwidth: 10700.61 MB/sec
STREAM scale latency: 1.27 nanoseconds
STREAM scale bandwidth: 12634.63 MB/sec
STREAM add latency: 1.47 nanoseconds
STREAM add bandwidth: 16370.67 MB/sec
STREAM triad latency: 1.55 nanoseconds
STREAM triad bandwidth: 15455.75 MB/sec
31
STREAM copy latency: 1.50 nanoseconds
STREAM copy bandwidth: 10637.39 MB/sec
STREAM scale latency: 1.25 nanoseconds
STREAM scale bandwidth: 12778.99 MB/sec
STREAM add latency: 1.46 nanoseconds
STREAM add bandwidth: 16420.65 MB/sec
STREAM triad latency: 1.61 nanoseconds
STREAM triad bandwidth: 14946.80 MB/sec
39
STREAM copy latency: 2.35 nanoseconds
STREAM copy bandwidth: 6807.09 MB/sec
STREAM scale latency: 2.32 nanoseconds
STREAM scale bandwidth: 6906.93 MB/sec
STREAM add latency: 1.63 nanoseconds
STREAM add bandwidth: 14729.23 MB/sec
STREAM triad latency: 3.36 nanoseconds
STREAM triad bandwidth: 7151.67 MB/sec
47
STREAM copy latency: 2.31 nanoseconds
STREAM copy bandwidth: 6938.47 MB/sec

以华为泰山服务器(鲲鹏920芯片)配置为例image-20211228165542167

Die Interleaving 控制是否使能DIE交织。使能DIE交织能充分利用系统的DDR带宽,并尽量保证各DDR通道的带宽均衡,提升DDR的利用率

hygon5280测试数据

1
2
3
4
5
6
7
8
9
10
11
12
13
14
15
16
17
18
19
20
21
22
23
24
25
26
27
28
29
30
31
32
33
34
35
36
37
38
39
40
41
42
43
44
45
46
47
48
49
50
51
52
53
54
55
56
57
58
59
60
61
62
63
64
65
66
67
68
69
70
71
72
73
74
75
76
77
78
79
80
81
82
83
84
85
86
87
88
89
90
-----hygon5280测试数据
[root@localhost lmbench-master]# for i in $(seq 0 8 24); do echo $i; numactl -C $i -m 0 ./bin/stream -W 5 -N 5 -M 64M; done
0
STREAM copy latency: 1.22 nanoseconds
STREAM copy bandwidth: 13166.34 MB/sec
STREAM scale latency: 1.13 nanoseconds
STREAM scale bandwidth: 14166.95 MB/sec
STREAM add latency: 1.15 nanoseconds
STREAM add bandwidth: 20818.63 MB/sec
STREAM triad latency: 1.39 nanoseconds
STREAM triad bandwidth: 17211.81 MB/sec
8
STREAM copy latency: 1.56 nanoseconds
STREAM copy bandwidth: 10273.07 MB/sec
STREAM scale latency: 1.50 nanoseconds
STREAM scale bandwidth: 10701.89 MB/sec
STREAM add latency: 1.20 nanoseconds
STREAM add bandwidth: 19996.68 MB/sec
STREAM triad latency: 1.93 nanoseconds
STREAM triad bandwidth: 12443.70 MB/sec
16
STREAM copy latency: 2.52 nanoseconds
STREAM copy bandwidth: 6357.71 MB/sec
STREAM scale latency: 2.48 nanoseconds
STREAM scale bandwidth: 6454.95 MB/sec
STREAM add latency: 1.67 nanoseconds
STREAM add bandwidth: 14362.51 MB/sec
STREAM triad latency: 3.65 nanoseconds
STREAM triad bandwidth: 6572.85 MB/sec
24
STREAM copy latency: 2.44 nanoseconds
STREAM copy bandwidth: 6554.24 MB/sec
STREAM scale latency: 2.41 nanoseconds
STREAM scale bandwidth: 6642.80 MB/sec
STREAM add latency: 1.44 nanoseconds
STREAM add bandwidth: 16695.82 MB/sec
STREAM triad latency: 3.61 nanoseconds
STREAM triad bandwidth: 6639.18 MB/sec
[root@localhost lmbench-master]# lscpu
架构: x86_64
CPU 运行模式: 32-bit, 64-bit
字节序: Little Endian
Address sizes: 43 bits physical, 48 bits virtual
CPU: 64
在线 CPU 列表: 0-63
每个核的线程数: 2
每个座的核数: 16
座: 2
NUMA 节点: 4
厂商 ID: HygonGenuine
CPU 系列: 24
型号: 1
型号名称: Hygon C86 5280 16-core Processor
步进: 1
Frequency boost: enabled
CPU MHz: 2799.311
CPU 最大 MHz: 2500.0000
CPU 最小 MHz: 1600.0000
BogoMIPS: 4999.36
虚拟化: AMD-V
L1d 缓存: 1 MiB
L1i 缓存: 2 MiB
L2 缓存: 16 MiB
L3 缓存: 64 MiB
NUMA 节点0 CPU: 0-7,32-39
NUMA 节点1 CPU: 8-15,40-47
NUMA 节点2 CPU: 16-23,48-55
NUMA 节点3 CPU: 24-31,56-63
Vulnerability Itlb multihit: Not affected
Vulnerability L1tf: Not affected
Vulnerability Mds: Not affected
Vulnerability Meltdown: Not affected
Vulnerability Spec store bypass: Mitigation; Speculative Store Bypass disabled via prctl and seccomp
Vulnerability Spectre v1: Mitigation; usercopy/swapgs barriers and __user pointer sanitization
Vulnerability Spectre v2: Mitigation; Full AMD retpoline, IBPB conditional, STIBP disabled, RSB
filling
Vulnerability Srbds: Not affected
Vulnerability Tsx async abort: Not affected
标记: fpu vme de pse tsc msr pae mce cx8 apic sep mtrr pge mca cmov pat pse3
6 clflush mmx fxsr sse sse2 ht syscall nx mmxext fxsr_opt pdpe1gb rdts
cp lm constant_tsc rep_good nopl nonstop_tsc cpuid extd_apicid amd_dcm
aperfmperf pni pclmulqdq monitor ssse3 fma cx16 sse4_1 sse4_2 movbe p
opcnt xsave avx f16c rdrand lahf_lm cmp_legacy svm extapic cr8_legacy
abm sse4a misalignsse 3dnowprefetch osvw skinit wdt tce topoext perfct
r_core perfctr_nb bpext perfctr_llc mwaitx cpb hw_pstate sme ssbd sev
ibpb vmmcall fsgsbase bmi1 avx2 smep bmi2 rdseed adx smap clflushopt s
ha_ni xsaveopt xsavec xgetbv1 xsaves clzero irperf xsaveerptr arat npt
lbrv svm_lock nrip_save tsc_scale vmcb_clean flushbyasid decodeassist
s pausefilter pfthreshold avic v_vmsave_vmload vgif overflow_recov suc
cor smca

intel 8269CY

1
2
3
4
5
6
7
8
9
10
11
12
13
14
15
16
17
18
19
20
21
22
23
24
25
26
27
28
29
30
31
32
33
34
35
36
37
38
39
40
41
42
43
44
45
46
47
48
49
50
51
52
53
54
55
56
57
58
59
60
61
62
63
64
65
66
67
68
69
70
71
72
73
74
lscpu
Architecture: x86_64
CPU op-mode(s): 32-bit, 64-bit
Byte Order: Little Endian
CPU(s): 104
On-line CPU(s) list: 0-103
Thread(s) per core: 2
Core(s) per socket: 26
Socket(s): 2
NUMA node(s): 2
Vendor ID: GenuineIntel
CPU family: 6
Model: 85
Model name: Intel(R) Xeon(R) Platinum 8269CY CPU @ 2.50GHz
Stepping: 7
CPU MHz: 3200.000
CPU max MHz: 3800.0000
CPU min MHz: 1200.0000
BogoMIPS: 4998.89
Virtualization: VT-x
L1d cache: 32K
L1i cache: 32K
L2 cache: 1024K
L3 cache: 36608K
NUMA node0 CPU(s): 0-25,52-77
NUMA node1 CPU(s): 26-51,78-103

[root@numaopen.cloud.et93 /home/ren/lmbench3]
#time for i in $(seq 0 8 51); do echo $i; numactl -C $i -m 0 ./bin/stream -W 5 -N 5 -M 64M; done
0
STREAM copy latency: 1.15 nanoseconds
STREAM copy bandwidth: 13941.80 MB/sec
STREAM scale latency: 1.16 nanoseconds
STREAM scale bandwidth: 13799.89 MB/sec
STREAM add latency: 1.31 nanoseconds
STREAM add bandwidth: 18318.23 MB/sec
STREAM triad latency: 1.56 nanoseconds
STREAM triad bandwidth: 15356.72 MB/sec
16
STREAM copy latency: 1.12 nanoseconds
STREAM copy bandwidth: 14293.68 MB/sec
STREAM scale latency: 1.13 nanoseconds
STREAM scale bandwidth: 14162.47 MB/sec
STREAM add latency: 1.31 nanoseconds
STREAM add bandwidth: 18293.27 MB/sec
STREAM triad latency: 1.53 nanoseconds
STREAM triad bandwidth: 15692.47 MB/sec
32
STREAM copy latency: 1.52 nanoseconds
STREAM copy bandwidth: 10551.71 MB/sec
STREAM scale latency: 1.52 nanoseconds
STREAM scale bandwidth: 10508.33 MB/sec
STREAM add latency: 1.38 nanoseconds
STREAM add bandwidth: 17363.22 MB/sec
STREAM triad latency: 2.00 nanoseconds
STREAM triad bandwidth: 12024.52 MB/sec
40
STREAM copy latency: 1.49 nanoseconds
STREAM copy bandwidth: 10758.50 MB/sec
STREAM scale latency: 1.50 nanoseconds
STREAM scale bandwidth: 10680.17 MB/sec
STREAM add latency: 1.34 nanoseconds
STREAM add bandwidth: 17948.34 MB/sec
STREAM triad latency: 1.98 nanoseconds
STREAM triad bandwidth: 12133.22 MB/sec
48
STREAM copy latency: 1.49 nanoseconds
STREAM copy bandwidth: 10736.56 MB/sec
STREAM scale latency: 1.50 nanoseconds
STREAM scale bandwidth: 10692.93 MB/sec
STREAM add latency: 1.34 nanoseconds
STREAM add bandwidth: 17902.85 MB/sec
STREAM triad latency: 1.96 nanoseconds
STREAM triad bandwidth: 12239.44 MB/sec

Intel(R) Xeon(R) CPU E5-2682 v4

1
2
3
4
5
6
7
8
9
10
11
12
13
14
15
16
17
18
19
20
21
22
23
24
25
26
27
28
29
30
31
32
33
34
35
36
37
38
39
40
41
42
43
44
45
46
47
48
49
50
51
52
53
54
55
56
57
58
59
60
61
62
63
64
#time for i in $(seq 0 8 51); do echo $i; numactl -C $i -m 0 ./bin/stream -W 5 -N 5 -M 64M; done
0
STREAM copy latency: 1.59 nanoseconds
STREAM copy bandwidth: 10092.31 MB/sec
STREAM scale latency: 1.57 nanoseconds
STREAM scale bandwidth: 10169.16 MB/sec
STREAM add latency: 1.31 nanoseconds
STREAM add bandwidth: 18360.83 MB/sec
STREAM triad latency: 2.28 nanoseconds
STREAM triad bandwidth: 10503.81 MB/sec
8
STREAM copy latency: 1.55 nanoseconds
STREAM copy bandwidth: 10312.14 MB/sec
STREAM scale latency: 1.56 nanoseconds
STREAM scale bandwidth: 10283.70 MB/sec
STREAM add latency: 1.30 nanoseconds
STREAM add bandwidth: 18416.26 MB/sec
STREAM triad latency: 2.23 nanoseconds
STREAM triad bandwidth: 10777.08 MB/sec
16
STREAM copy latency: 2.02 nanoseconds
STREAM copy bandwidth: 7914.25 MB/sec
STREAM scale latency: 2.02 nanoseconds
STREAM scale bandwidth: 7919.85 MB/sec
STREAM add latency: 1.39 nanoseconds
STREAM add bandwidth: 17276.06 MB/sec
STREAM triad latency: 2.92 nanoseconds
STREAM triad bandwidth: 8231.18 MB/sec
24
STREAM copy latency: 1.99 nanoseconds
STREAM copy bandwidth: 8032.18 MB/sec
STREAM scale latency: 1.98 nanoseconds
STREAM scale bandwidth: 8061.12 MB/sec
STREAM add latency: 1.39 nanoseconds
STREAM add bandwidth: 17313.94 MB/sec
STREAM triad latency: 2.88 nanoseconds
STREAM triad bandwidth: 8318.93 MB/sec

#lscpu
Architecture: x86_64
CPU op-mode(s): 32-bit, 64-bit
Byte Order: Little Endian
CPU(s): 64
On-line CPU(s) list: 0-63
Thread(s) per core: 2
Core(s) per socket: 16
Socket(s): 2
NUMA node(s): 2
Vendor ID: GenuineIntel
CPU family: 6
Model: 79
Model name: Intel(R) Xeon(R) CPU E5-2682 v4 @ 2.50GHz
Stepping: 1
CPU MHz: 2500.000
CPU max MHz: 3000.0000
CPU min MHz: 1200.0000
BogoMIPS: 5000.06
Virtualization: VT-x
L1d cache: 32K
L1i cache: 32K
L2 cache: 256K
L3 cache: 40960K
NUMA node0 CPU(s): 0-15,32-47
NUMA node1 CPU(s): 16-31,48-63

AMD EPYC 7T83

1
2
3
4
5
6
7
8
9
10
11
12
13
14
15
16
17
18
19
20
21
22
23
24
25
26
27
28
29
30
31
32
33
34
35
36
37
38
39
40
41
42
43
44
45
46
47
48
49
50
51
52
53
54
55
56
57
58
59
60
61
62
63
64
65
66
67
68
69
70
71
72
73
74
75
76
77
78
79
80
81
82
83
84
85
86
87
88
89
90
91
92
93
94
95
96
97
98
99
100
101
102
103
104
105
106
107
108
109
110
111
112
113
114
115
116
117
118
119
120
121
122
123
124
125
126
127
128
129
130
131
132
133
134
135
136
137
138
139
140
141
142
143
144
145
146
147
148
149
150
151
152
153
154
155
156
157
158
159
160
161
162
163
164
165
166
167
168
169
170
171
172
173
174
175
176
177
178
179
180
181
182
183
184
185
186
187
188
189
190
191
192
193
194
195
196
197
198
199
200
201
202
203
204
205
206
207
208
209
210
211
212
213
214
215
216
217
218
219
220
221
222
223
224
225
226
227
228
229
230
231
232
233
234
235
236
237
238
239
240
241
242
243
244
245
246
247
248
249
250
251
252
253
254
255
256
257
258
259
260
261
262
263
264
265
266
267
268
269
270
271
272
273
274
275
276
277
278
279
280
281
282
283
284
285
286
287
288
289
#time for i in $(seq 0 8 255); do echo $i; numactl -C $i -m 0 ./bin/stream -W 5 -N 5 -M 64M; done
0
STREAM copy latency: 0.49 nanoseconds
STREAM copy bandwidth: 32561.30 MB/sec
STREAM scale latency: 0.49 nanoseconds
STREAM scale bandwidth: 32620.66 MB/sec
STREAM add latency: 0.87 nanoseconds
STREAM add bandwidth: 27575.20 MB/sec
STREAM triad latency: 0.70 nanoseconds
STREAM triad bandwidth: 34397.15 MB/sec
8
STREAM copy latency: 0.52 nanoseconds
STREAM copy bandwidth: 30764.47 MB/sec
STREAM scale latency: 0.53 nanoseconds
STREAM scale bandwidth: 30056.59 MB/sec
STREAM add latency: 0.87 nanoseconds
STREAM add bandwidth: 27575.20 MB/sec
STREAM triad latency: 0.69 nanoseconds
STREAM triad bandwidth: 34789.45 MB/sec
16
STREAM copy latency: 0.53 nanoseconds
STREAM copy bandwidth: 30173.15 MB/sec
STREAM scale latency: 0.54 nanoseconds
STREAM scale bandwidth: 29895.91 MB/sec
STREAM add latency: 0.87 nanoseconds
STREAM add bandwidth: 27496.11 MB/sec
STREAM triad latency: 0.70 nanoseconds
STREAM triad bandwidth: 34128.93 MB/sec
24
STREAM copy latency: 0.78 nanoseconds
STREAM copy bandwidth: 20417.69 MB/sec
STREAM scale latency: 0.51 nanoseconds
STREAM scale bandwidth: 31354.70 MB/sec
STREAM add latency: 0.87 nanoseconds
STREAM add bandwidth: 27548.79 MB/sec
STREAM triad latency: 0.69 nanoseconds
STREAM triad bandwidth: 34589.22 MB/sec
32
STREAM copy latency: 0.60 nanoseconds
STREAM copy bandwidth: 26862.34 MB/sec
STREAM scale latency: 0.58 nanoseconds
STREAM scale bandwidth: 27376.00 MB/sec
STREAM add latency: 0.87 nanoseconds
STREAM add bandwidth: 27518.66 MB/sec
STREAM triad latency: 0.78 nanoseconds
STREAM triad bandwidth: 30779.17 MB/sec
40
STREAM copy latency: 0.59 nanoseconds
STREAM copy bandwidth: 27230.21 MB/sec
STREAM scale latency: 0.59 nanoseconds
STREAM scale bandwidth: 27284.18 MB/sec
STREAM add latency: 0.87 nanoseconds
STREAM add bandwidth: 27503.63 MB/sec
STREAM triad latency: 0.77 nanoseconds
STREAM triad bandwidth: 31242.48 MB/sec
48
STREAM copy latency: 0.59 nanoseconds
STREAM copy bandwidth: 27102.37 MB/sec
STREAM scale latency: 0.59 nanoseconds
STREAM scale bandwidth: 27164.08 MB/sec
STREAM add latency: 0.87 nanoseconds
STREAM add bandwidth: 27503.63 MB/sec
STREAM triad latency: 0.76 nanoseconds
STREAM triad bandwidth: 31422.90 MB/sec
56
STREAM copy latency: 0.92 nanoseconds
STREAM copy bandwidth: 17453.54 MB/sec
STREAM scale latency: 0.59 nanoseconds
STREAM scale bandwidth: 27267.55 MB/sec
STREAM add latency: 0.87 nanoseconds
STREAM add bandwidth: 27488.61 MB/sec
STREAM triad latency: 0.77 nanoseconds
STREAM triad bandwidth: 31169.92 MB/sec
64
STREAM copy latency: 0.88 nanoseconds
STREAM copy bandwidth: 18231.15 MB/sec
STREAM scale latency: 0.84 nanoseconds
STREAM scale bandwidth: 18976.06 MB/sec
STREAM add latency: 0.91 nanoseconds
STREAM add bandwidth: 26413.87 MB/sec
STREAM triad latency: 1.08 nanoseconds
STREAM triad bandwidth: 22310.12 MB/sec
72
STREAM copy latency: 0.86 nanoseconds
STREAM copy bandwidth: 18552.45 MB/sec
STREAM scale latency: 0.84 nanoseconds
STREAM scale bandwidth: 19113.88 MB/sec
STREAM add latency: 0.91 nanoseconds
STREAM add bandwidth: 26375.81 MB/sec
STREAM triad latency: 1.08 nanoseconds
STREAM triad bandwidth: 22151.79 MB/sec
80
STREAM copy latency: 0.89 nanoseconds
STREAM copy bandwidth: 18037.59 MB/sec
STREAM scale latency: 0.87 nanoseconds
STREAM scale bandwidth: 18398.59 MB/sec
STREAM add latency: 0.92 nanoseconds
STREAM add bandwidth: 26142.91 MB/sec
STREAM triad latency: 1.08 nanoseconds
STREAM triad bandwidth: 22133.53 MB/sec
88
STREAM copy latency: 0.93 nanoseconds
STREAM copy bandwidth: 17119.60 MB/sec
STREAM scale latency: 0.94 nanoseconds
STREAM scale bandwidth: 17030.54 MB/sec
STREAM add latency: 0.92 nanoseconds
STREAM add bandwidth: 26146.30 MB/sec
STREAM triad latency: 1.08 nanoseconds
STREAM triad bandwidth: 22159.10 MB/sec
96
STREAM copy latency: 1.39 nanoseconds
STREAM copy bandwidth: 11512.93 MB/sec
STREAM scale latency: 0.87 nanoseconds
STREAM scale bandwidth: 18406.16 MB/sec
STREAM add latency: 0.92 nanoseconds
STREAM add bandwidth: 25991.03 MB/sec
STREAM triad latency: 1.09 nanoseconds
STREAM triad bandwidth: 22078.91 MB/sec
104
STREAM copy latency: 0.86 nanoseconds
STREAM copy bandwidth: 18546.04 MB/sec
STREAM scale latency: 1.39 nanoseconds
STREAM scale bandwidth: 11518.85 MB/sec
STREAM add latency: 0.91 nanoseconds
STREAM add bandwidth: 26300.01 MB/sec
STREAM triad latency: 1.06 nanoseconds
STREAM triad bandwidth: 22599.38 MB/sec
112
STREAM copy latency: 0.88 nanoseconds
STREAM copy bandwidth: 18253.46 MB/sec
STREAM scale latency: 0.85 nanoseconds
STREAM scale bandwidth: 18758.59 MB/sec
STREAM add latency: 0.91 nanoseconds
STREAM add bandwidth: 26413.87 MB/sec
STREAM triad latency: 1.06 nanoseconds
STREAM triad bandwidth: 22648.95 MB/sec
120
STREAM copy latency: 0.86 nanoseconds
STREAM copy bandwidth: 18607.75 MB/sec
STREAM scale latency: 0.84 nanoseconds
STREAM scale bandwidth: 18957.30 MB/sec
STREAM add latency: 0.91 nanoseconds
STREAM add bandwidth: 26427.74 MB/sec
STREAM triad latency: 1.08 nanoseconds
STREAM triad bandwidth: 22313.83 MB/sec
128
STREAM copy latency: 0.82 nanoseconds
STREAM copy bandwidth: 19432.13 MB/sec
STREAM scale latency: 0.87 nanoseconds
STREAM scale bandwidth: 18421.31 MB/sec
STREAM add latency: 0.98 nanoseconds
STREAM add bandwidth: 24546.03 MB/sec
STREAM triad latency: 1.06 nanoseconds
STREAM triad bandwidth: 22702.59 MB/sec
136
STREAM copy latency: 0.74 nanoseconds
STREAM copy bandwidth: 21568.01 MB/sec
STREAM scale latency: 0.74 nanoseconds
STREAM scale bandwidth: 21668.99 MB/sec
STREAM add latency: 0.90 nanoseconds
STREAM add bandwidth: 26697.59 MB/sec
STREAM triad latency: 0.91 nanoseconds
STREAM triad bandwidth: 26320.64 MB/sec
144
STREAM copy latency: 0.79 nanoseconds
STREAM copy bandwidth: 20268.45 MB/sec
STREAM scale latency: 0.66 nanoseconds
STREAM scale bandwidth: 24279.61 MB/sec
STREAM add latency: 0.89 nanoseconds
STREAM add bandwidth: 26822.08 MB/sec
STREAM triad latency: 0.84 nanoseconds
STREAM triad bandwidth: 28540.76 MB/sec
152
STREAM copy latency: 0.85 nanoseconds
STREAM copy bandwidth: 18903.90 MB/sec
STREAM scale latency: 0.56 nanoseconds
STREAM scale bandwidth: 28734.25 MB/sec
STREAM add latency: 0.88 nanoseconds
STREAM add bandwidth: 27335.58 MB/sec
STREAM triad latency: 0.75 nanoseconds
STREAM triad bandwidth: 31911.01 MB/sec
160
STREAM copy latency: 0.64 nanoseconds
STREAM copy bandwidth: 25068.68 MB/sec
STREAM scale latency: 0.63 nanoseconds
STREAM scale bandwidth: 25550.68 MB/sec
STREAM add latency: 0.88 nanoseconds
STREAM add bandwidth: 27313.33 MB/sec
STREAM triad latency: 0.82 nanoseconds
STREAM triad bandwidth: 29416.50 MB/sec
168
STREAM copy latency: 0.61 nanoseconds
STREAM copy bandwidth: 26232.33 MB/sec
STREAM scale latency: 0.60 nanoseconds
STREAM scale bandwidth: 26717.96 MB/sec
STREAM add latency: 0.88 nanoseconds
STREAM add bandwidth: 27398.82 MB/sec
STREAM triad latency: 0.79 nanoseconds
STREAM triad bandwidth: 30411.86 MB/sec
176
STREAM copy latency: 0.58 nanoseconds
STREAM copy bandwidth: 27380.19 MB/sec
STREAM scale latency: 0.58 nanoseconds
STREAM scale bandwidth: 27740.96 MB/sec
STREAM add latency: 0.94 nanoseconds
STREAM add bandwidth: 25666.31 MB/sec
STREAM triad latency: 0.77 nanoseconds
STREAM triad bandwidth: 31150.63 MB/sec
184
STREAM copy latency: 0.90 nanoseconds
STREAM copy bandwidth: 17730.21 MB/sec
STREAM scale latency: 0.57 nanoseconds
STREAM scale bandwidth: 27918.40 MB/sec
STREAM add latency: 0.87 nanoseconds
STREAM add bandwidth: 27458.61 MB/sec
STREAM triad latency: 0.76 nanoseconds
STREAM triad bandwidth: 31457.27 MB/sec
192
STREAM copy latency: 0.91 nanoseconds
STREAM copy bandwidth: 17558.57 MB/sec
STREAM scale latency: 0.88 nanoseconds
STREAM scale bandwidth: 18115.49 MB/sec
STREAM add latency: 0.92 nanoseconds
STREAM add bandwidth: 26031.36 MB/sec
STREAM triad latency: 1.12 nanoseconds
STREAM triad bandwidth: 21443.95 MB/sec
200
STREAM copy latency: 1.34 nanoseconds
STREAM copy bandwidth: 11911.40 MB/sec
STREAM scale latency: 0.85 nanoseconds
STREAM scale bandwidth: 18893.26 MB/sec
STREAM add latency: 0.91 nanoseconds
STREAM add bandwidth: 26306.88 MB/sec
STREAM triad latency: 1.09 nanoseconds
STREAM triad bandwidth: 22013.73 MB/sec
208
STREAM copy latency: 1.36 nanoseconds
STREAM copy bandwidth: 11724.12 MB/sec
STREAM scale latency: 0.86 nanoseconds
STREAM scale bandwidth: 18631.00 MB/sec
STREAM add latency: 0.92 nanoseconds
STREAM add bandwidth: 26166.69 MB/sec
STREAM triad latency: 1.10 nanoseconds
STREAM triad bandwidth: 21763.86 MB/sec
216
STREAM copy latency: 0.88 nanoseconds
STREAM copy bandwidth: 18270.85 MB/sec
STREAM scale latency: 0.85 nanoseconds
STREAM scale bandwidth: 18848.15 MB/sec
STREAM add latency: 0.92 nanoseconds
STREAM add bandwidth: 26176.90 MB/sec
STREAM triad latency: 1.10 nanoseconds
STREAM triad bandwidth: 21799.20 MB/sec
224
STREAM copy latency: 0.89 nanoseconds
STREAM copy bandwidth: 18047.29 MB/sec
STREAM scale latency: 0.86 nanoseconds
STREAM scale bandwidth: 18677.66 MB/sec
STREAM add latency: 0.92 nanoseconds
STREAM add bandwidth: 26112.39 MB/sec
STREAM triad latency: 1.09 nanoseconds
STREAM triad bandwidth: 21966.89 MB/sec
232
STREAM copy latency: 1.35 nanoseconds
STREAM copy bandwidth: 11818.58 MB/sec
STREAM scale latency: 0.82 nanoseconds
STREAM scale bandwidth: 19568.11 MB/sec
STREAM add latency: 0.91 nanoseconds
STREAM add bandwidth: 26469.44 MB/sec
STREAM triad latency: 1.06 nanoseconds
STREAM triad bandwidth: 22702.59 MB/sec
240
STREAM copy latency: 0.87 nanoseconds
STREAM copy bandwidth: 18325.74 MB/sec
STREAM scale latency: 0.83 nanoseconds
STREAM scale bandwidth: 19331.37 MB/sec
STREAM add latency: 0.91 nanoseconds
STREAM add bandwidth: 26455.52 MB/sec
STREAM triad latency: 1.06 nanoseconds
STREAM triad bandwidth: 22580.37 MB/sec
248
STREAM copy latency: 0.87 nanoseconds
STREAM copy bandwidth: 18418.79 MB/sec
STREAM scale latency: 0.84 nanoseconds
STREAM scale bandwidth: 19019.09 MB/sec
STREAM add latency: 0.91 nanoseconds
STREAM add bandwidth: 26483.37 MB/sec
STREAM triad latency: 1.08 nanoseconds
STREAM triad bandwidth: 22148.13 MB/sec

stream对比数据

总结下几个CPU用stream测试访问内存的RT以及抖动和带宽对比数据,重点关注带宽,这个测试中时延不重要

最小RT 最大RT 最大copy bandwidth 最小copy bandwidth
申威3231(2numa node) 7.09 8.75 2256.59 MB/sec 1827.88 MB/sec
飞腾2500(16 numa node) 2.84 10.34 5638.21 MB/sec 1546.68 MB/sec
鲲鹏920(4 numa node) 1.84 3.87 8700.75 MB/sec 4131.81 MB/sec
海光7280(8 numa node) 1.38 2.58 11591.48 MB/sec 6206.99 MB/sec
海光5280(4 numa node) 1.22 2.52 13166.34 MB/sec 6357.71 MB/sec
Intel8269CY(2 numa node) 1.12 1.52 14293.68 MB/sec 10551.71 MB/sec
Intel E5-2682(2 numa node) 1.58 2.02 10092.31 MB/sec 7914.25 MB/sec
AMD EPYC 7T83(4 numa node) 0.49 1.39 32561.30 MB/sec 11512.93 MB/sec
Y 1.83 3.48 8764.72 MB/sec 4593.25 MB/sec

从以上数据可以看出这5款CPU性能一款比一款好,飞腾2500慢的core上延时快到intel 8269的10倍了,平均延时5倍以上了。延时数据基本和单核上测试sysbench TPS一致。性能差不多就是:常数*主频/RT

lat_mem_rd对比数据

用不同的node上的core 跑lat_mem_rd测试访问node0内存的RT,只取最大64M的时延,时延和node距离完全一致

RT变化
飞腾2500(16 numa node) core:0 149.976
core:8 168.805
core:16 191.415
core:24 178.283
core:32 170.814
core:40 185.699
core:48 212.281
core:56 202.479
core:64 426.176
core:72 444.367
core:80 465.894
core:88 452.245
core:96 448.352
core:104 460.603
core:112 485.989
core:120 490.402
鲲鹏920(4 numa node) core:0 117.323
core:24 135.337
core:48 197.782
core:72 219.416
海光7280(8 numa node) numa0 106.839
numa1 168.583
numa2 163.925
numa3 163.690
numa4 289.628
numa5 288.632
numa6 236.615
numa7 291.880
分割行
enabled die interleaving
core:0 153.005
core:16 152.458
core:32 272.057
core:48 269.441
海光5280(4 numa node) core:0 102.574
core:8 160.989
core:16 286.850
core:24 231.197
海光7260(1 numa node) core:0 265
Intel 8269CY(2 numa node) core:0 69.792
core:26 93.107
Intel 8163(2 NUMA node) core:0 68.785
core:24 100.314
Intel 8163(1 NUMA node) core:0 100.652
core:24 67.925 //内存没有做交织
申威3231(2numa node) core:0 215.146
core:32 282.443
AMD EPYC 7T83(4 numa node) core:0 71.656
core:32 80.129
core:64 131.334
core:96 129.563
Y7(2Die,2node,1socket) core:8 42.395
core:40 36.434
core:104 105.745
core:88 124.384

core:24 62.979
core:8 69.324
core:64 137.233
core:88 127.250

133ns 205ns (待测)

测试命令:

1
for i in $(seq 0 8 127); do echo core:$i; numactl -C $i -m 0 ./bin/lat_mem_rd -W 5 -N 5 -t 64M; done >lat.log 2>&1

测试结果和numactl -H 看到的node distance完全一致,芯片厂家应该就是这样测试然后把这个延迟当做距离写进去了

AMD EPYC 7T83(4 numa node)的时延相对抖动有点大,这和架构多个小Die合并成一块CPU有关

1
2
3
4
5
6
7
8
9
10
11
12
13
#grep -E "core|64.00000" lat.log
core:0
64.00000 71.656
core:32
64.00000 80.129
core:64
64.00000 131.334
core:88
64.00000 136.774
core:96
64.00000 129.563
core:120
64.00000 140.151

AMD EPYC 7T83(4 numa node)比Intel 8269时延要大,但是带宽也高很多

bios numa on/off

NUMA 参数:

BIOS ON BIOS OFF
cmdline numa=on(默认值) NUMA 开启,内存在Node内做交织,就近有快慢之分 bios 关闭后numa后,OS层面完全不知道下层的结构,默认全局内存做交织,时延是个平均值
cmdline numa=off 交织关闭,效果同上 同上

测试在bios中开关numa,以及在OS 启动参数里设置 numa=on/off 这四种组合来对比内存时延的差异

测试CPU型号如下:

1
2
3
4
5
6
7
8
9
10
11
12
13
14
15
16
Model name:            Intel(R) Xeon(R) Platinum 8163 CPU @ 2.50GHz
CPU(s): 96
On-line CPU(s) list: 0-95
Thread(s) per core: 2
Core(s) per socket: 24
Socket(s): 2
NUMA node(s): 2
L1d cache: 32K
L1i cache: 32K
L2 cache: 1024K
L3 cache: 33792K
NUMA node0 CPU(s): 0-23,48-71 //bios on + cmdline on
NUMA node1 CPU(s): 24-47,72-95

#cat /proc/cmdline
BOOT_IMAGE=/vmlinuz-3.10.0-327.x86_64 ro crashkernel=auto vconsole.font=latarcyrheb-sun16 vconsole.keymap=us biosdevname=0 console=tty0 console=ttyS0,115200 scsi_mod.scan=sync intel_idle.max_cstate=0 pci=pcie_bus_perf ipv6.disable=1 rd.driver.pre=ahci numa=on nosmt=force

测试命令以及测试结果

1
2
3
4
5
6
7
8
9
10
11
12
13
14
15
16
17
18
19
20
21
22
23
24
25
26
27
28
29
30
31
32
33
34
35
36
37
38
39
40
41
42
43
44
for i in $(seq 0 24 95); do echo core:$i; numactl -C $i -m 0 ./bin/lat_mem_rd -W 5 -N 5 -t 64M; done >lat.log 2>&1

//从下面两种测试来看,bios层面 on后,不管OS 层面是否on,都不会跨node 做交织,抖动存在
//bios on 即使在OS层面关闭numa也不跨node做内存交织,抖动存在
#grep -E "core|64.00000" lat.log.biosON.cmdlineOff
core:0 //第0号核
64.00000 100.717 //64.0000为64MB, 100.717 是平均时延100.717ns, 即0号核访问node0 下的内存64MB的平均延时是100纳秒
core:24
64.00000 68.484
core:48
64.00000 101.070
core:72
64.00000 68.483
#grep -E "core|64.00000" lat.log.biosON.cmdlineON
core:0
64.00000 67.094
core:24
64.00000 100.237
core:48
64.00000 67.614
core:72
64.00000 101.096

//从下面两种测试来看只要bios off了内存就会跨node交织,大规模测试下latency是个平均值
#grep -E "core|64.00000" lat.log.biosOff.cmdlineOff //bios off 做内存交织,latency就是平均值
core:0
64.00000 85.657
core:24
64.00000 85.741
core:48
64.00000 85.977
core:72
64.00000 86.671

//bios 关闭后numa后,OS层面完全不知道下层的结构,默认一定是做交织
#grep -E "core|64.00000" lat.log.biosOff.cmdlineON
core:0
64.00000 89.123
core:24
64.00000 87.137
core:48
64.00000 87.239
core:72
64.00000 87.323

结论:在OS 启动引导参数里设置 numa=off 完全没有必要、也不能起作用,反而设置了 numa=off 只能是掩耳盗铃,让用户看不到numa结构

为什么是平均值,而不是短板效应的最慢值?

测试软件只能通过大规模数据的读写来测试获取一个平均值,所以当一大块内存读取时,虽然通过交织大块内存被切分到了快慢物理内存上,但是因为规模大慢的被平均掉了。

bios=on 同时 cmdline off时

再用Intel 的 mlc 验证下,这个结果有点意思,latency稳定在 145 而不是81 和 145两个值随机出现,应该是mlc默认选到了0核,对应这个测试数据:

1
2
3
4
5
6
7
8
9
10
11
//从下面两种测试来看,bios层面 on后,不管OS 层面是否on,都不会跨node 做交织,抖动存在
//bios on 即使在OS层面关闭numa也不跨node做内存交织,抖动存在
#grep -E "core|64.00000" lat.log.biosON.cmdlineOff
core:0
64.00000 100.717
core:24
64.00000 68.484
core:48
64.00000 101.070
core:72
64.00000 68.483

对应的mlc

1
2
3
4
5
6
7
8
9
10
11
12
13
14
15
16
17
18
19
20
21
22
23
24
25
26
27
28
29
30
31
32
33
34
35
36
37
38
39
40
41
42
43
44
45
46
#./mlc
Intel(R) Memory Latency Checker - v3.9
Measuring idle latencies (in ns)...
Numa node
Numa node 0
0 145.8

Measuring Peak Injection Memory Bandwidths for the system
Bandwidths are in MB/sec (1 MB/sec = 1,000,000 Bytes/sec)
Using all the threads from each core if Hyper-threading is enabled
Using traffic with the following read-write ratios
ALL Reads : 110598.7
3:1 Reads-Writes : 93408.5
2:1 Reads-Writes : 89249.5
1:1 Reads-Writes : 64137.3
Stream-triad like: 77310.4

Measuring Memory Bandwidths between nodes within system
Bandwidths are in MB/sec (1 MB/sec = 1,000,000 Bytes/sec)
Using all the threads from each core if Hyper-threading is enabled
Using Read-only traffic type
Numa node
Numa node 0
0 110598.4

Measuring Loaded Latencies for the system
Using all the threads from each core if Hyper-threading is enabled
Using Read-only traffic type
Inject Latency Bandwidth
Delay (ns) MB/sec
==========================
00000 506.00 111483.5
00002 505.74 112576.9
00008 505.87 112644.3
00015 508.96 112643.6
00050 574.36 112701.5
00100 501.32 112775.9
00200 475.47 112839.3
00300 224.52 91560.4
00400 194.54 70515.6
00500 185.13 57233.2
00700 178.71 41591.6
01000 170.46 29524.1
01300 165.43 22933.2
01700 164.33 17702.9
02500 164.14 12206.9

两个值都为on 时的mlc 测试结果

1
2
3
4
5
6
7
8
9
10
11
12
13
14
15
16
17
#./mlc
Intel(R) Memory Latency Checker - v3.9
Measuring idle latencies (in ns)...
Numa node
Numa node 0 1
0 81.6 145.9
1 144.9 81.2

Measuring Peak Injection Memory Bandwidths for the system
Bandwidths are in MB/sec (1 MB/sec = 1,000,000 Bytes/sec)
Using all the threads from each core if Hyper-threading is enabled
Using traffic with the following read-write ratios
ALL Reads : 227204.2
3:1 Reads-Writes : 212432.5
2:1 Reads-Writes : 210423.3
1:1 Reads-Writes : 196677.2
Stream-triad like: 189691.4

说明:mlc和 lmbench 测试结果不一样,mlc 时81和145,lmbench测试是68和100,这是两种测试方法的差异而已,但是快慢差距基本是一致的

龙芯测试数据

3A5000为龙芯,执行的命令为./lat_mem_rd 128M 4096,其中 4096 参数为跳步大小。其基本原理是,通过按 给定间隔去循环读一定大小的内存区域,测量每个读平均的时间。如果区域大小小于 L1 Cache 大 小,时间应该接近 L1 的访问延迟;如果大于 L1 小于 L2,则接近 L2 访问延迟;依此类推。图中横坐 标为访问的字节数,纵坐标为访存的拍数(cycles)。

image-20220221113929547

基于跳步访问的 3A5000 和 Zen1、Skylake 各级延迟的比较(cycles)

image-20220221112527936

下图给出了 LMbench 测试得到的访存操作的并发性,执行的命令为./par_mem。访存操作的并 发性是各级 Cache 和内存所支持并发访问的能力。在 LMbench 中,访存操作并发性的测试是设计一 个链表,不断地遍历访问下一个链表中的元素,链表所跳的距离和需要测量的 Cache 容量相关,在 一段时间能并发的发起对链表的追逐操作,也就是同时很多链表在遍历,如果发现这一段时间内 能同时完成 N 个链表的追逐操作,就认为访存的并发操作是 N。

image-20220221112727377

下图列出了三款处理器的功能部件操作延迟数据,使用的命令是./lat_ops。

image-20220221112853404

龙芯stream数据

LMbench 包含了 STREAM 带宽测试工具,可以用来测试可持续的内存访问带宽情况。图表12.25列 出了三款处理器的 STREAM 带宽数据,其中 STREAM 数组大小设置为 1 亿个元素,采用 OpenMP 版本 同时运行四个线程来测试满载带宽;相应测试平台均为 CPU 的两个内存控制器各接一根内存条, 3A5000 和 Zen1 用 DDR4 3200 内存条,Skylake 用 DDR4 2400 内存条(它最高只支持这个规格)。

image-20220221113037332

从数据可以看到,虽然硬件上 3A5000 和 Zen1 都实现了 DDR4 3200,但 3A5000 的实测可持续带宽 还是有一定差距。用户程序看到的内存带宽不仅仅和内存的物理频率有关系,也和处理器内部的 各种访存队列、内存控制器的调度策略、预取器和内存时序参数设置等相关,需要进行更多分析 来定位具体的瓶颈点。像 STREAM 这样的软件测试工具,能够更好地反映某个子系统的综合能力, 因而被广泛采用。

对比结论

  • AMD单核跑分数据比较好
  • MySQL 查询场景下Intel的性能好很多
  • xdb比社区版性能要好
  • MySQL8.0比5.7在多核锁竞争场景下性能要好
  • intel最好,AMD接近Intel,海光差的比较远但是又比鲲鹏好很多,飞腾最差,尤其是跨socket简直是灾难
  • 麒麟OS性能也比CentOS略差一些
  • 从perf指标来看 鲲鹏920的L1d命中率高于8163是因为鲲鹏L1 size大;L2命中率低于8163,同样是因为鲲鹏 L2 size小;同样L1i 鲲鹏也大于8163,但是实际跑起来L1i Miss Rate更高,这说明 ARM对 L1d 使用效率低

整体来说AMD用领先了一代的工艺(7nm VS 14nm),在MySQL查询场景中终于可以接近Intel了,但是海光、鲲鹏、飞腾还是不给力。

附表

鲲鹏920 和 8163 在 MySQL 场景下的 perf 指标对比

整体对比
指标 X86 ARM 增加幅度
IPC 0.4979 0.495 -0.6%
Branchs 237606414772 415979894985 75.1%
Branch-misses 8104247620 28983836845 257.6%
Branch-missed rate 0.034 0.070 104.3%
内存读带宽(GB/S) 25.0 25.0 -0.2%
内存写带宽(GB/S) 24.6 67.8 175.5%
内存读写带宽(GB/S) 49.7 92.8 86.8%
UNALIGNED_ACCESS 1329146645 13686011901 929.7%
L1d_MISS_RATIO 0.06055 0.04281 -29.3%
L1d_MISS_RATE 0.01645 0.01711 4.0%
L2_MISS_RATIO 0.34824 0.47162 35.4%
L2_MISS_RATE 0.00577 0.03493 504.8%
L1_ITLB_MISS_RATE 0.0028 0.005 78.6%
L1_DTLB_MISS_RATE 0.0025 0.0102 308.0%
context-switchs 8407195 11614981 38.2%
Pagefault 228371 741189 224.6%

参考资料

CPU的制造和概念

[CPU 性能和Cache Line](/2021/05/16/CPU Cache Line 和性能/)

[Perf IPC以及CPU性能](/2021/05/16/Perf IPC以及CPU利用率/)

Intel、海光、鲲鹏920、飞腾2500 CPU性能对比

飞腾ARM芯片(FT2500)的性能测试

十年后数据库还是不敢拥抱NUMA?

一次海光物理机资源竞争压测的记录

[Intel PAUSE指令变化是如何影响自旋锁以及MySQL的性能的](/2019/12/16/Intel PAUSE指令变化是如何影响自旋锁以及MySQL的性能的/)

lmbench测试要考虑cache等

comment:

Intel 8163 IPC是0.67,和在PostgreSQL下测得数据基本一致。Oracle可以达到更高的IPC。从8163的perf结果中,看不出来访存在总周期中的占比。可以添加几个cycle_activity.cycles_l1d_miss、cycle_activity.stalls_mem_any,看看访存耗用的周期占比。

网络抓包常用命令

详细解析和Demo版本:就是要你懂抓包–WireShark之命令行版tshark

1
2
3
4
5
6
7
8
9
10
11
12
13
14
15
16
17
18
19
20
21
22
23
24
25
26
27
28
29
30
31
32
33
34
35
36
37
38
39
40
41
42
43
44
45
46
47
48
49
50
51
52
53
54
55
56
57
58
59
60
61
62
63
64
65
66
67
68
69
70
71
72
73
74
75
76
77
78
79
80
81
82
83
84
85
86
87
88
89
90
91
92
93
94
95
96
97
98
99
100
101
102
103
104
105
106
107
108
109
110
111
112
113
114
115
116
117
118
119
120
121
122
123
124
125
126
127
128
129
130
131
132
133
134
135
136
137
138
139
140
141
142
143
144
145
146
147
148
149
150
151
152
153
154
155
156
157
158
159
160
161
162
163
164
165
166
167
168
169
170
171
172
173
174
175
176
177
178
179
180
181
182
183
184
185
186
187
188
189
190
191
192
193
194
195
196
197
198
199
200
201
202
203
204
205
206
207
208
209
210
211
212
213
214
215
216
217
218
219
220
221
222
223
224
225
226
227
228
229
//抓取一个子网范围
tcpdump -i bond0 port 3001 and net 1.2.3.0/24 and host not 1.2.3.211 -nn -X

//抓取 DNAT 包,tcp options 里面的 246 代表 DNAT
tcpdump -nn –vvv -i eth0 tcp dst port 3306 and '(tcp[tcpflags] & (tcp-syn) != 0) and (tcp[20] =246) '

//在上面的基础上,抓取指定 vip:10.142.*.*
tcpdump -nn –vvv -i eth0 tcp dst port 3306 and '(tcp[tcpflags] & (tcp-syn) != 0) and tcp[20]=246 and tcp[24]=10 and tcp[25]=142'

//抓取 DNAT 包,tcp options 里面的 252 代表 DNAT
tcpdump -nn –vvv -i eth0 tcp dst port 3306 and '(tcp[tcpflags] & (tcp-ack) != 0) and (tcp[20] =252) '

//根据指定的VPC IP抓包,例如172.16.x.x
tcpdump -nn –vvv -i eth0 tcp dst port 3306 and '(tcp[tcpflags] & (tcp-ack) != 0) and (tcp[32] =172) and (tcp[33] =16)'

//根据客户端IP抓包FNAT的包,例如172.16.x.x
tcpdump -nn –vvv -i eth0 tcp dst port 3306 and '(tcp[tcpflags] & (tcp-ack) != 0) and(tcp[20]=252) and (tcp[24]=172) and (tcp[25]=16)'

用tcpdump抓取并保存包:
sudo tcpdump -i eth0 port 3306 -w plantegg.cap

抓到的包存储在plantegg.cap中,可以用作wireshark、tshark详细分析
如果明确知道目的ip、端口等可以通过指定条件来明确只抓取某个连接的包

只抓本机的8080端口:
tcpdump -i eth0 '(src port 8001 and src host 11.59.10.106) or (dst port 8001 and dst host 11.59.10.106)' -nn -X

//http 流量
// -f 抓取过滤条件 tcp port 80 and host 11.59.10.106
//-Y 展示过滤条件
tshark -i eth0 -f '(tcp src port 8080 and src host 11.59.10.106) or (tcp dst port 8080 and dst host 11.59.10.106)' -t a -Y " (http.request or http.response)" -T fields -e frame.number -e frame.time -e frame.time_delta_displayed -e ip.src -e tcp.srcport -e tcp.dstport -e ip.dst -e http.request.full_uri -e http.response.code -e http.response.phrase


抓取详细SQL语句:
sudo tshark -i eth0 -Y "mysql.command==3" -T fields -e mysql.query
sudo tshark -i eth0 -R mysql.query -T fields -e mysql.query

sudo tshark -i any -f 'port 8527' -s 0 -l -w - |strings

#parse 8507/4444 as mysql protocol, default only parse 3306 as mysql.
sudo tshark -i eth0 -d tcp.port==8507,mysql -T fields -e mysql.query 'port 8507'
sudo tshark -i any -c 50 -d tcp.port==4444,mysql -Y " ((tcp.port eq 4444 ) )" -o tcp.calculate_timestamps:true -T fields -e frame.number -e frame.time_epoch -e frame.time_delta_displayed -e ip.src -e tcp.srcport -e tcp.dstport -e ip.dst -e tcp.time_delta -e tcp.stream -e tcp.len -e mysql.query

sudo tshark -i eth0 -R "ip.addr==10.18.106.95" -d tcp.port==3306,mysql -T fields -e mysql.query 'port 3306'
sudo tshark -i eth0 -R "tcp.srcport==62877" -d tcp.port==3001,mysql -T fields -e tcp.srcport -e mysql.query 'port 3001'

sudo tshark -i br1.10 -Y tcp.port==4000,mysql -T fields -e tcp.srcport -e mysql.query 'port 4000'
tshark -i br1.10 -d tcp.port==4000,mysql -T fields -e tcp.srcport -e _ws.col.Info -e mysql.query

tshark -i eth0 -d tcp.port==4000,mysql -T fields -e tcp.srcport -e _ws.col.Info -e mysql.query

//将3307端口解析成MySQL 协议分析
tshark -i lo -d tcp.port==3307,mysql -T fields -e frame.number -e frame.time -e frame.time_delta -e tcp.srcport -e tcp.dstport -e tcp.len -e _ws.col.Info -e mysql.query

如果MySQL开启了SSL,那么抓包后的内容tshark/wireshark分析不到MySQL的具体内容,可以强制关闭:connectionProperties里加上useSSL=false

查看SQL具体内容
sudo tshark -r gege_plantegg.cap -Y "mysql.query or ( tcp.stream==1)" -o tcp.calculate_timestamps:true -T fields -e frame.number -e frame.time_epoch -e frame.time_delta_displayed -e ip.src -e tcp.srcport -e tcp.dstport -e ip.dst -e tcp.time_delta -e frame.time_delta_displayed -e tcp.stream -e tcp.len -e mysql.query


按mysql查询分析响应时间
对于rt分析,要注意一个query多个response情况(response结果多,分包了),分析这种rt的时候只看query之后的第一个response,其它连续response需要忽略掉。

以上抓包结果文件可以用tshark进行详细分析

对抓包按 stream 进行切分:
for i in {0..314};do tshark -r 11216253112_3055.pcap -Y "tcp.stream eq $i" -w $i.pcap; done
tshark -r 0.pcap "ip.src eq 11.216.253.112" -T fields -e frame.number -e frame.time_delta -e ip.src -e tcp.srcport -e tcp.dstport -e ip.dst -e tcp.time_delta -e tcp.stream -e tcp.len -e tcp.analysis.ack_rtt

分析MySQL rt,倒数第四列基本就是rt
tshark -r gege_plantegg.pcap -Y " ((tcp.srcport eq 3306 ) and tcp.len>0 )" -o tcp.calculate_timestamps:true -T fields -e frame.number -e frame.time_epoch -e frame.time_delta_displayed -e ip.src -e tcp.srcport -e tcp.dstport -e ip.dst -e tcp.time_delta -e tcp.stream -e tcp.len -e tcp.analysis.ack_rtt

或者排序一下
tshark -r 213_php.cap -Y "mysql.query or ( tcp.srcport==3306)" -o tcp.calculate_timestamps:true -T fields -e frame.number -e frame.time_epoch -e frame.time_delta_displayed -e ip.src -e tcp.srcport -e tcp.dstport -e ip.dst -e tcp.time_delta -e tcp.stream -e tcp.len -e mysql.query |sort -nk9 -nk1

MySQL响应时间直方图【第八列的含义-- Time since previous frame in this TCP stream: seconds】:
tshark -r gege_plantegg.pcap -Y "mysql.query or (tcp.srcport3306 and tcp.len>60)" -o tcp.calculate_timestamps:true -T fields -e frame.number -e frame.time_epoch -e frame.time_delta_displayed -e ip.src -e tcp.srcport -e tcp.dstport -e ip.dst -e tcp.time_delta -e tcp.stream -e tcp.len | awk 'BEGIN {sum0=0;sum3=0;sum10=0;sum30=0;sum50=0;sum100=0;sum300=0;sum500=0;sum1000=0;sumo=0;count=0;sum=0} {rt=$8; if(rt>=0.000) sum=sum+rt; count=count+1; if(rt<=0.000) sum0=sum0+1; else if(rt<0.003) sum3=sum3+1 ; else if(rt<0.01) sum10=sum10+1; else if(rt<0.03) sum30=sum30+1; else if(rt<0.05) sum50=sum50+1; else if(rt < 0.1) sum100=sum100+1; else if(rt < 0.3) sum300=sum300+1; else if(rt < 0.5) sum500=sum500+1; else if(rt < 1) sum1000=sum1000+1; else sum=sum+1 ;} END{printf "-------------\n3ms:\t%s \n10ms:\t%s \n30ms:\t%s \n50ms:\t%s \n100ms:\t%s \n300ms:\t%s \n500ms:\t%s \n1000ms:\t%s \n>1s:\t %s\n-------------\navg: %.6f \n" , sum3,sum10,sum30,sum50,sum100,sum300,sum500,sum1000,sumo,sum/count;}'

按http response分析响应时间
tshark -nr 213_php.cap -o tcp.calculate_timestamps:true -Y "http.request or http.response" -T fields -e frame.number -e frame.time_epoch -e frame.time_delta_displayed -e ip.src -e ip.dst -e tcp.stream -e http.request.full_uri -e http.response.code -e http.response.phrase | sort -nk6 -nk1

分析rtt、丢包、deplicate等等,可以得到整体网络状态
$ tshark -r retrans.cap -q -z io,stat,1,"AVG(tcp.analysis.ack_rtt)tcp.analysis.ack_rtt","COUNT(tcp.analysis.retransmission) tcp.analysis.retransmission","COUNT(tcp.analysis.fast_retransmission) tcp.analysis.fast_retransmission","COUNT(tcp.analysis.duplicate_ack) tcp.analysis.duplicate_ack","COUNT(tcp.analysis.lost_segment) tcp.analysis.lost_segment","MIN(tcp.window_size)tcp.window_size"

===================================================================================
| IO Statistics |
| |
| Duration: 89.892365 secs |
| Interval: 2 secs |
| |
| Col 1: AVG(tcp.analysis.ack_rtt)tcp.analysis.ack_rtt |
| 2: COUNT(tcp.analysis.retransmission) tcp.analysis.retransmission |
| 3: COUNT(tcp.analysis.fast_retransmission) tcp.analysis.fast_retransmission |
| 4: COUNT(tcp.analysis.duplicate_ack) tcp.analysis.duplicate_ack |
| 5: COUNT(tcp.analysis.lost_segment) tcp.analysis.lost_segment |
| 6: AVG(tcp.window_size)tcp.window_size |
|---------------------------------------------------------------------------------|
| |1 |2 |3 |4 |5 |6 | |
| Interval | AVG | COUNT | COUNT | COUNT | COUNT | AVG | |
|-------------------------------------------------------------| |
| 0 <> 2 | 0.001152 | 0 | 0 | 0 | 0 | 4206 | |
| 2 <> 4 | 0.002088 | 0 | 0 | 0 | 1 | 6931 | |
| 4 <> 6 | 0.001512 | 0 | 0 | 0 | 0 | 7099 | |
| 6 <> 8 | 0.002859 | 0 | 0 | 0 | 0 | 7171 | |
| 8 <> 10 | 0.001716 | 0 | 0 | 0 | 0 | 6472 | |
| 10 <> 12 | 0.000319 | 0 | 0 | 0 | 2 | 5575 | |
| 12 <> 14 | 0.002030 | 0 | 0 | 0 | 0 | 6922 | |
| 14 <> 16 | 0.003371 | 0 | 0 | 0 | 2 | 5884 | |
| 16 <> 18 | 0.000138 | 0 | 0 | 0 | 1 | 3480 | |
| 18 <> 20 | 0.000999 | 0 | 0 | 0 | 4 | 6665 | |
| 20 <> 22 | 0.000682 | 0 | 0 | 41 | 2 | 5484 | |
| 22 <> 24 | 0.002302 | 2 | 0 | 19 | 0 | 7127 | |
| 24 <> 26 | 0.000156 | 1 | 0 | 22 | 0 | 3042 | |
| 26 <> 28 | 0.000000 | 1 | 0 | 19 | 1 | 152 | |
| 28 <> 30 | 0.001498 | 1 | 0 | 24 | 0 | 5615 | |
| 30 <> 32 | 0.000235 | 0 | 0 | 44 | 0 | 1880 | |
1
===================================================================================
2
| IO Statistics |
3
| |
4
| Duration: 89.892365 secs |
5
| Interval: 2 secs |
6
| |
7
| Col 1: AVG(tcp.analysis.ack_rtt)tcp.analysis.ack_rtt |
8
| 2: COUNT(tcp.analysis.retransmission) tcp.analysis.retransmission |
9
| 3: COUNT(tcp.analysis.fast_retransmission) tcp.analysis.fast_retransmission |
10
| 4: COUNT(tcp.analysis.duplicate_ack) tcp.analysis.duplicate_ack |
11
| 5: COUNT(tcp.analysis.lost_segment) tcp.analysis.lost_segment |
12
| 6: AVG(tcp.window_size)tcp.window_size |
13
|---------------------------------------------------------------------------------|
14
| |1 |2 |3 |4 |5 |6 | |
15
| Interval | AVG | COUNT | COUNT | COUNT | COUNT | AVG | |
16
|-------------------------------------------------------------| |
17
| 0 <> 2 | 0.001152 | 0 | 0 | 0 | 0 | 4206 | |
18
| 2 <> 4 | 0.002088 | 0 | 0 | 0 | 1 | 6931 | |
19
| 4 <> 6 | 0.001512 | 0 | 0 | 0 | 0 | 7099 | |
20
| 6 <> 8 | 0.002859 | 0 | 0 | 0 | 0 | 7171 | |
21
| 8 <> 10 | 0.001716 | 0 | 0 | 0 | 0 | 6472 | |
22
| 10 <> 12 | 0.000319 | 0 | 0 | 0 | 2 | 5575 | |
23
| 12 <> 14 | 0.002030 | 0 | 0 | 0 | 0 | 6922 | |
24
| 14 <> 16 | 0.003371 | 0 | 0 | 0 | 2 | 5884 | |
25
| 16 <> 18 | 0.000138 | 0 | 0 | 0 | 1 | 3480 | |
26
| 18 <> 20 | 0.000999 | 0 | 0 | 0 | 4 | 6665 | |
27
| 20 <> 22 | 0.000682 | 0 | 0 | 41 | 2 | 5484 | |
28
| 22 <> 24 | 0.002302 | 2 | 0 | 19 | 0 | 7127 | |
29
| 24 <> 26 | 0.000156 | 1 | 0 | 22 | 0 | 3042 | |
30
| 26 <> 28 | 0.000000 | 1 | 0 | 19 | 1 | 152 | |
31
| 28 <> 30 | 0.001498 | 1 | 0 | 24 | 0 | 5615 | |
32
| 30 <> 32 | 0.000235 | 0 | 0 | 44 | 0 | 1880 | |


#tshark
tshark -r ./mysql-compress.cap -o tcp.calculate_timestamps:true -T fields -e mysql.caps.cp -e frame.number -e frame.time_epoch -e frame.time_delta_displayed -e ip.src -e tcp.srcport -e tcp.dstport -e ip.dst -e tcp.time_delta -e frame.time_delta_displayed -e tcp.stream -e tcp.len -e mysql.query

#用tcpdump抓取并保存包:
sudo tcpdump -i eth0 port 3306 -w plantegg.cap

#每隔3秒钟生成一个新文件,总共生成5个文件后(15秒后)终止抓包,然后包名也按时间规范好了
sudo tcpdump -t -s 0 tcp port 6379 -w 'dump_%Y-%m-%d_%H:%M:%S.pcap' -G 3 -W 5 -Z root

#每隔30分钟生成一个包并压缩,保留48个抓包,也就是24小的内的包
nohup sudo tcpdump -i eth0 -t -s 0 tcp and port 6379 -w 'dump_%Y-%m-%d_%H:%M:%S.pcap' -G 1800 -W 48 -Z root -z gzip &

#file size 512M 按文件大小不支持时间戳
nohup sudo tcpdump -i eth0 -t -s 0 tcp and port 3306 -w "dump_size.pcap" -C 1 -W 2 -Z root -z gzip &

#port range
sudo tcpdump -i eth0 -t -s 0 portrange 3000-3100 -w 'dump_%Y-%m-%d_%H:%M:%S.pcap' -G 60 -W 100 -Z root

#subnet
sudo tcpdump -i enp44s0f0 -t -s 0 net 192.168.0.1/28 -w 'dump_%Y-%m-%d_%H:%M:%S.pcap' -G 60 -W 100 -Z root

#抓取详细SQL语句, 快速确认client发过来的具体SQL内容:
sudo tshark -i any -f 'port 8527' -s 0 -l -w - |strings
sudo tshark -i eth0 -d tcp.port==3306,mysql -T fields -e mysql.query 'port 3306'
sudo tshark -i eth0 -R "ip.addr==11.163.182.137" -d tcp.port==3306,mysql -T fields -e mysql.query 'port 3306'
sudo tshark -i eth0 -R "tcp.srcport==62877" -d tcp.port==3001,mysql -T fields -e tcp.srcport -e mysql.query 'port 3001'

#query time
sudo tshark -i eth0 -Y " ((tcp.port eq 3306 ) and tcp.len>0 )" -o tcp.calculate_timestamps:true -T fields -e frame.number -e frame.time_epoch -e frame.time_delta_displayed -e ip.src -e tcp.srcport -e tcp.dstport -e ip.dst -e tcp.time_delta -e tcp.stream -e tcp.len -e mysql.query

#如果MySQL开启了SSL,那么抓包后的内容tshark/wireshark分析不到MySQL的具体内容,可以强制关闭:connectionProperties里加上useSSL=false

tshark -r ./manager.cap -o tcp.calculate_timestamps:true -Y " tcp.analysis.retransmission " -T fields -e tcp.stream -e frame.number -e frame.time -e ip.src -e tcp.srcport -e tcp.dstport -e ip.dst | sort

#MySQL响应时间直方图【第八列的含义-- Time since previous frame in this TCP stream: seconds】:
tshark -r gege_plantegg.pcap -Y "mysql.query or (tcp.srcport3306 and tcp.len>60)" -o tcp.calculate_timestamps:true -T fields -e frame.number -e frame.time_epoch -e frame.time_delta_displayed -e ip.src -e tcp.srcport -e tcp.dstport -e ip.dst -e tcp.time_delta -e tcp.stream -e tcp.len | awk 'BEGIN {sum0=0;sum3=0;sum10=0;sum30=0;sum50=0;sum100=0;sum300=0;sum500=0;sum1000=0;sumo=0;count=0;sum=0} {rt=$8; if(rt>=0.000) sum=sum+rt; count=count+1; if(rt<=0.000) sum0=sum0+1; else if(rt<0.003) sum3=sum3+1 ; else if(rt<0.01) sum10=sum10+1; else if(rt<0.03) sum30=sum30+1; else if(rt<0.05) sum50=sum50+1; else if(rt < 0.1) sum100=sum100+1; else if(rt < 0.3) sum300=sum300+1; else if(rt < 0.5) sum500=sum500+1; else if(rt < 1) sum1000=sum1000+1; else sum=sum+1 ;} END{printf "-------------\n3ms:\t%s \n10ms:\t%s \n30ms:\t%s \n50ms:\t%s \n100ms:\t%s \n300ms:\t%s \n500ms:\t%s \n1000ms:\t%s \n>1s:\t %s\n-------------\navg: %.6f \n" , sum3,sum10,sum30,sum50,sum100,sum300,sum500,sum1000,sumo,sum/count;}'

#分析MySQL rt,倒数第四列基本就是rt
tshark -r gege_plantegg.pcap -Y " ((tcp.srcport eq 3306 ) and tcp.len>0 )" -o tcp.calculate_timestamps:true -T fields -e frame.number -e frame.time_epoch -e frame.time_delta_displayed -e ip.src -e tcp.srcport -e tcp.dstport -e ip.dst -e tcp.time_delta -e tcp.stream -e tcp.len -e tcp.analysis.ack_rtt

#或者排序一下
tshark -r 213_php.cap -Y "mysql.query or ( tcp.srcport==3306)" -o tcp.calculate_timestamps:true -T fields -e frame.number -e frame.time_epoch -e frame.time_delta_displayed -e ip.src -e tcp.srcport -e tcp.dstport -e ip.dst -e tcp.time_delta -e tcp.stream -e tcp.len -e mysql.query |sort -nk9 -nk1

#将 tls key和抓包文件合并
editcap --inject-secrets tls,key.log in.pcap out.pcap
#把包长截掉,只保留前面54,可以脱敏包内容
editcap -s 54 old.pcap new.pcap

DNAT:

img

FNAT:

img

0%