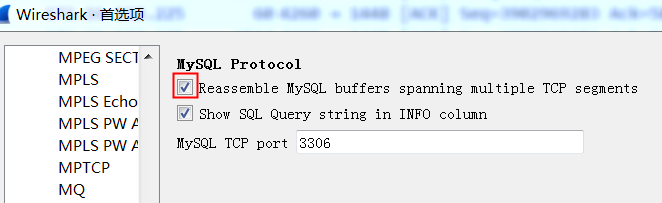
If the reassembly is successful, the TCP segment containing the last part of the packet will show the packet. The reassembly might fail if some TCP segments are missing.
Wireshark/TShark thinks it knows what protocol is running atop TCP in that TCP segment;
that TCP segment doesn’t contain all of a “protocol data unit” (PDU) for that higher-level protocol, i.e. a packet or protocol message for that higher-level protocol, and doesn’t contain the last part of that PDU, so it’s trying to reassemble the multiple TCP segments containing that higher-level PDU.
#!/usr/bin/stap
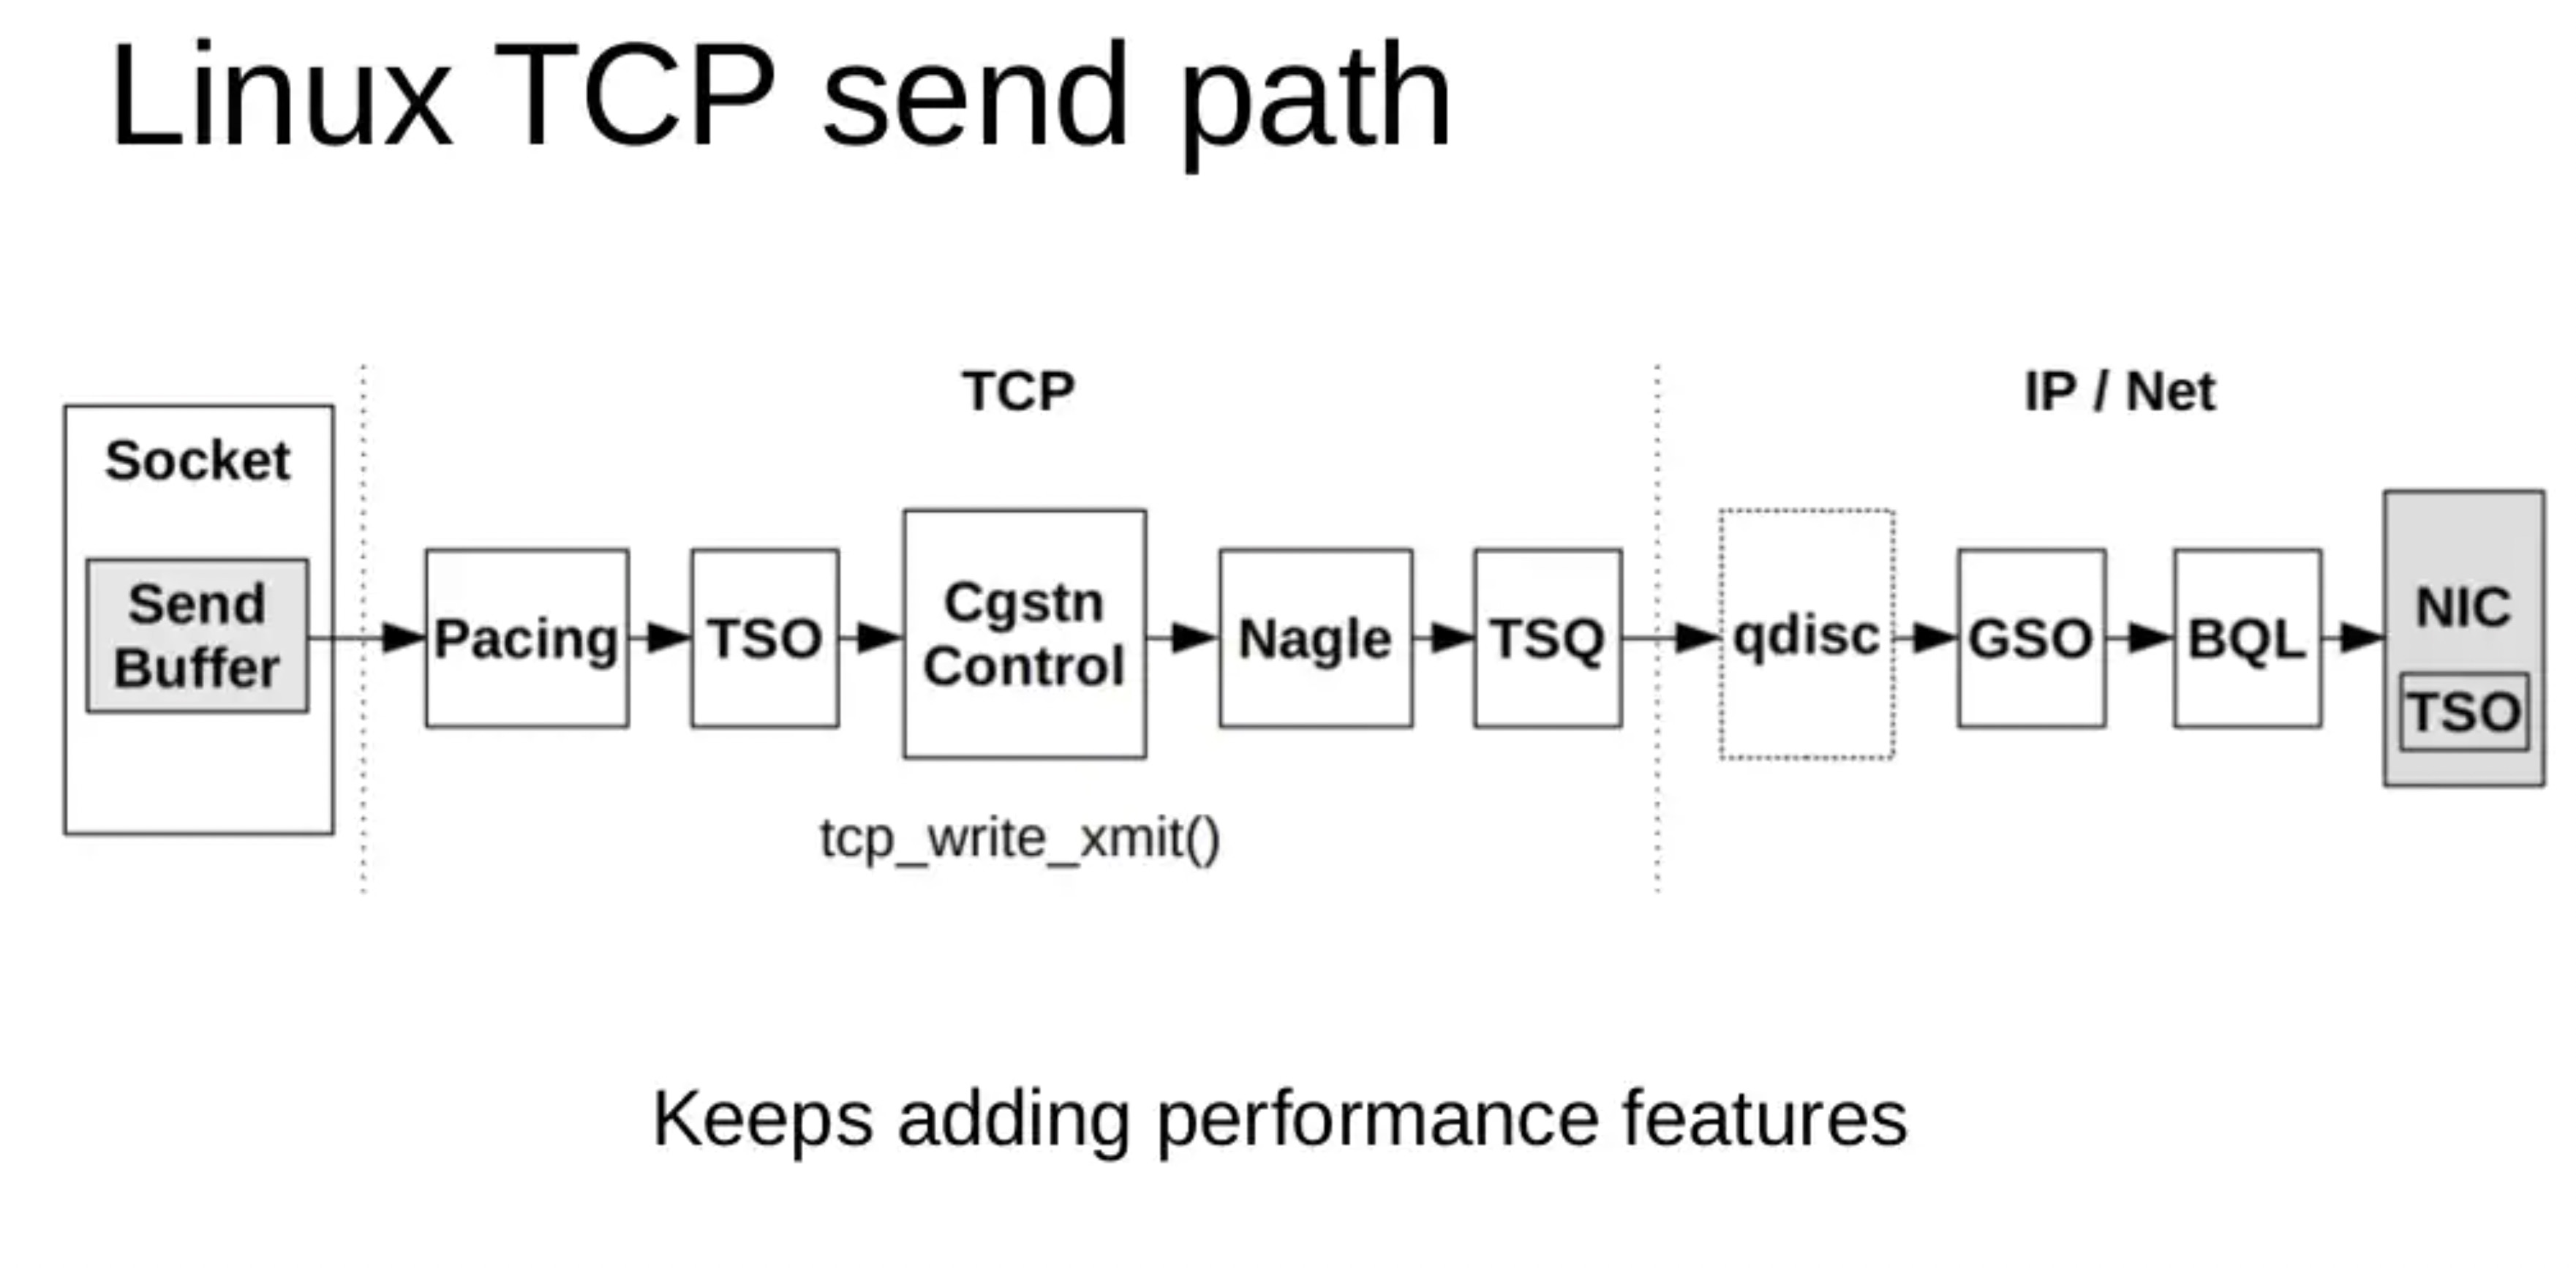
# Simple probe to detect when a process is waiting for more socket send
# buffer memory. Usually means the process is doing writes larger than the
# socket send buffer size or there is a slow receiver at the other side.
# Increasing the socket's send buffer size might help decrease application
# latencies, but it might also make it worse, so buyer beware.
#
# Typical output: timestamp in microseconds: procname(pid) event
#
# 1218230114875167: python(17631) blocked on full send buffer
# 1218230114876196: python(17631) recovered from full send buffer
# 1218230114876271: python(17631) blocked on full send buffer
# 1218230114876479: python(17631) recovered from full send buffer
probe kernel.function("sk_stream_wait_memory")
{
printf("%u: %s(%d) blocked on full send buffer\n",
gettimeofday_us(), execname(), pid())
}
probe kernel.function("sk_stream_wait_memory").return
{
printf("%u: %s(%d) recovered from full send buffer\n",
gettimeofday_us(), execname(), pid())
}
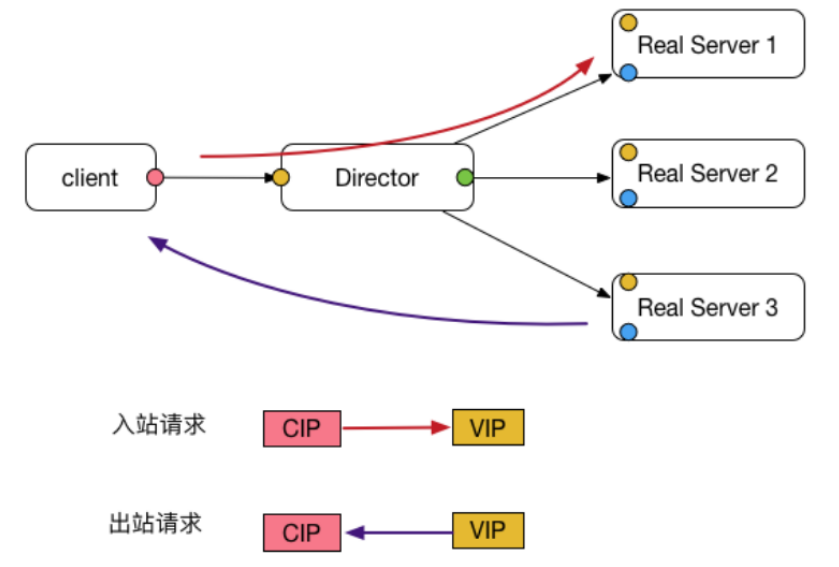
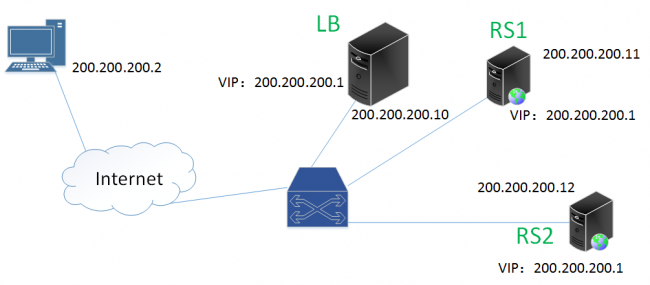
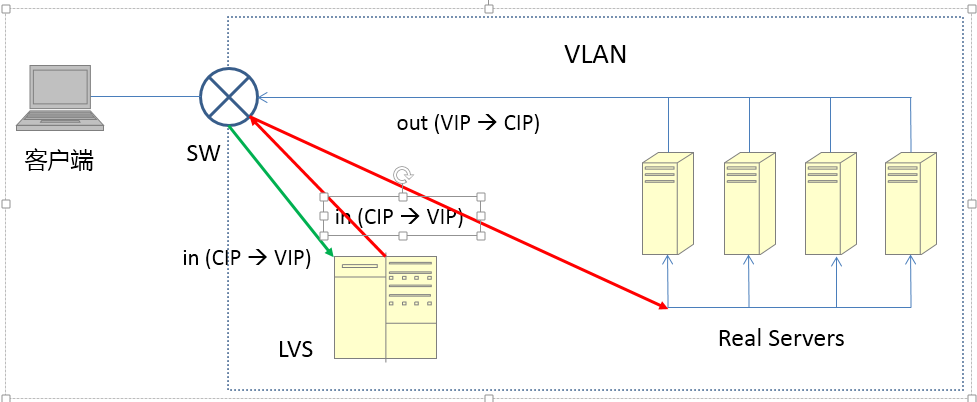
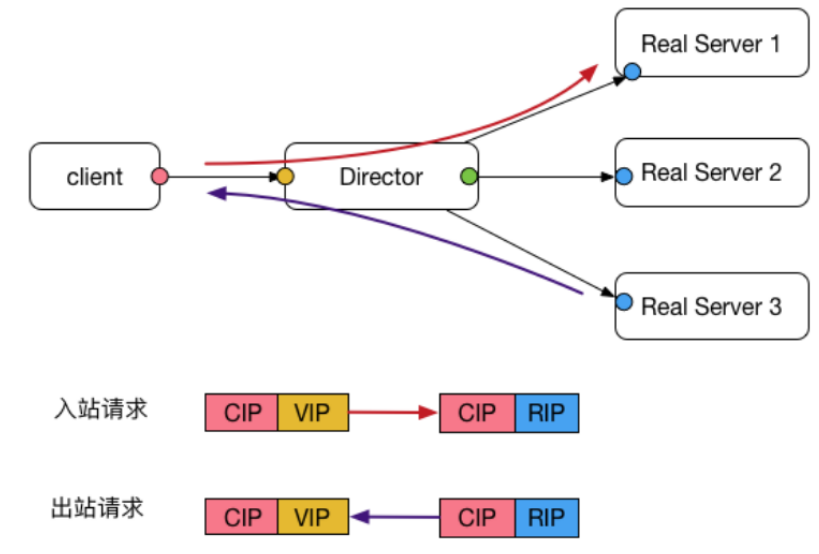
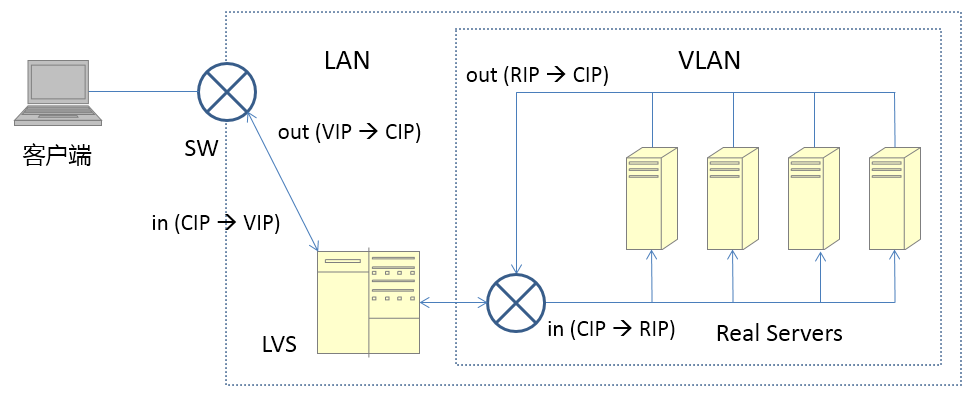
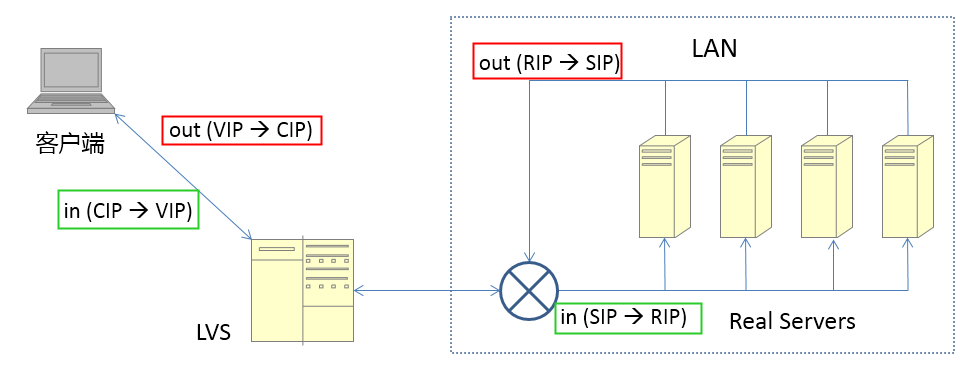
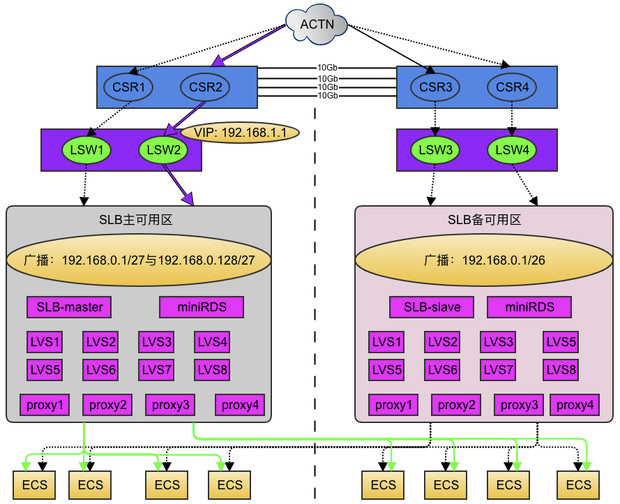
cip:Client IP,客户端地址
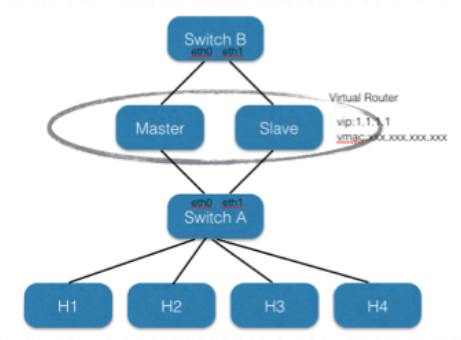
vip:Virtual IP,LVS实例IP
rip:Real IP,后端RS地址
RS: Real Server 后端真正提供服务的机器
LB: Load Balance 负载均衡器
LVS: Linux Virtual Server
sip: source ip
dip: destination
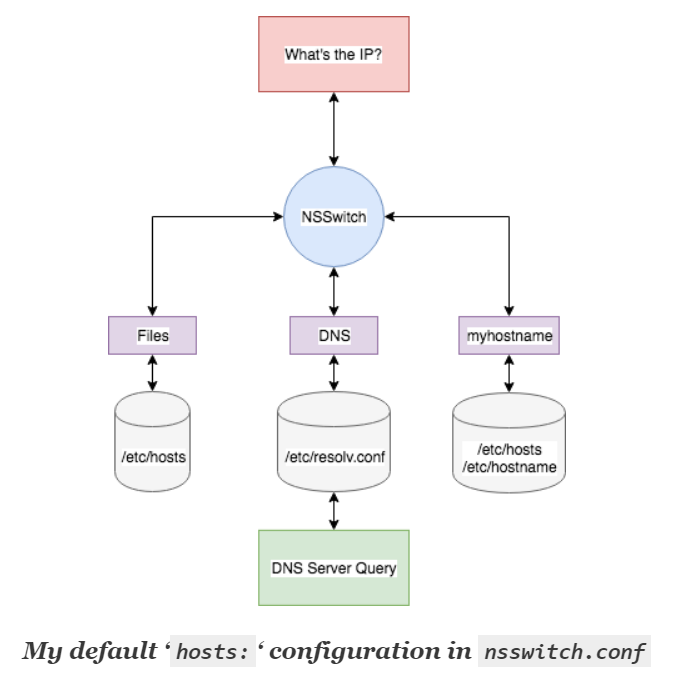
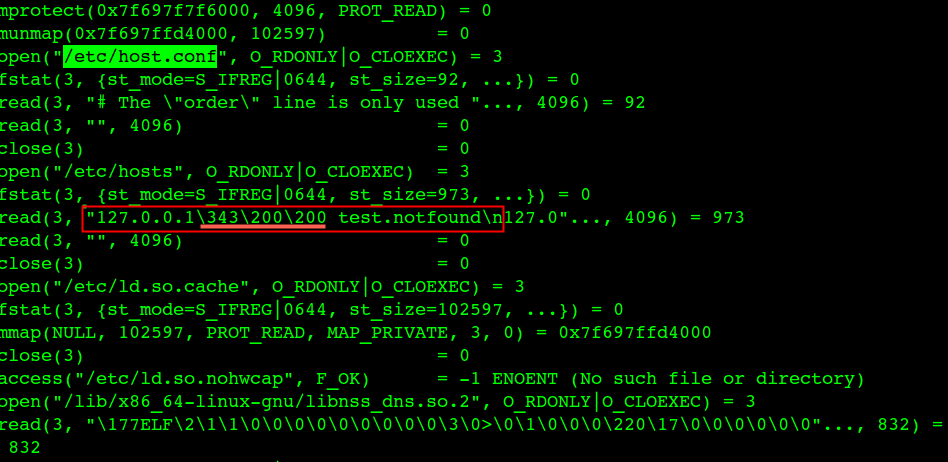
DNS域名解析的时候先根据 /etc/host.conf、/etc/nsswitch.conf 配置的顺序进行dns解析(name service switch),一般是这样配置:hosts: files dns 【files代表 /etc/hosts ; dns 代表 /etc/resolv.conf】(ping是这个流程,但是nslookup和dig不是)
$ cat ~/.ssh/config #reuse the same connection --关键配置 ControlMaster auto ControlPath ~/tmp/ssh_mux_%h_%p_%r #查了下ControlPersist是在OpenSSH5.6加入的,5.3还不支持 #不支持的话直接把这行删了,不影响功能 #keep one connection in 72hour #ControlPersist 72h #复用连接的配置到这里,后面的配置与复用无关 #其它也很有用的配置 GSSAPIAuthentication=no #这个配置在公网因为安全原因请谨慎关闭 StrictHostKeyChecking=no TCPKeepAlive=yes CheckHostIP=no # "ServerAliveInterval [seconds]" configuration in the SSH configuration so that your ssh client sends a "dummy packet" on a regular interval so that the router thinks that the connection is active even if it's particularly quiet ServerAliveInterval=15 #ServerAliveCountMax=6 ForwardAgent=yes
$cat ~/.ssh/config #GSSAPIAuthentication=no StrictHostKeyChecking=no #TCPKeepAlive=yes CheckHostIP=no # "ServerAliveInterval [seconds]" configuration in the SSH configuration so that your ssh client sends a "dummy packet" on a regular interval so that the router thinks that the connection is active even if it's particularly quiet ServerAliveInterval=15 #ServerAliveCountMax=6 ForwardAgent=yes
UserKnownHostsFile /dev/null #reuse the same connection ControlMaster auto ControlPath /tmp/ssh_mux_%h_%p_%r #keep one connection in 72hour ControlPersist 72h
Host 172 HostName 10.172.1.1 Port 22 User root ProxyJump root@1.2.3.4:12345
Host 176 HostName 10.176.1.1 Port 22 User root ProxyJump admin@1.2.3.4:12346 Host 10.5.*.*, 10.*.*.* port 22 user root ProxyJump plantegg@1.2.3.4:12347
run ssh-keygen -p in a terminal. It will then prompt you for a keyfile (defaulted to the correct file for me, ~/.ssh/id_rsa), the old passphrase (enter what you have now) and the new passphrase (enter nothing).
-m key_format Specify a key format for the -i (import) or -e (export) conversion options. The sup‐ ported key formats are: “RFC4716” (RFC 4716/SSH2 public or private key), “PKCS8” (PEM PKCS8 public key) or “PEM” (PEM public key). The default conversion format is “RFC4716”.
Specifies the proxy command for the connection. This command is launched prior to making the connection to Hostname. %h is replaced with the host defined in HostName and %p is replaced with 22 or is overridden by a Port directive.
ssh -Q cipher # List supported ciphers ssh -Q mac # List supported MACs ssh -Q key # List supported public key types ssh -Q kex # List supported key exchange algorithms
比如连服务器报如下错误:
1
2
debug1: kex: algorithm: (no match)
Unable to negotiate with server port 22: no matching key exchange method found. Their offer: diffie-hellman-group1-sha1,diffie-hellman-group14-sha1
debug2: first_kex_follows 0
debug2: reserved 0
debug1: kex: algorithm: diffie-hellman-group14-sha1
debug1: kex: host key algorithm: (no match)
Unable to negotiate with server_ip port 22: no matching host key type found. Their offer: ssh-rsa
When an SSH client connects to a server, each side offers lists of connection parameters to the other. These are, with the corresponding ssh_config keyword:
KexAlgorithms: the key exchange methods that are used to generate per-connection keys
HostkeyAlgorithms: the public key algorithms accepted for an SSH server to authenticate itself to an SSH client
Ciphers: the ciphers to encrypt the connection
MACs: the message authentication codes used to detect traffic modification
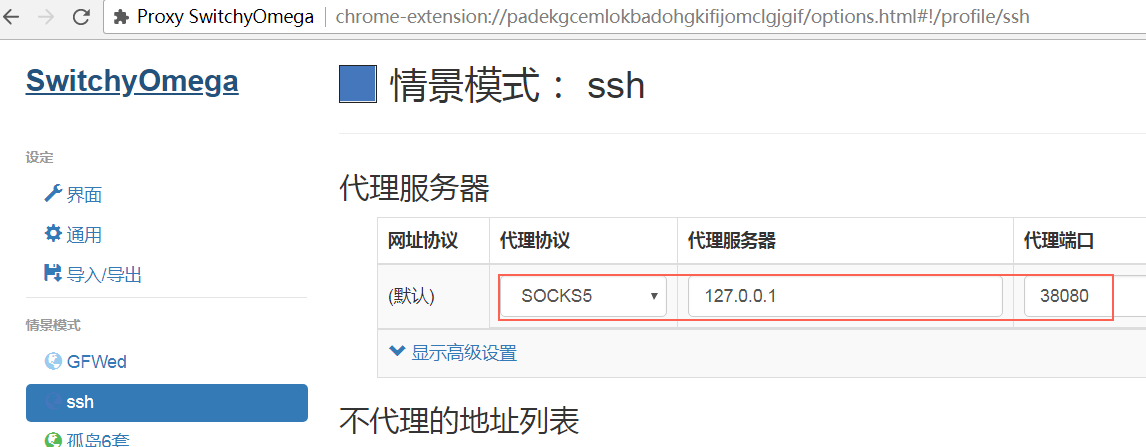
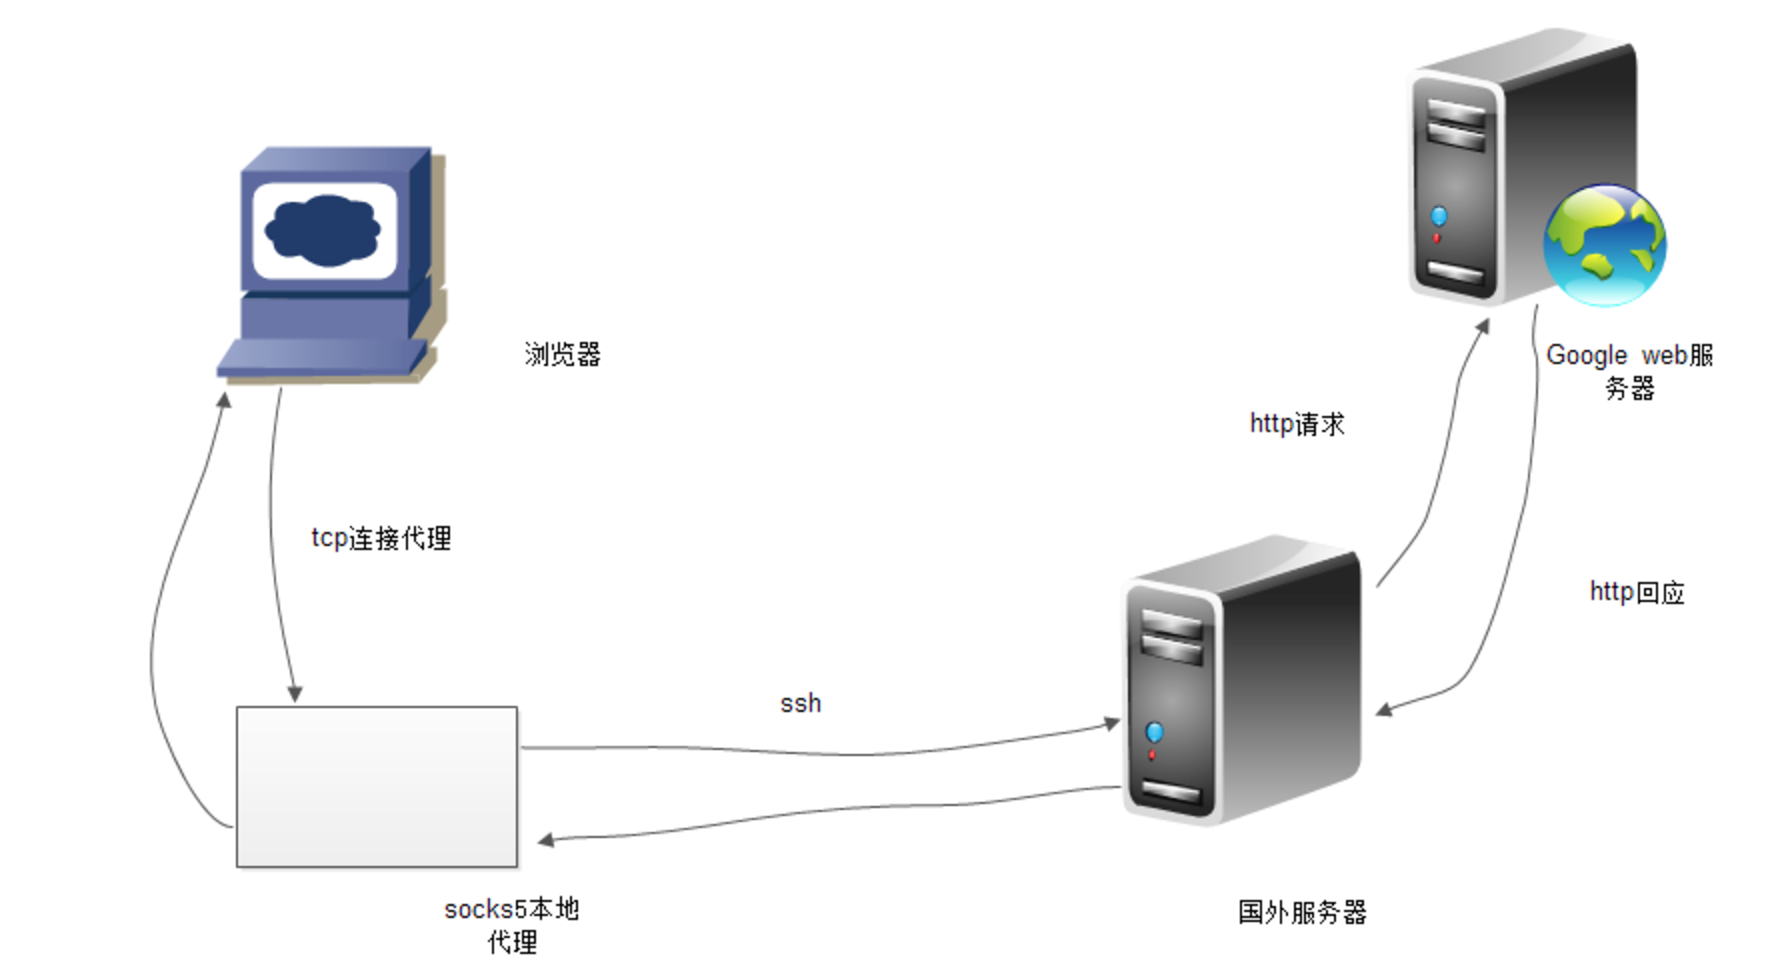
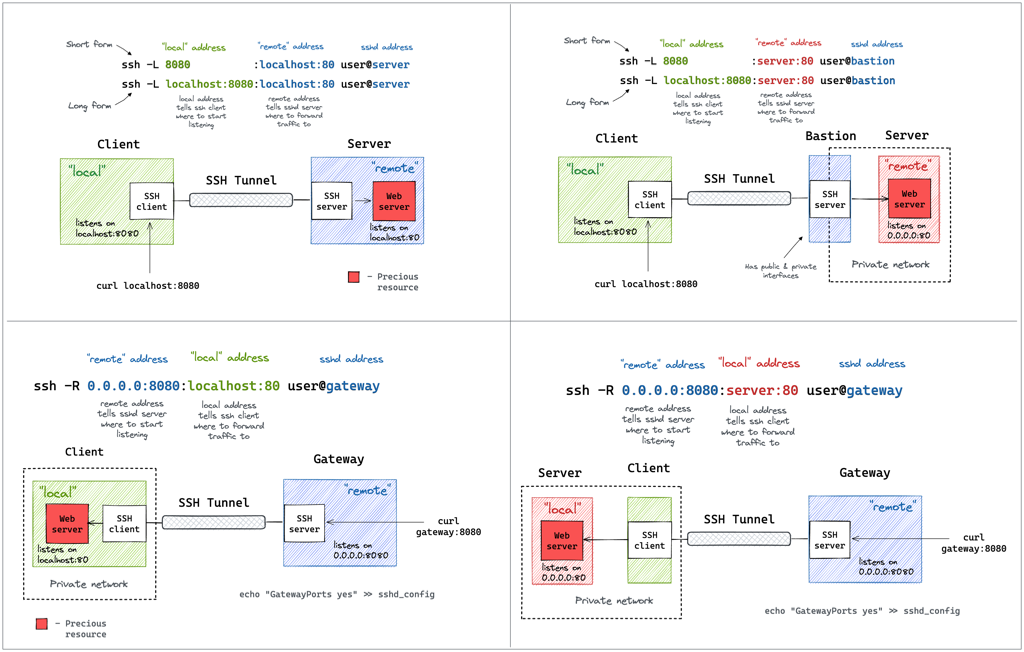
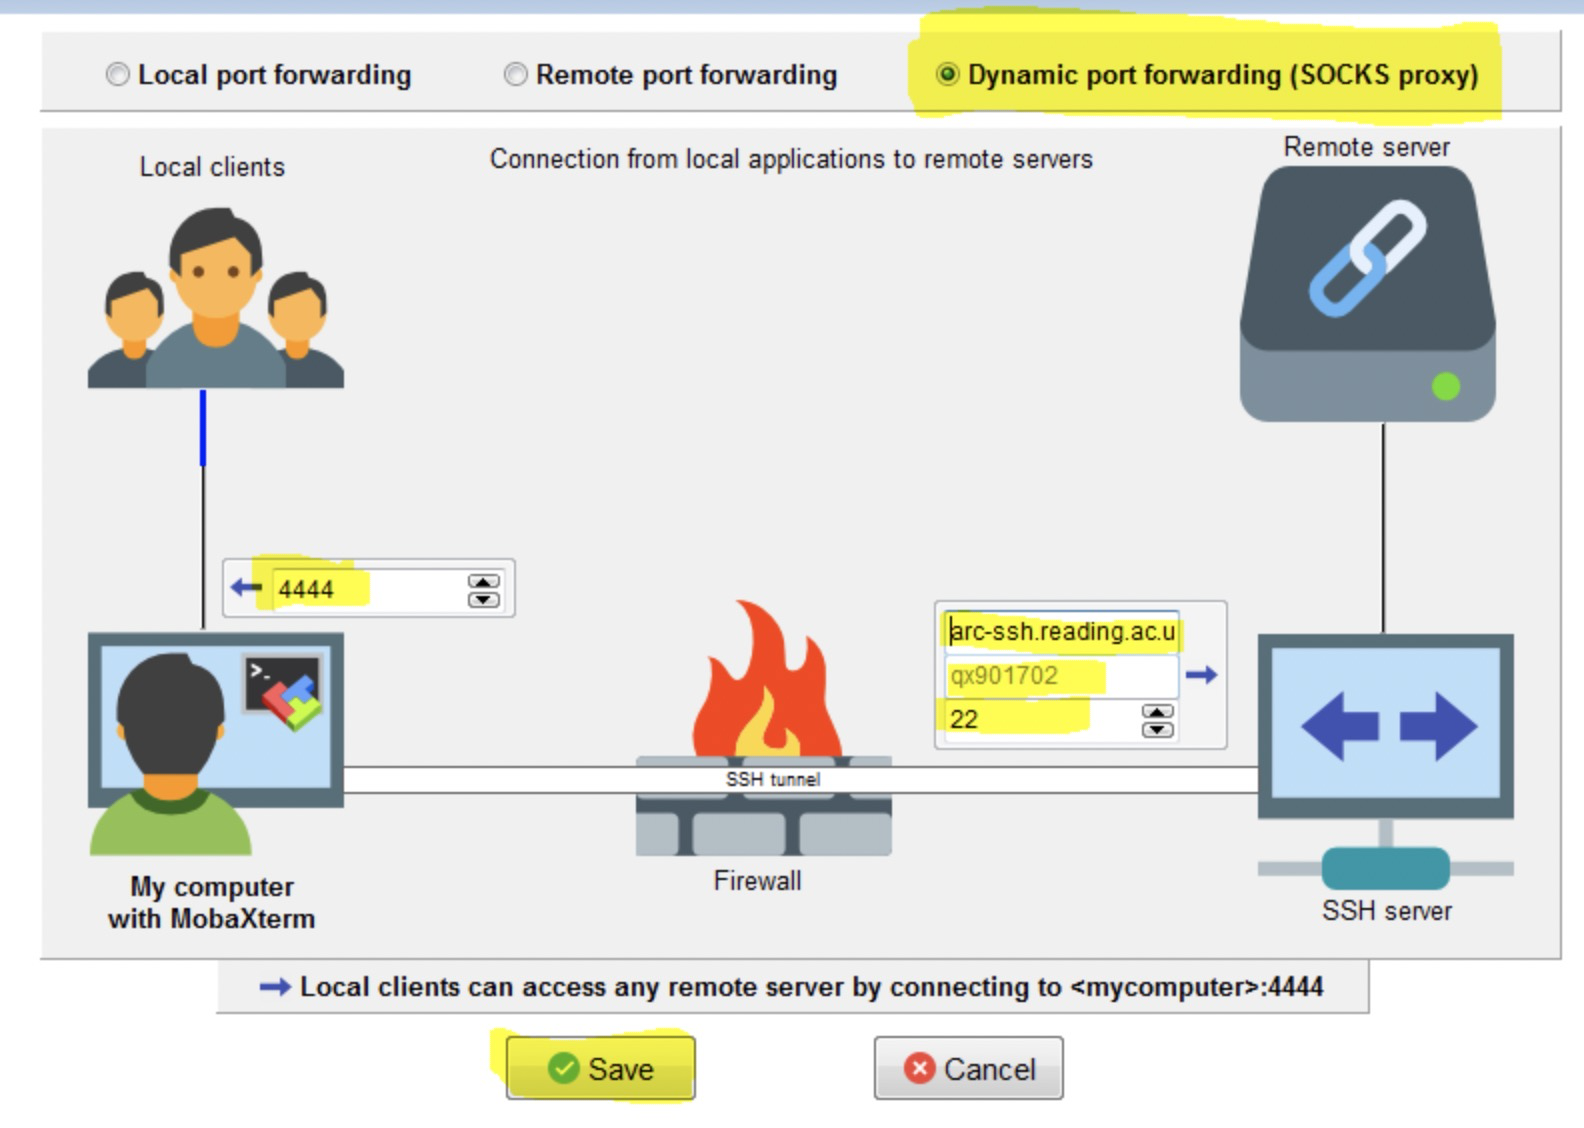
-D [bind_address:]port Specifies a local “dynamic” application-level port forwarding. This works by allocat‐ ing a socket to listen to port on the local side, optionally bound to the specified bind_address. Whenever a connection is made to this port, the connection is forwarded over the secure channel, and the application protocol is then used to determine where to connect to from the remote machine. Currently the SOCKS4 and SOCKS5 protocols are supported, and ssh will act as a SOCKS server. Only root can forward privileged ports. Dynamic port forwardings can also be specified in the configuration file.
In a proxy string, socks5h:// and socks4a:// mean that the hostname is resolved by the SOCKS server. socks5:// and socks4:// mean that the hostname is resolved locally. socks4a:// means to use SOCKS4a, which is an extension of SOCKS4. Let’s make urllib3 honor it.
The --socks5 option is basically considered obsolete since curl 7.21.7. This is because starting in that release, you can now specify the proxy protocol directly in the string that you specify the proxy host name and port number with already. The server you specify with --proxy. If you use a socks5:// scheme, curl will go with SOCKS5 with local name resolve but if you instead use socks5h:// it will pick SOCKS5 with proxy-resolved host name.
select id, name from t where id>1 and id<10; 假设表t的id列是一个非主键的普通索引,那么这个查询就需要回表。查询执行的时候根据索引条件 id>1 and id<10 找到符合条件的行地址(主键),因为id索引上肯定有id的值,但是没有name,这里需要返回id,name 所以找到这些记录的地址后还需要回表(按主键)去取到name的值;
对应地如果select id from t where id>1 and id<10; 就不需要回表了,假设命中5条记录,这5个id的值都在索引上就能取到为啥还额外去回表呢?回表大概率是很慢的,因为你取到的行地址不一定连续,可能需要多次磁盘read
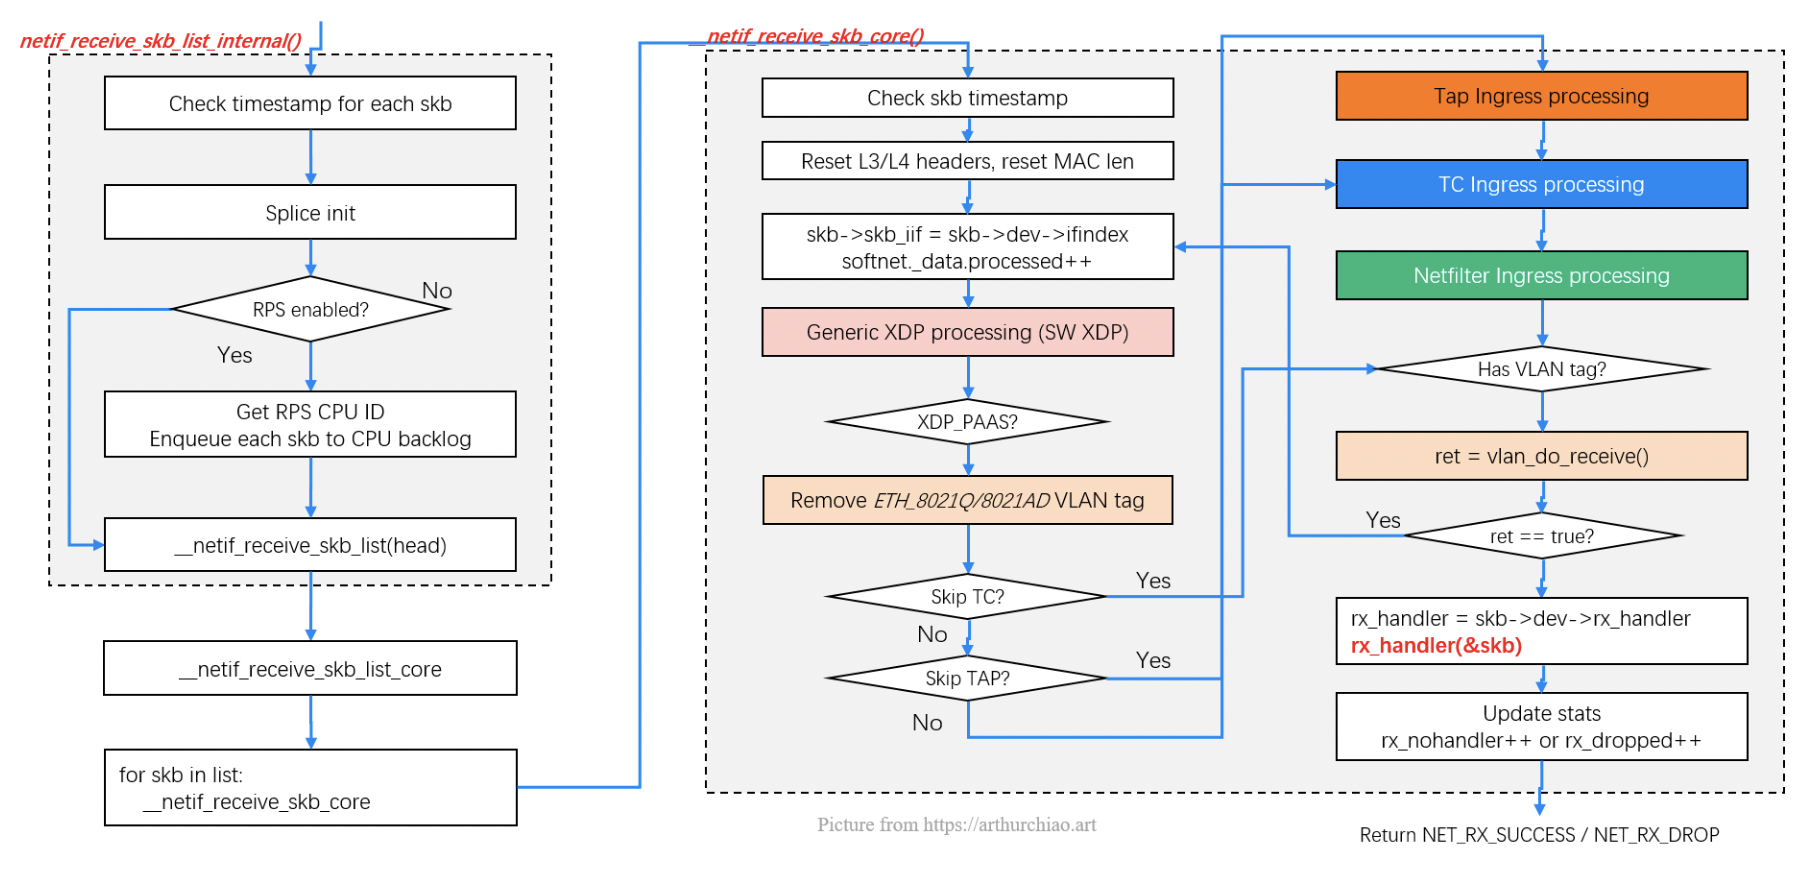
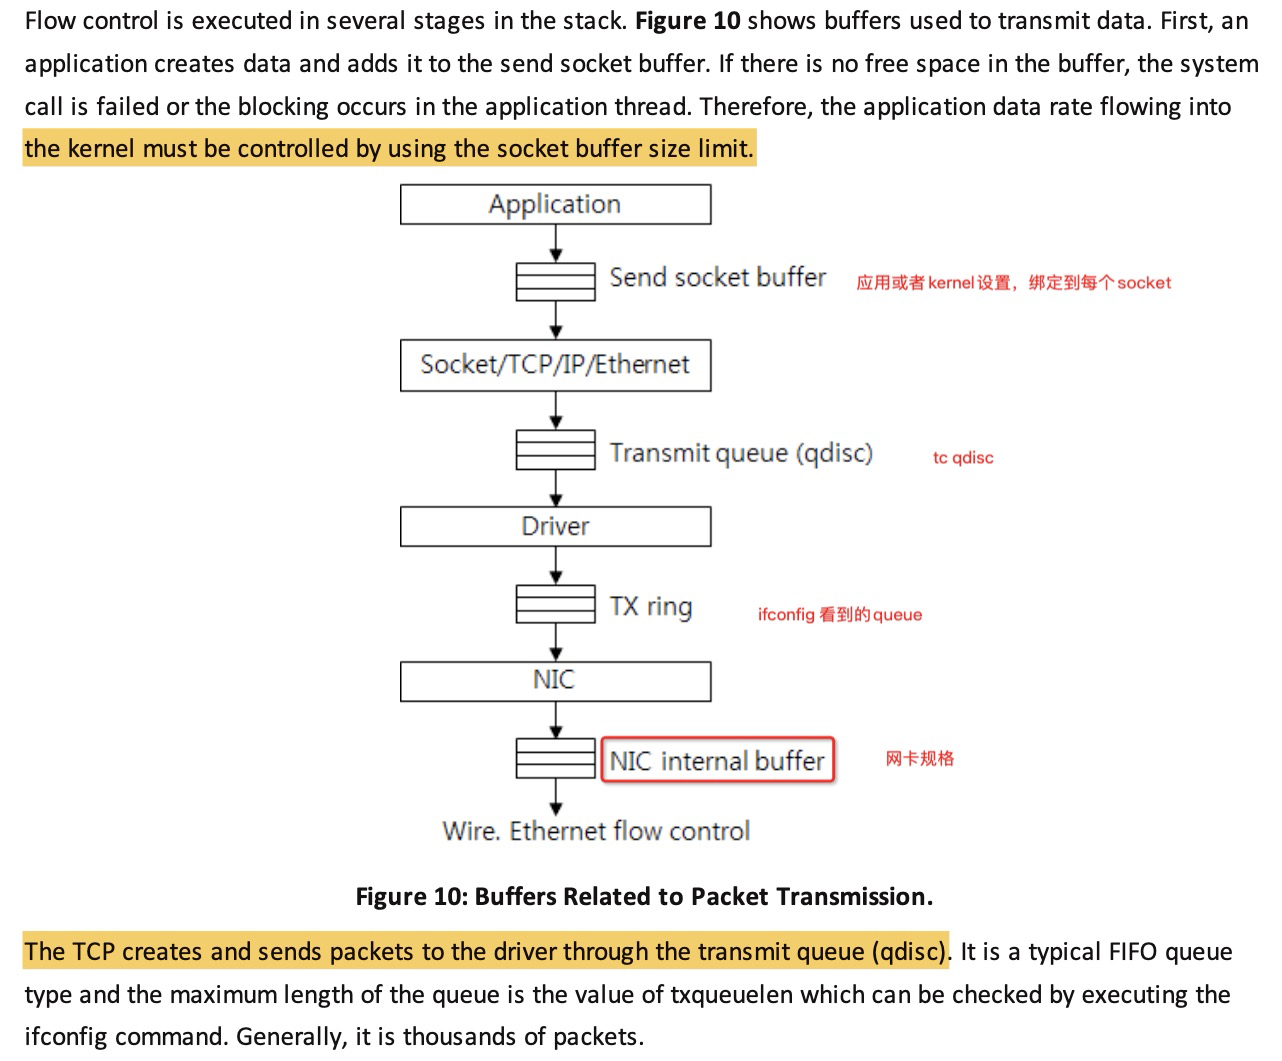
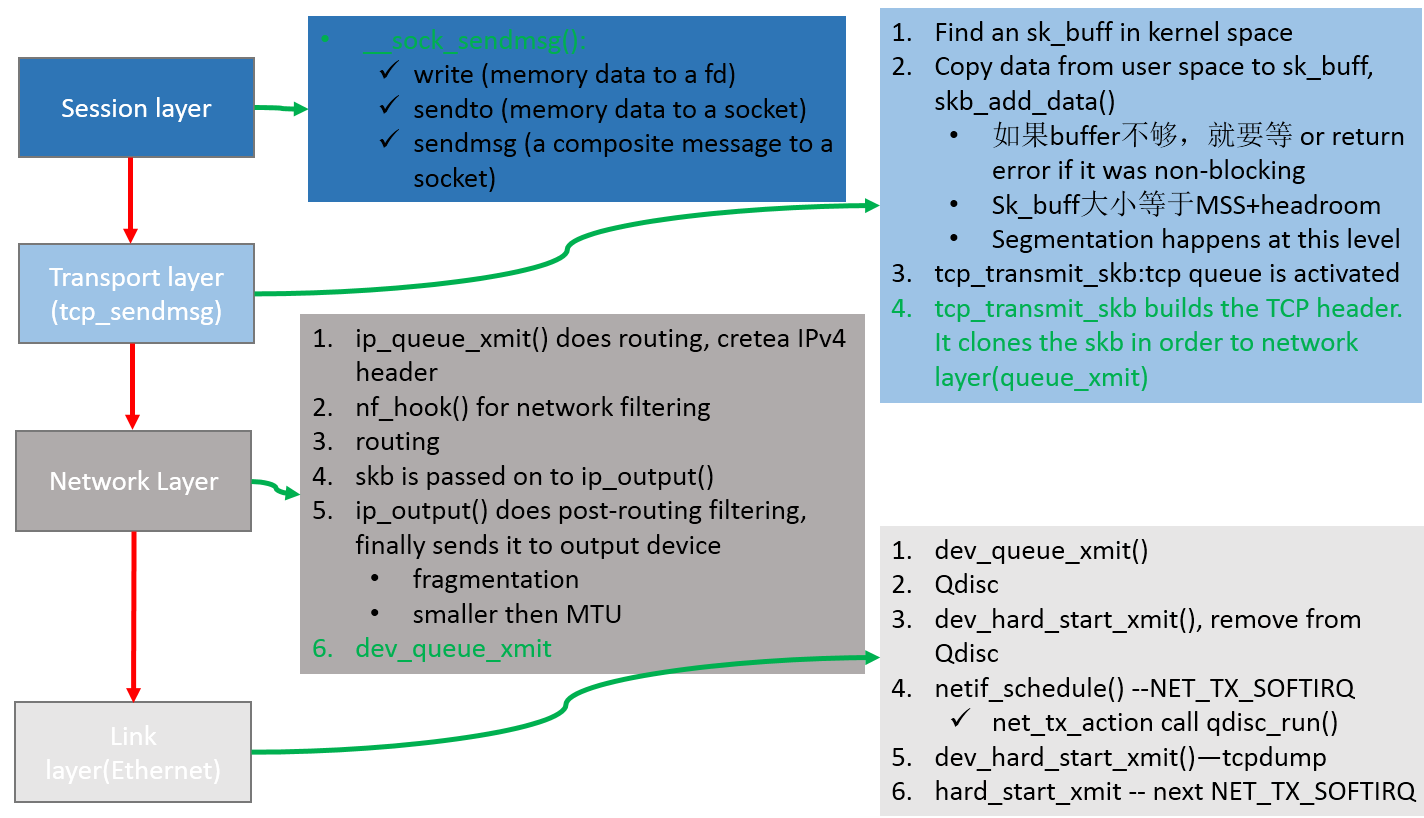
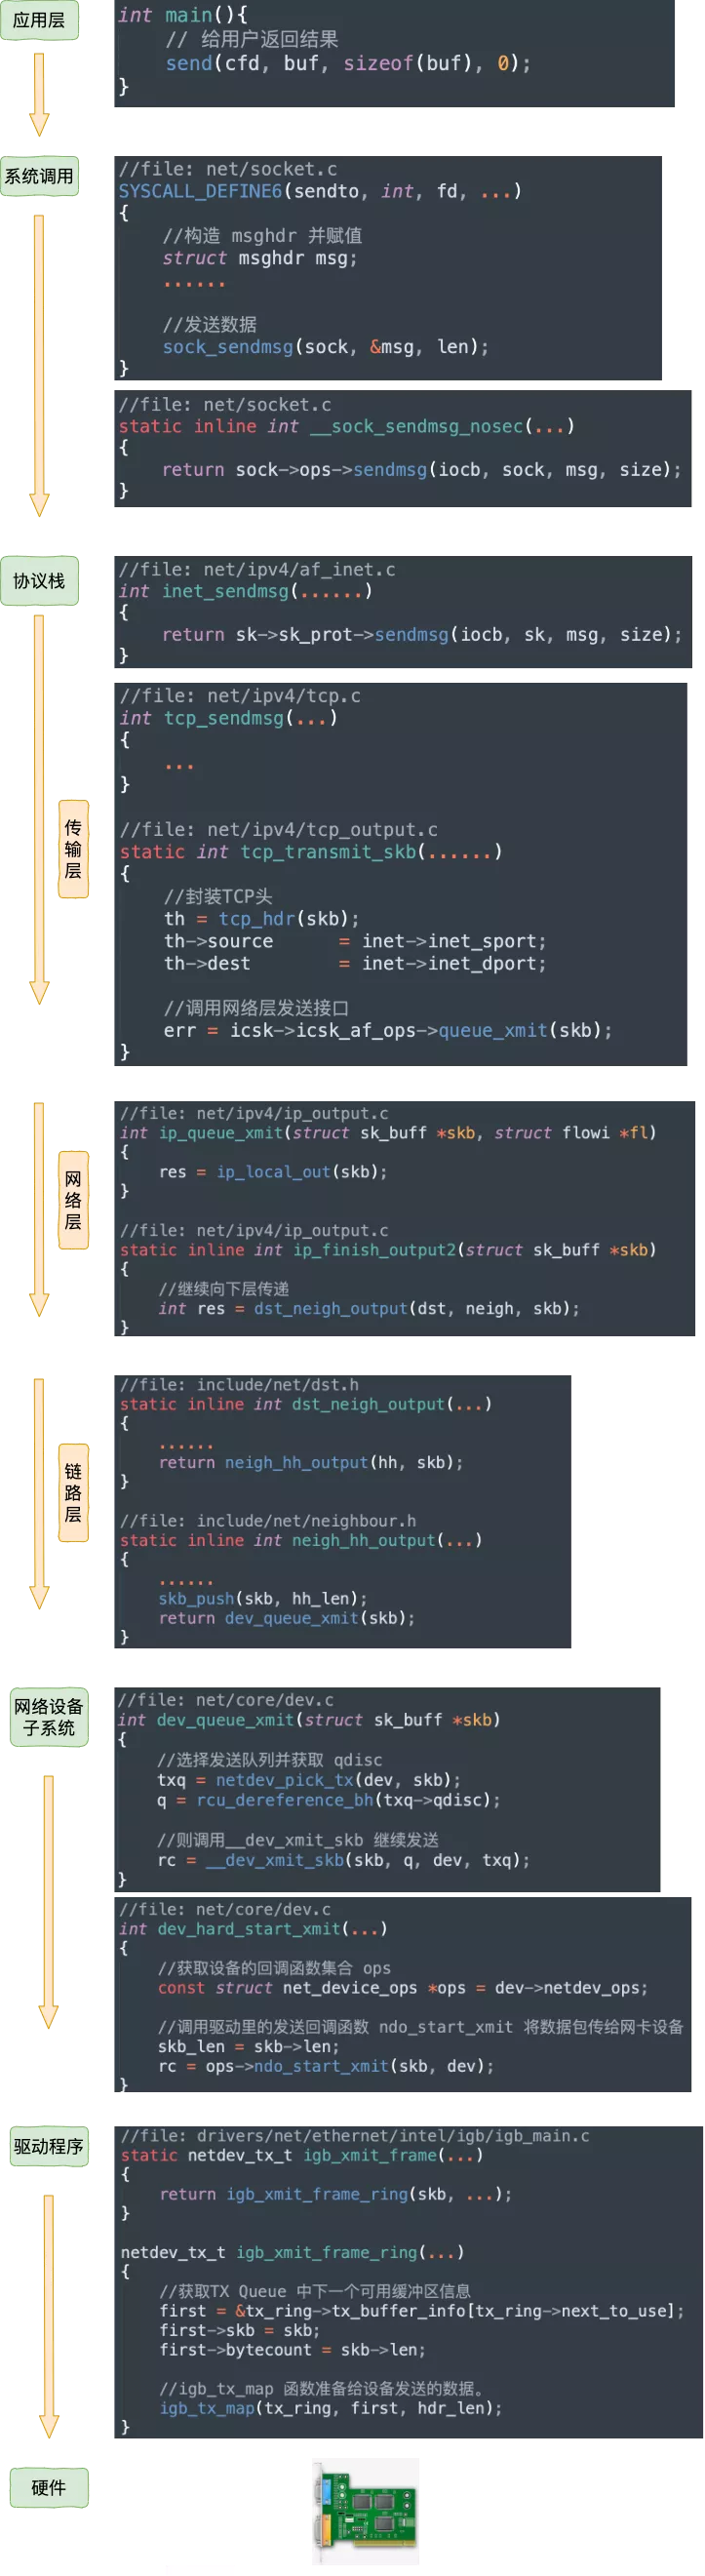
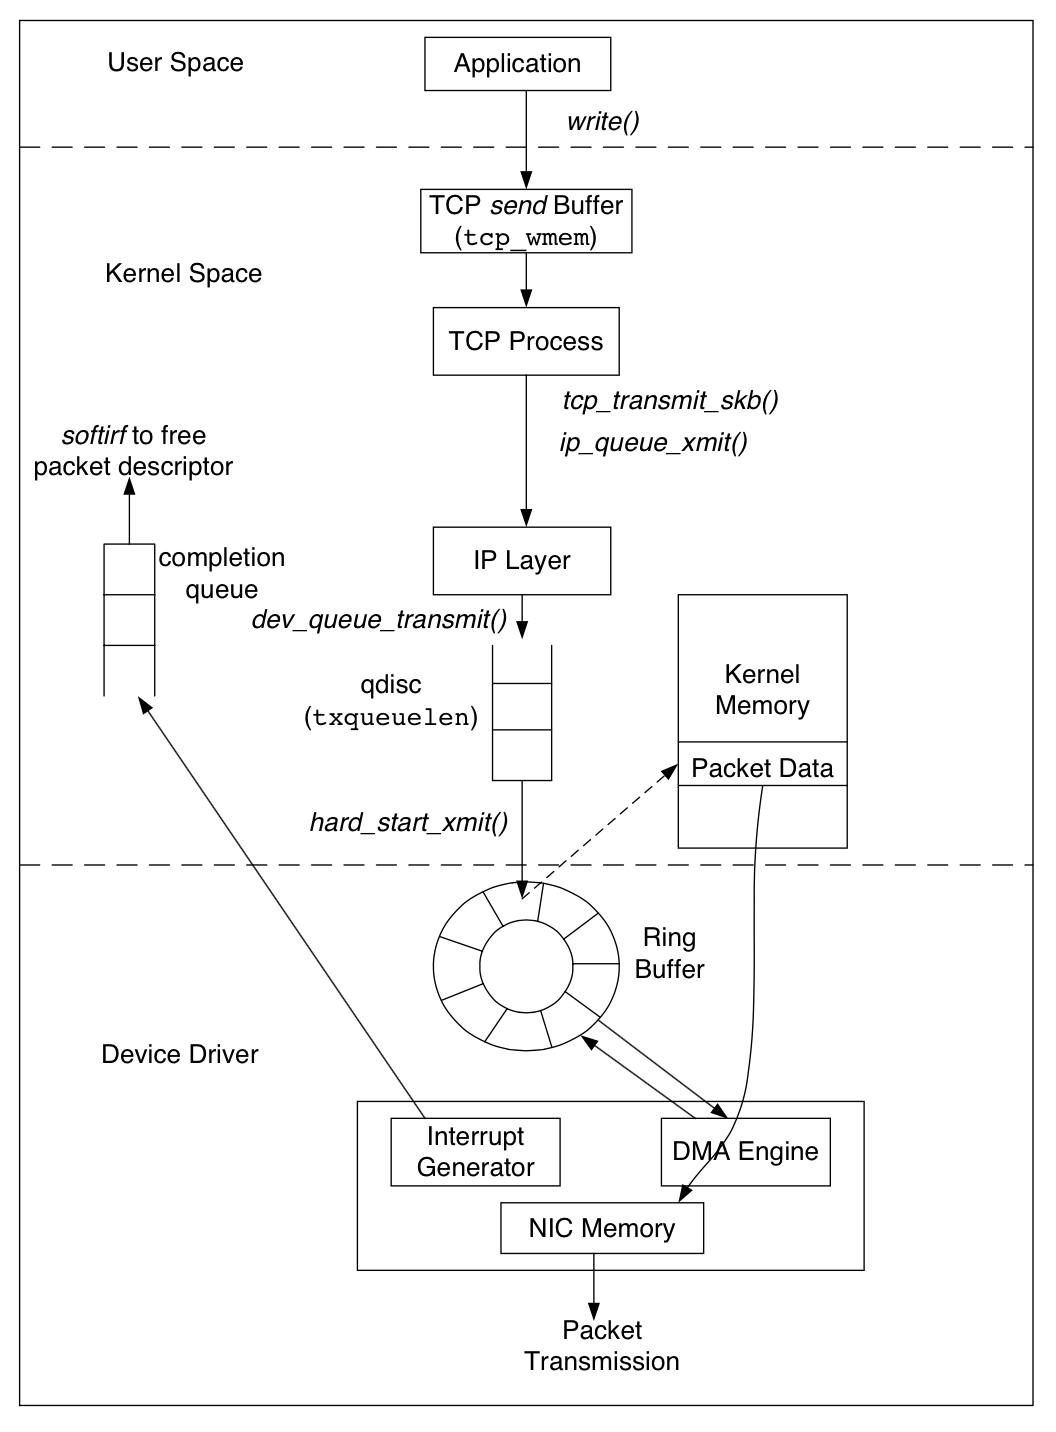
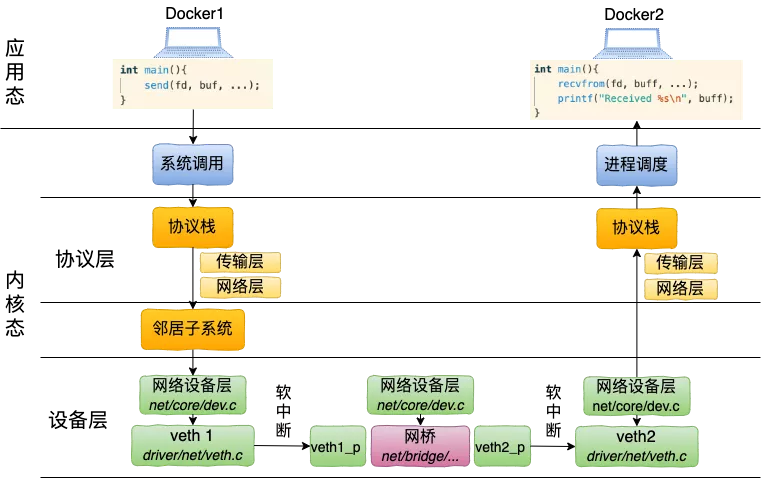
另外发包默认是系统调用完成的(占用 sy cpu),只有在包太多,为了避免系统调用长时间占用 CPU 导致应用层卡顿,这个时候内核给了发包时间一个quota(net.core.dev_weight 参数来控制),用完后即使包没发送完也退出发包的系统调用,队列中未发送完的包留待 tx-softirq 来发送(这是占用 si cpu)
Each line of /proc/net/softnet_stat corresponds to a struct softnet_data structure, of which there is 1 per CPU.
The values are separated by a single space and are displayed in hexadecimal
The first value, sd->processed, is the number of network frames processed. This can be more than the total number of network frames received if you are using ethernet bonding. There are cases where the ethernet bonding driver will trigger network data to be re-processed, which would increment the sd->processed count more than once for the same packet.
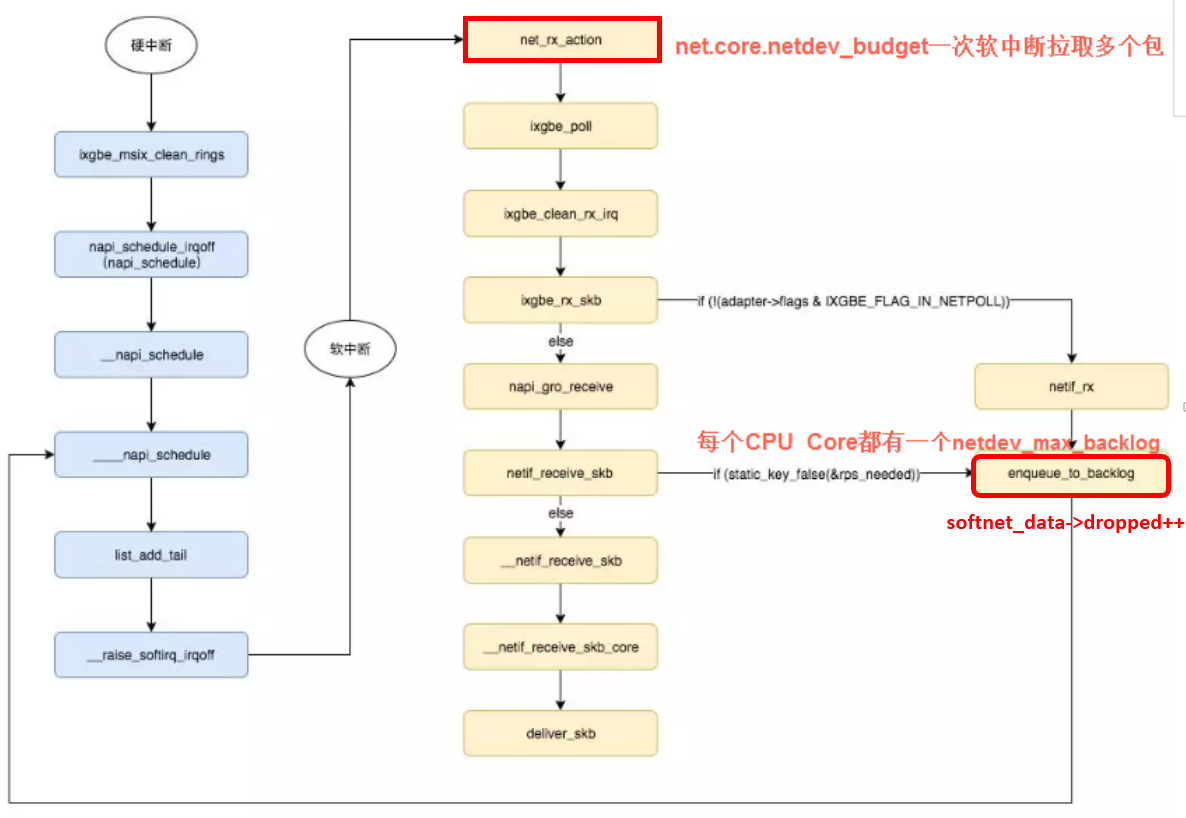
The second value, sd->dropped, is the number of network frames dropped because there was no room on the processing queue. More on this later.
The third value, sd->time_squeeze, is (as we saw) the number of times the net_rx_action loop terminated because the budget was consumed or the time limit was reached, but more work could have been. Increasing the budget as explained earlier can help reduce this. time_squeeze 计数在内核中只有一个地方会更新(比如内核 5.10),如果看到监控中有 time_squeeze 升高, 那一定就是执行到了以上 budget 用完的逻辑
The next 5 values are always 0.
The ninth value, sd->cpu_collision, is a count of the number of times a collision occurred when trying to obtain a device lock when transmitting packets. This article is about receive, so this statistic will not be seen below.
The tenth value, sd->received_rps, is a count of the number of times this CPU has been woken up to process packets via an Inter-processor Interrupt
The last value, flow_limit_count, is a count of the number of times the flow limit has been reached. Flow limiting is an optional Receive Packet Steering feature that will be examined shortly.
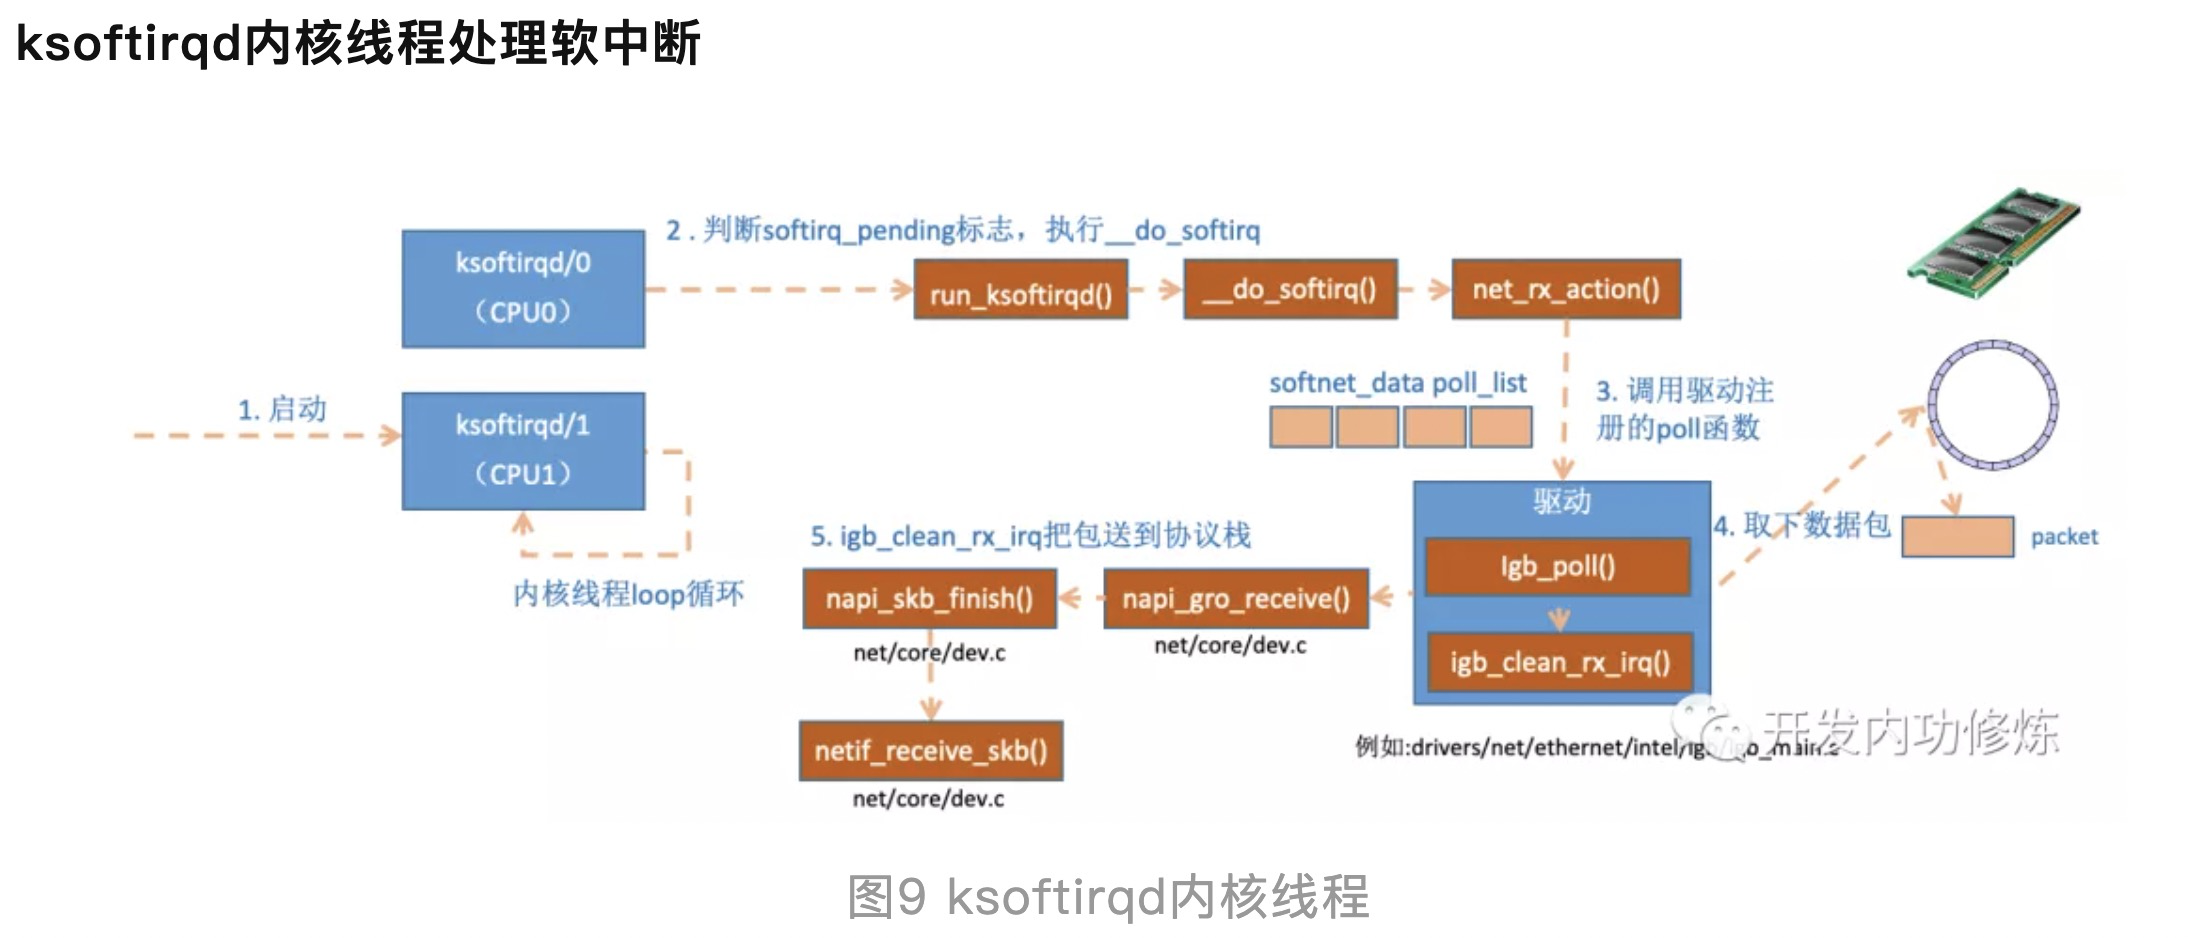
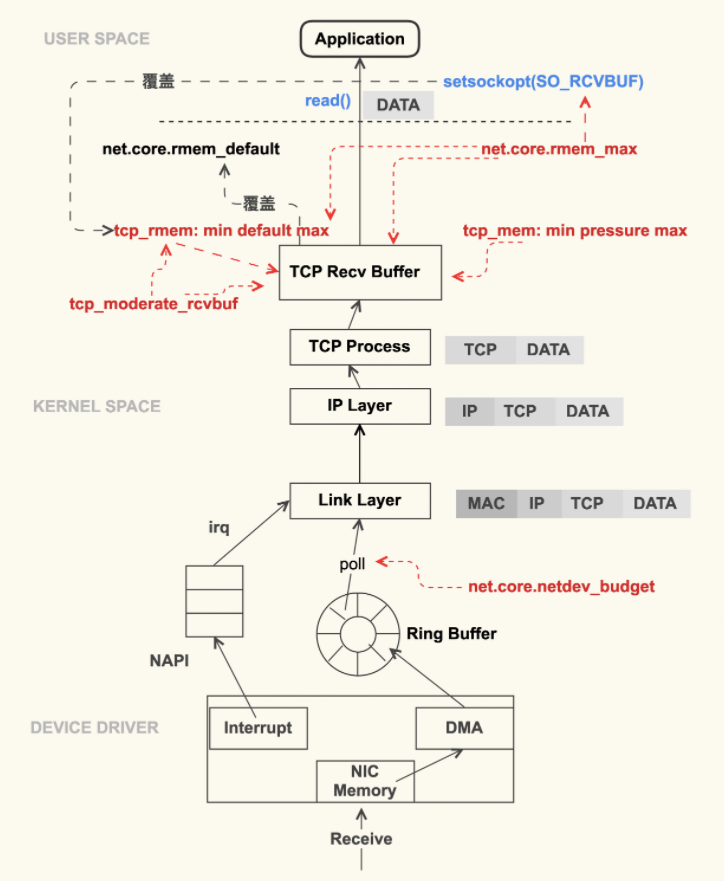
一次软中断(ksoftirqd进程)能处理包的上限,有就多处理,处理到300个了一定要停下来让CPU能继续其它工作。单次poll 收包是所有注册到这个 CPU 的 NAPI 变量收包数量之和不能大于这个阈值。
1
sysctl net.core.netdev_budget //3.10 kernel默认300, The default value of the budget is 300. This will cause the SoftIRQ process to drain 300 messages from the NIC before getting off the CPU
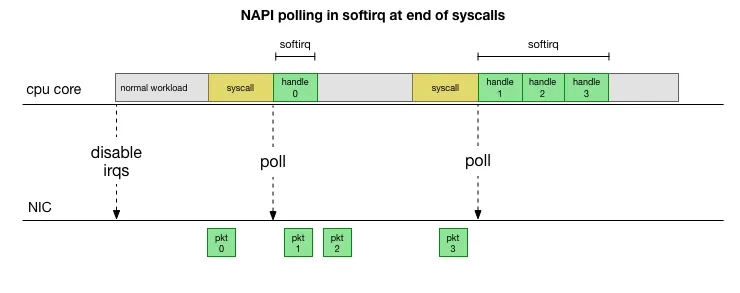
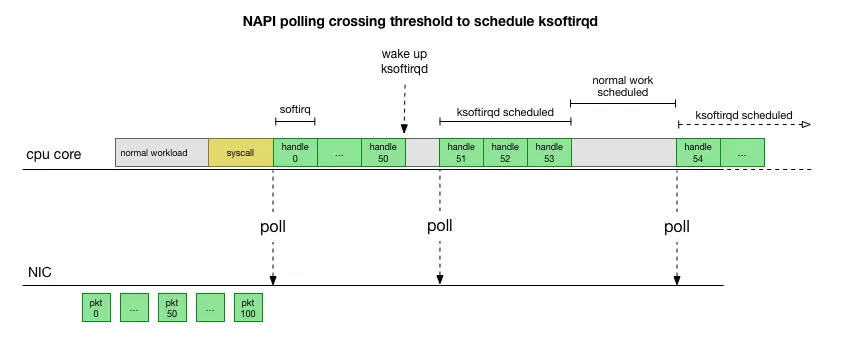
来源 This is much faster, but brings up another problem. What happens if we have so many packets to process that we spend all our time processing packets from the NIC, but we never have time to let the userspace processes actually drain those queues (read from TCP connections, etc.)? Eventually the queues would fill up, and we’d start dropping packets. To try and make this fair, the kernel limits the amount of packets processed in a given softirq context to a certain budget. Once this budget is exceeded, it wakes up a separate thread called ksoftirqd (you’ll see one of these in ps for each core) which processes these softirqs outside of the normal syscall/interrupt path. This thread is scheduled using the standard process scheduler, which already tries to be fair.
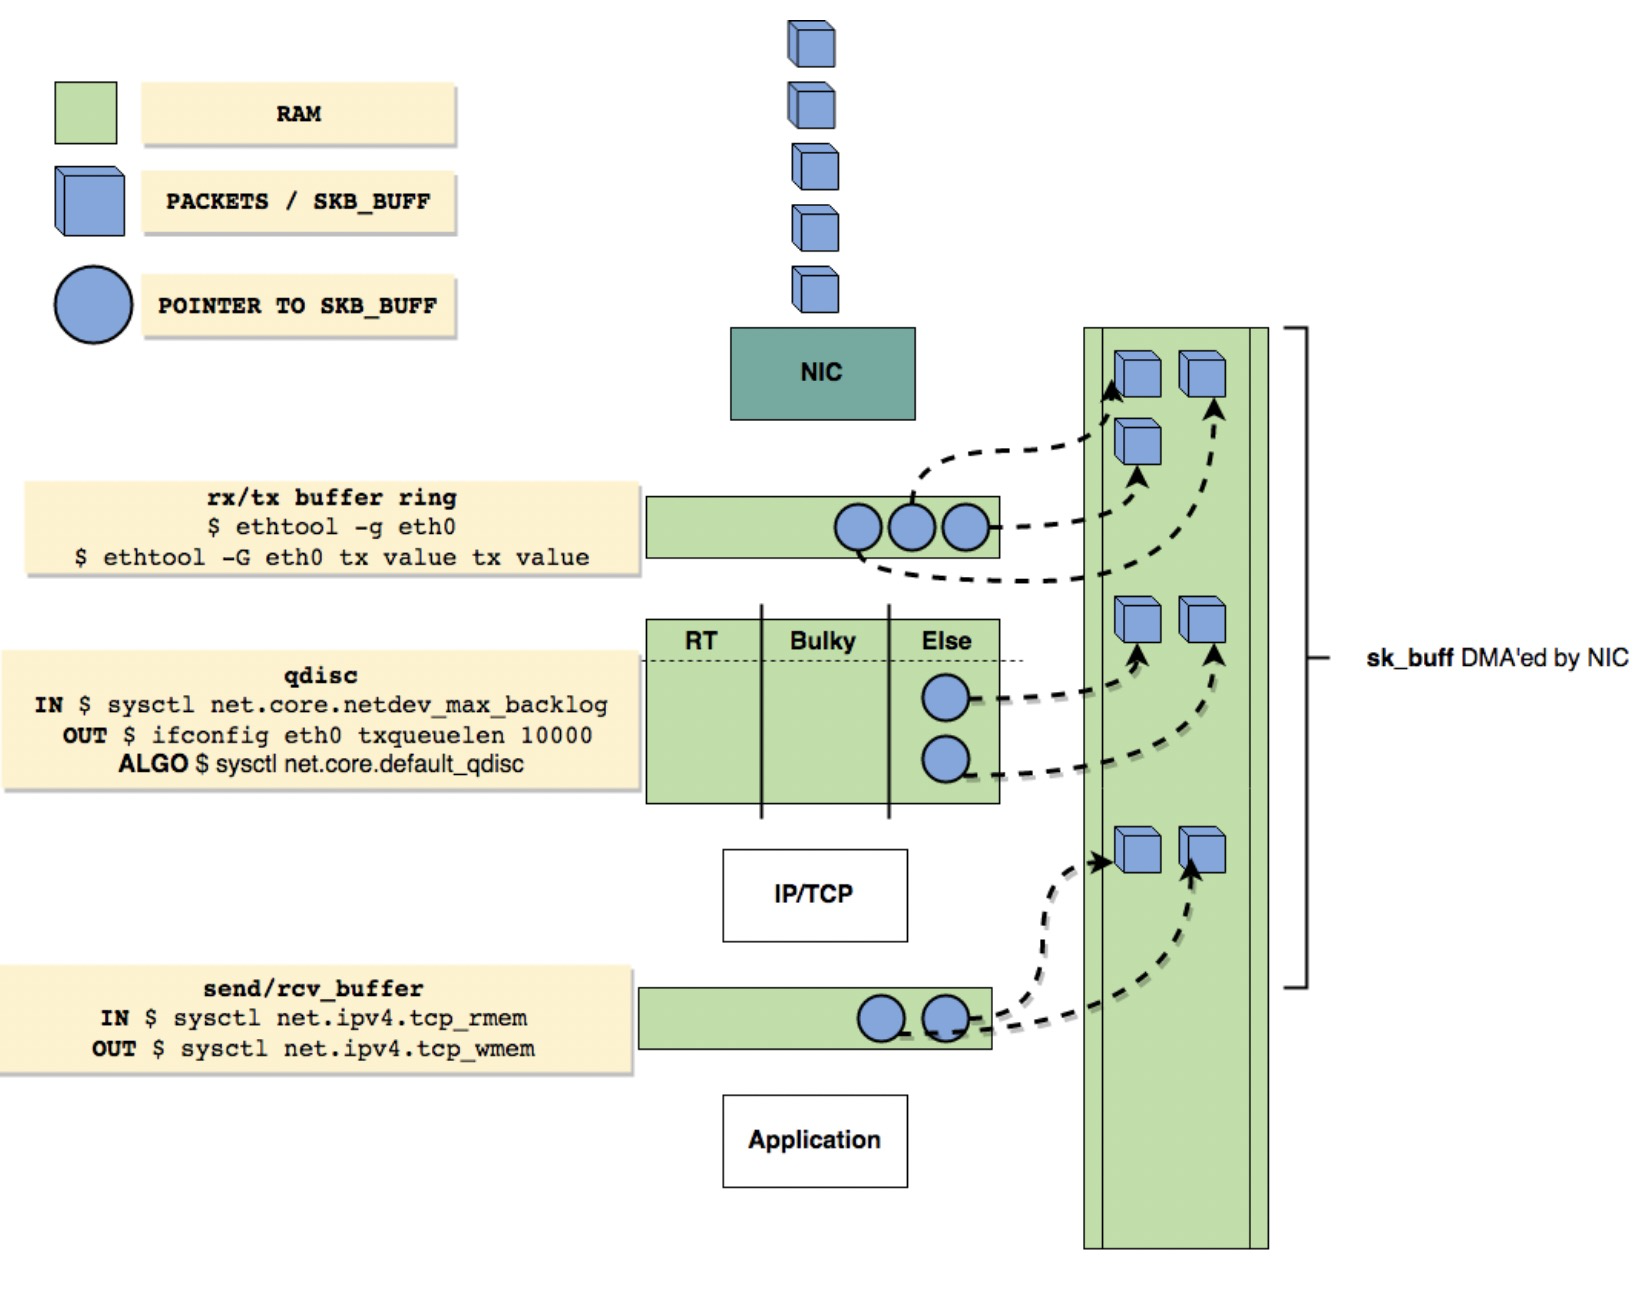
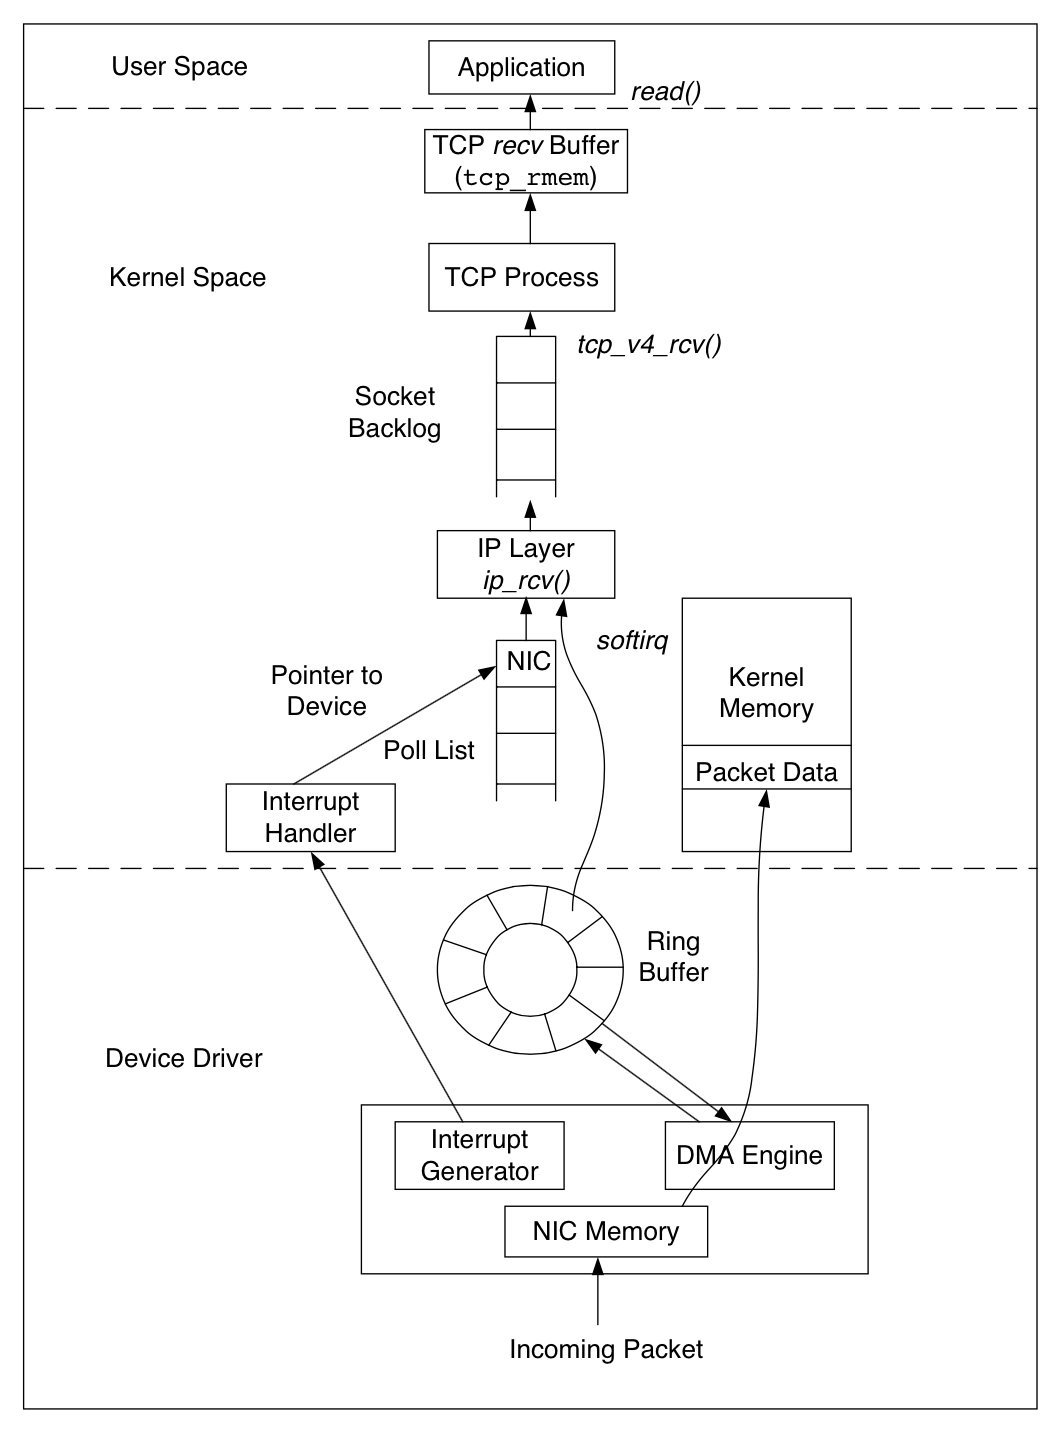
The netdev_max_backlog is a queue within the Linux kernel where traffic is stored after reception from the NIC, but before processing by the protocol stacks (IP, TCP, etc). There is one backlog queue per CPU core.
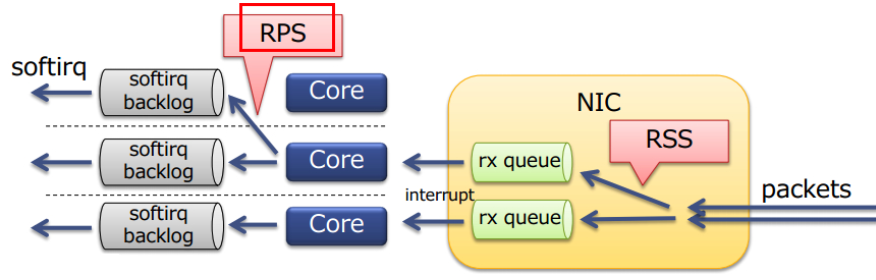
Linux 网络协议栈收消息过程-Ring Buffer : 支持 RSS 的网卡内部会有多个 Ring Buffer,NIC 收到 Frame 的时候能通过 Hash Function 来决定 Frame 该放在哪个 Ring Buffer 上,触发的 IRQ 也可以通过操作系统或者手动配置 IRQ affinity 将 IRQ 分配到多个 CPU 上。这样 IRQ 能被不同的 CPU 处理,从而做到 Ring Buffer 上的数据也能被不同的 CPU 处理,从而提高数据的并行处理能力。
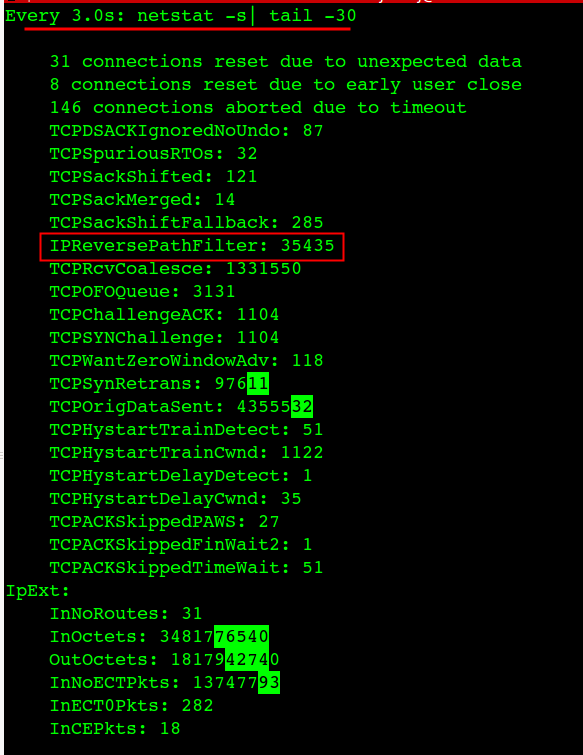
$netstat -s |egrep -i "drop|route|overflow|filter|retran|fails|listen" 12 dropped because of missing route 30 times the listen queue of a socket overflowed 30 SYNs to LISTEN sockets dropped IPReversePathFilter: 35435 InNoRoutes: 31
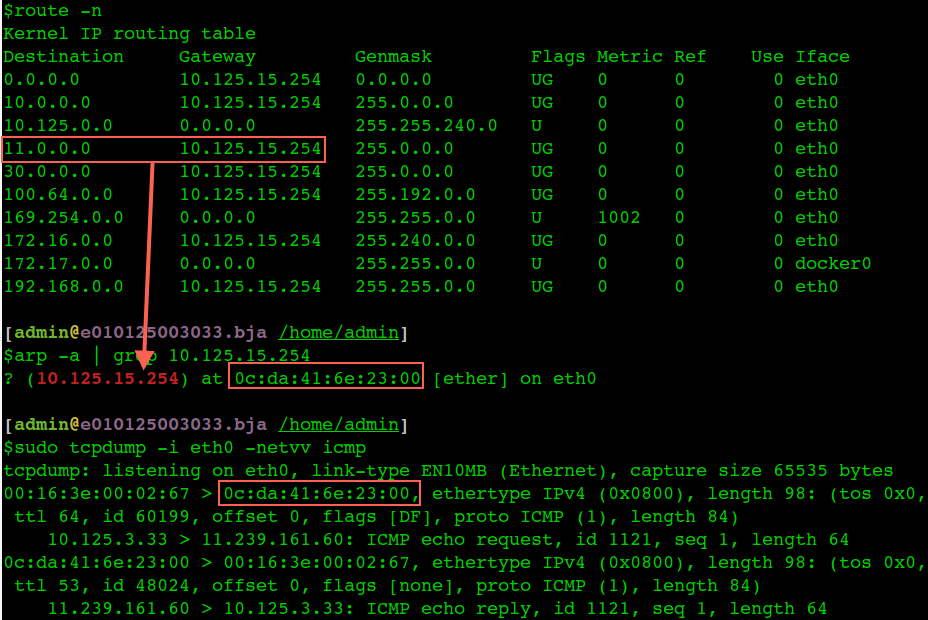
$arp -a
e010125011202.bja.tbsite.net (10.125.11.202) at 00:16:3e:01:c2:00 [ether] on eth0
? (10.125.15.254) at 0c:da:41:6e:23:00 [ether] on eth0
v125004187.bja.tbsite.net (10.125.4.187) at 00:16:3e:01:cb:00 [ether] on eth0
e010125001224.bja.tbsite.net (10.125.1.224) at 00:16:3e:01:64:00 [ether] on eth0
v125009121.bja.tbsite.net (10.125.9.121) at 00:16:3e:01:b8:ff [ether] on eth0
e010125009114.bja.tbsite.net (10.125.9.114) at 00:16:3e:01:7c:00 [ether] on eth0
v125012028.bja.tbsite.net (10.125.12.28) at 00:16:3e:00:fb:ff [ether] on eth0
e010125005234.bja.tbsite.net (10.125.5.234) at 00:16:3e:01:ee:00 [ether] on eth0
$netstat -tn
Active Internet connections (w/o servers)
Proto Recv-Q Send-Q Local Address   Foreign Address State
tcp0  0 server:8182  client-1:15260 SYN_RECV
tcp0 28 server:22    client-1:51708  ESTABLISHED
tcp0  0 server:2376  client-1:60269 ESTABLISHED
netstat -tn 看到的 Recv-Q 跟全连接半连接没有关系,这里特意拿出来说一下是因为容易跟 ss -lnt 的 Recv-Q 搞混淆。
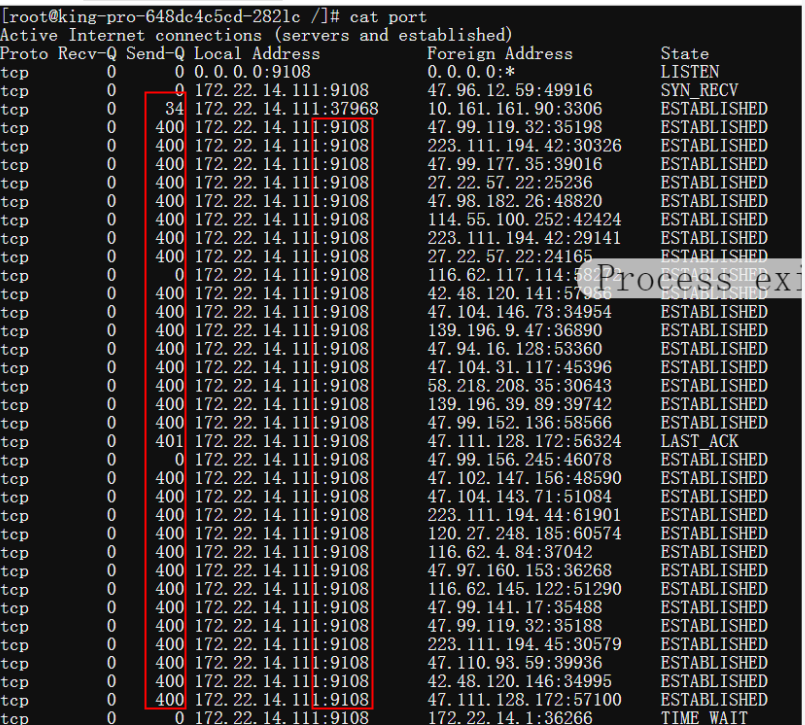
Recv-Q 和 Send-Q 的说明
Recv-Q Established: The count of bytes not copied by the user program connected to this socket. Listening: Since Kernel 2.6.18 this column contains the current syn backlog.
Send-Q Established: The count of bytes not acknowledged by the remote host. Listening: Since Kernel 2.6.18 this column contains the maximum size of the syn backlog.