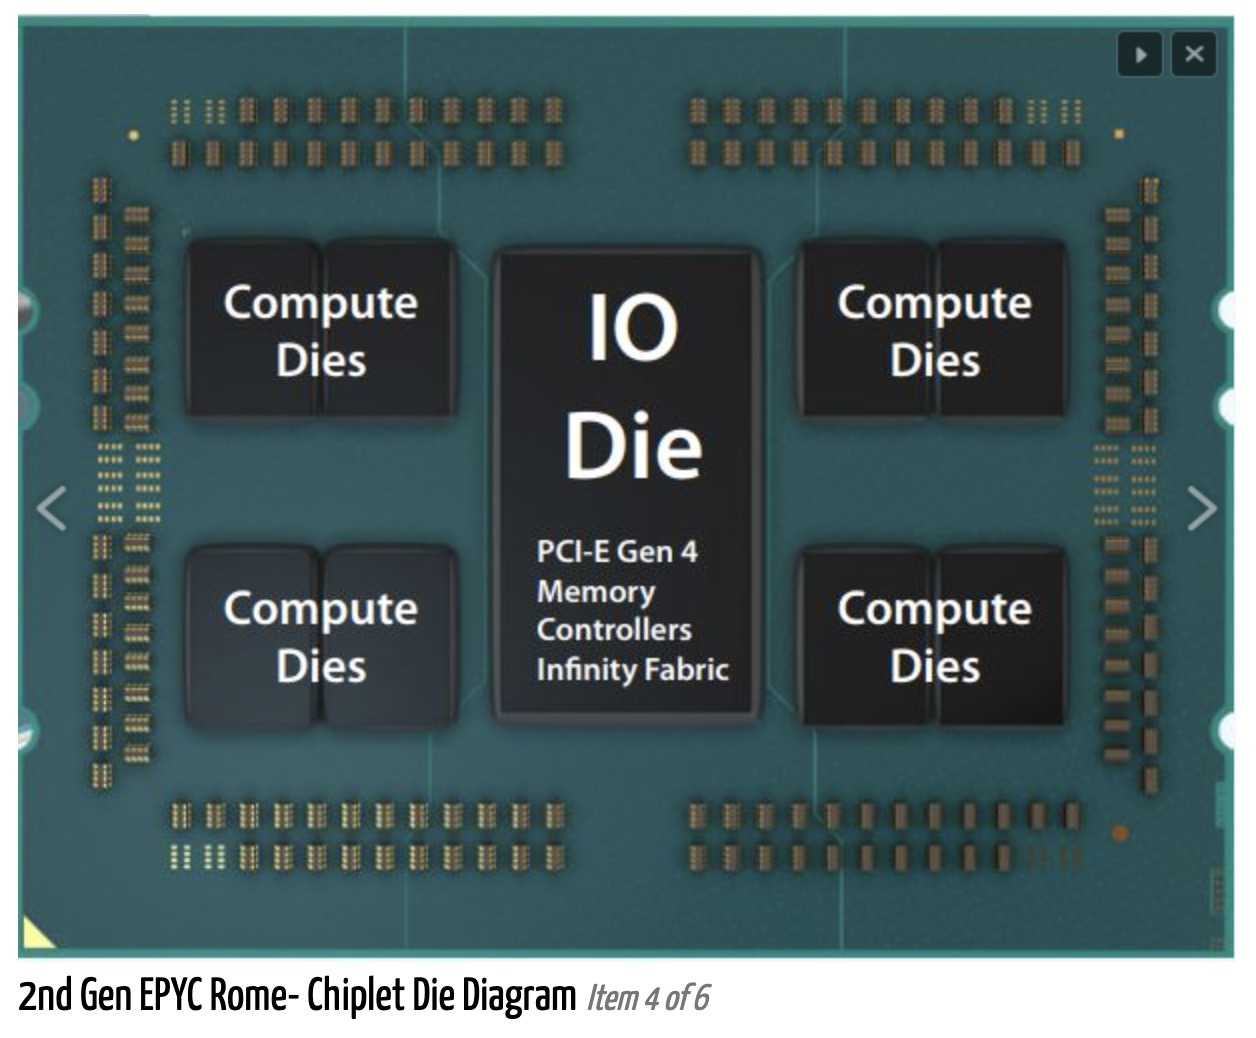
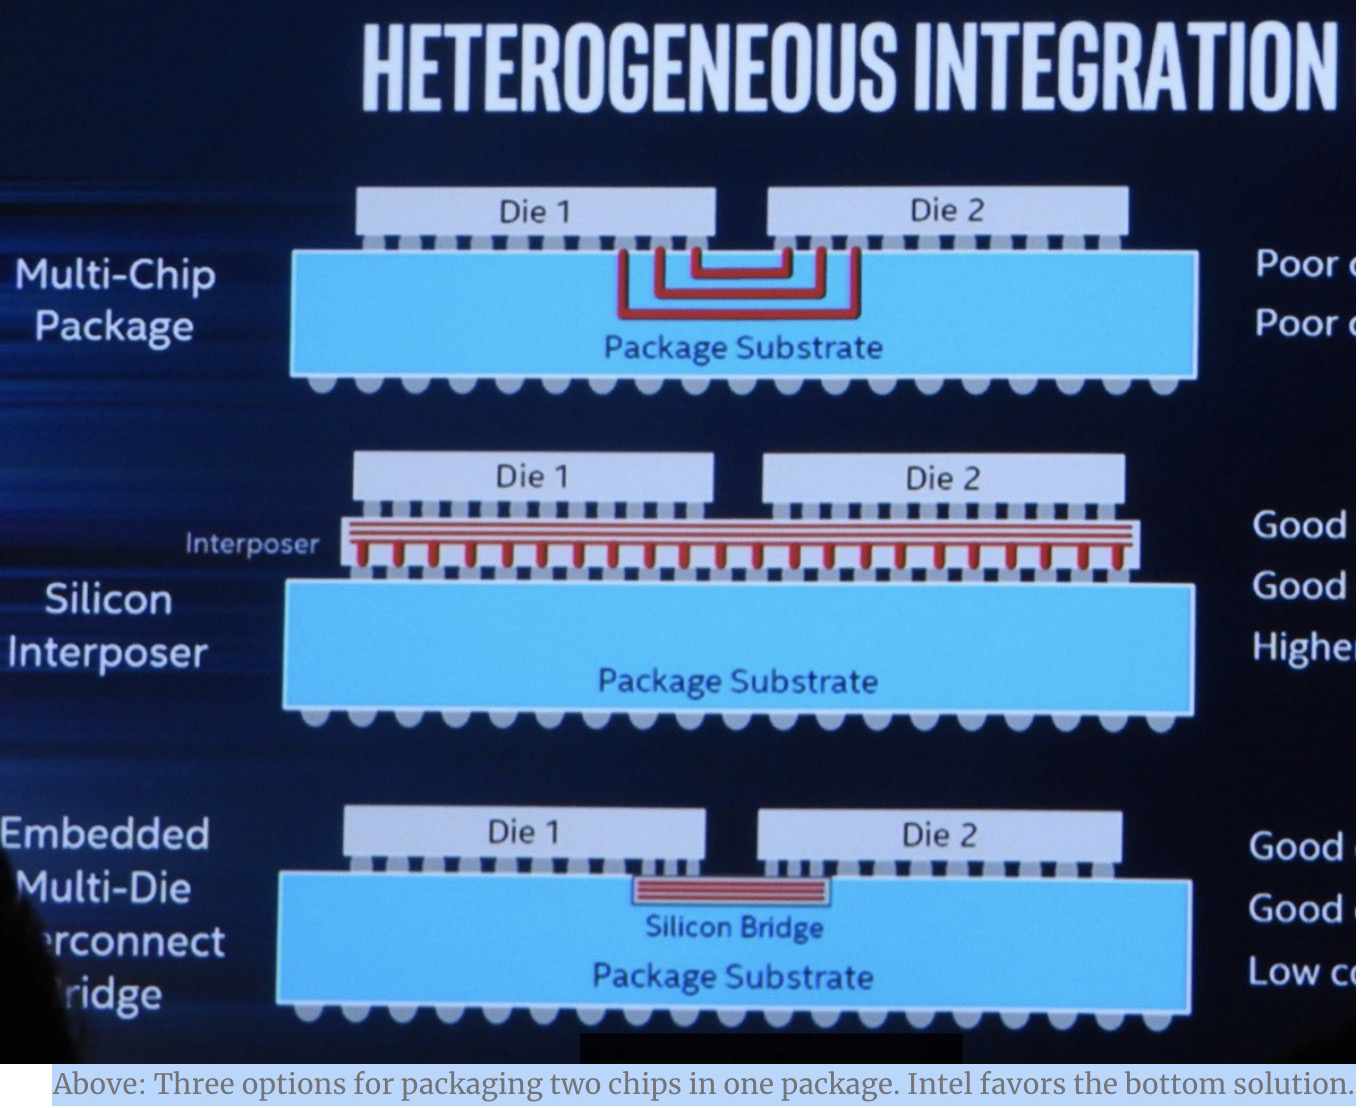
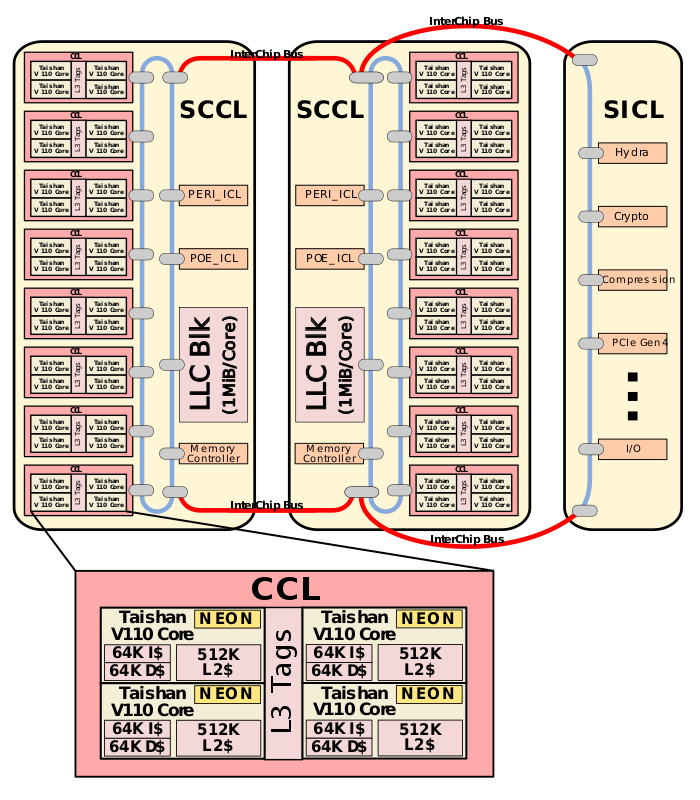
Though Huawei has been keeping a tight lip on the chip design itself, the Hi1620 is actually a multi-chip design. Actually, we believe are three dies. The chip itself comprise two compute dies called the Super CPU cluster (SCCL), each one packing 32 cores. It’s also possible the SCCL only have 24 cores, in which case there are three such dies with a theoretical maximum core count of 72 cores possible but are not offered for yield reasons. Regardless of this, there are at least two SCCL dies for sure. Additionally, there is also an I/O die called the Super IO Cluster (SICL) which contains all the high-speed SerDes and low-speed I/Os.
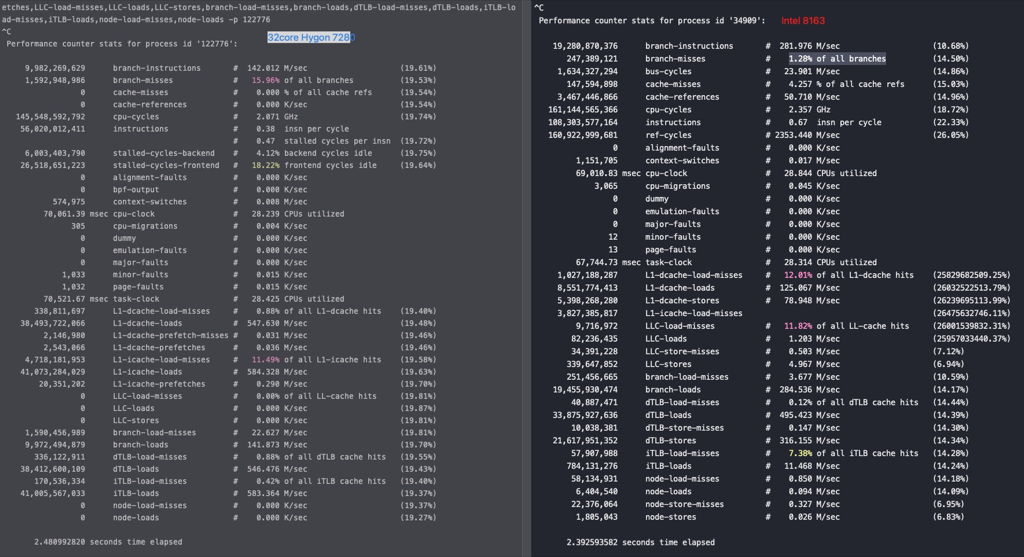
#perf stat -e branch-misses,bus-cycles,cache-misses,cache-references,cpu-cycles,instructions,stalled-cycles-backend,stalled-cycles-frontend,L1-dcache-load-misses,L1-dcache-loads,L1-dcache-store-misses,L1-dcache-stores,L1-icache-load-misses,L1-icache-loads,branch-load-misses,branch-loads,dTLB-load-misses,dTLB-loads,iTLB-load-misses,iTLB-loads,cpu-migrations -p 20799 ^C Performance counter stats for process id '20799':
2,866,418,154 branch-misses (59.84%) 549,673,215,827 bus-cycles (59.89%) 2,179,816,578 cache-misses # 2.360 % of all cache refs (59.93%) 92,377,674,343 cache-references (60.04%) 549,605,057,475 cpu-cycles (65.05%) 229,958,980,614 instructions # 0.42 insn per cycle # 1.31 stalled cycles per insn (65.05%) 146,201,062,116 stalled-cycles-backend # 26.60% backend cycles idle (65.08%) 301,814,831,043 stalled-cycles-frontend # 54.91% frontend cycles idle (65.08%) 2,177,062,319 L1-dcache-load-misses # 2.35% of all L1-dcache hits (65.04%) 92,481,797,426 L1-dcache-loads (65.11%) 2,175,030,428 L1-dcache-store-misses (65.15%) 92,507,474,710 L1-dcache-stores (65.14%) 9,299,812,249 L1-icache-load-misses # 12.47% of all L1-icache hits (65.20%) 74,579,909,037 L1-icache-loads (65.16%) 2,862,664,443 branch-load-misses (65.08%) 52,826,930,842 branch-loads (65.04%) 3,729,265,130 dTLB-load-misses # 3.11% of all dTLB cache hits (64.95%) 119,896,014,498 dTLB-loads (59.90%) 1,350,782,047 iTLB-load-misses # 1.83% of all iTLB cache hits (59.84%) 74,005,620,378 iTLB-loads (59.82%) 510 cpu-migrations
#perf stat -e branch-misses,bus-cycles,cache-misses,cache-references,cpu-cycles,instructions,stalled-cycles-backend,stalled-cycles-frontend,L1-dcache-load-misses,L1-dcache-loads,L1-dcache-store-misses,L1-dcache-stores,L1-icache-load-misses,L1-icache-loads,branch-load-misses,branch-loads,dTLB-load-misses,dTLB-loads,iTLB-load-misses,iTLB-loads,cpu-migrations -p 20799 ^C Performance counter stats for process id '20799':
2,665,583,722 branch-misses (59.90%) 500,184,789,050 bus-cycles (59.95%) 1,997,726,097 cache-misses # 2.254 % of all cache refs (59.94%) 88,628,013,529 cache-references (59.93%) 500,111,712,450 cpu-cycles (64.98%) 221,098,464,920 instructions # 0.44 insn per cycle # 1.35 stalled cycles per insn (65.02%) 105,957,124,479 stalled-cycles-backend # 21.19% backend cycles idle (65.02%) 298,186,439,955 stalled-cycles-frontend # 59.62% frontend cycles idle (65.02%) 1,996,313,908 L1-dcache-load-misses # 2.25% of all L1-dcache hits (65.04%) 88,701,699,646 L1-dcache-loads (65.09%) 1,997,851,364 L1-dcache-store-misses (65.10%) 88,614,658,960 L1-dcache-stores (65.10%) 8,635,807,737 L1-icache-load-misses # 12.30% of all L1-icache hits (65.13%) 70,233,323,630 L1-icache-loads (65.16%) 2,665,567,783 branch-load-misses (65.10%) 50,482,936,168 branch-loads (65.09%) 3,614,564,473 dTLB-load-misses # 3.15% of all dTLB cache hits (65.04%) 114,619,822,486 dTLB-loads (59.96%) 1,270,926,362 iTLB-load-misses # 1.81% of all iTLB cache hits (59.97%) 70,248,645,721 iTLB-loads (59.94%) 128 cpu-migrations
#perf stat -e branch-misses,bus-cycles,cache-misses,cache-references,cpu-cycles,instructions,stalled-cycles-backend,stalled-cycles-frontend,L1-dcache-load-misses,L1-dcache-loads,L1-dcache-store-misses,L1-dcache-stores,L1-icache-load-misses,L1-icache-loads,branch-load-misses,branch-loads,dTLB-load-misses,dTLB-loads,iTLB-load-misses,iTLB-loads,cpu-migrations -p 49512 ^C Performance counter stats for process id '49512':
1,849,313,199 branch-misses (59.99%) 319,122,053,367 bus-cycles (60.02%) 1,319,212,546 cache-misses # 2.238 % of all cache refs (59.95%) 58,950,581,370 cache-references (60.02%) 319,088,767,311 cpu-cycles (65.01%) 146,580,891,374 instructions # 0.46 insn per cycle # 1.32 stalled cycles per insn (65.01%) 61,109,919,226 stalled-cycles-backend # 19.15% backend cycles idle (65.04%) 193,963,590,196 stalled-cycles-frontend # 60.79% frontend cycles idle (65.06%) 1,319,593,051 L1-dcache-load-misses # 2.24% of all L1-dcache hits (65.03%) 58,967,303,454 L1-dcache-loads (65.04%) 1,318,842,690 L1-dcache-store-misses (65.13%) 58,988,059,583 L1-dcache-stores (65.07%) 5,769,871,870 L1-icache-load-misses # 12.25% of all L1-icache hits (65.12%) 47,085,299,316 L1-icache-loads (65.10%) 1,850,419,802 branch-load-misses (65.03%) 33,687,548,636 branch-loads (65.08%) 2,375,028,039 dTLB-load-misses # 3.12% of all dTLB cache hits (65.08%) 76,113,084,244 dTLB-loads (60.01%) 825,388,210 iTLB-load-misses # 1.75% of all iTLB cache hits (59.99%) 47,092,738,092 iTLB-loads (59.95%) 49 cpu-migrations
#dmidecode -t processor # dmidecode 3.0 Getting SMBIOS data from sysfs. SMBIOS 3.2.0 present. # SMBIOS implementations newer than version 3.0 are not # fully supported by this version of dmidecode.
Handle 0x0004, DMI type 4, 48 bytes Processor Information Socket Designation: BGA3576 Type: Central Processor Family: <OUT OF SPEC> Manufacturer: PHYTIUM ID: 00 00 00 00 70 1F 66 22 Version: FT2500 Voltage: 0.8 V External Clock: 50 MHz Max Speed: 2100 MHz Current Speed: 2100 MHz Status: Populated, Enabled Upgrade: Other L1 Cache Handle: 0x0005 L2 Cache Handle: 0x0007 L3 Cache Handle: 0x0008 Serial Number: 1234567 Asset Tag: No Asset Tag Part Number: NULL Core Count: 64 Core Enabled: 64 Thread Count: 64 Characteristics: 64-bit capable Multi-Core Hardware Thread Execute Protection Enhanced Virtualization Power/Performance Control
#dmidecode -t processor # dmidecode 3.0 Getting SMBIOS data from sysfs. SMBIOS 3.2.0 present. # SMBIOS implementations newer than version 3.0 are not # fully supported by this version of dmidecode.
Handle 0x0022, DMI type 4, 48 bytes Processor Information Socket Designation: CPU 0 Type: Central Processor Family: Other Manufacturer: SW3231 ID: 28 00 C8 80 01 00 00 00 Version: Product Voltage: 3.3 V External Clock: 200 MHz Max Speed: 2400 MHz Current Speed: 2400 MHz Status: Unpopulated Upgrade: Other L1 Cache Handle: 0x2000 L2 Cache Handle: 0x2002 L3 Cache Handle: 0x2003 Serial Number: ....... Asset Tag: Asset Tag#To Be Filled By O.E.M. Part Number: Part Number#To Be Filled By O.E.M. Core Count: 32 Core Enabled: 32 Thread Count: 0 Characteristics: 64-bit capable
Handle 0x0023, DMI type 4, 48 bytes Processor Information Socket Designation: CPU 1 Type: Central Processor Family: Other Manufacturer: SW3231 ID: 28 00 C8 80 01 00 00 00 Version: Product Voltage: 3.3 V External Clock: 200 MHz Max Speed: 2400 MHz Current Speed: 2400 MHz Status: Unpopulated Upgrade: Other L1 Cache Handle: 0x2000 L2 Cache Handle: 0x2002 L3 Cache Handle: 0x2003 Serial Number: ....... Asset Tag: Asset Tag#To Be Filled By O.E.M. Part Number: Part Number#To Be Filled By O.E.M. Core Count: 32 Core Enabled: 32 Thread Count: 0 Characteristics: 64-bit capable
for i in {0..95}; do time echo “scale=5000; 4*a(1)” | bc -l -q >/dev/null & done
perf stat -e branch-misses,bus-cycles,cache-misses,cache-references,cpu-cycles,instructions,stalled-cycles-backend,stalled-cycles-frontend,L1-dcache-load-misses,L1-dcache-loads,L1-dcache-store-misses,L1-dcache-stores,L1-icache-load-misses,L1-icache-loads,branch-load-misses,branch-loads,dTLB-load-misses,dTLB-loads,iTLB-load-misses,iTLB-loads –
710
耗时15.83秒,ipc 2.64
1 2 3 4 5 6 7 8 9 10 11 12 13 14 15 16 17
perf stat -e branch-misses,bus-cycles,cache-misses,cache-references,cpu-cycles,instructions,stalled-cycles-backend,stalled-cycles-frontend,alignment-faults,bpf-output,context-switches,cpu-clock,cpu-migrations,dummy,emulation-faults,major-faults,minor-faults,page-faults,task-clock,L1-dcache-load-misses,L1-dcache-loads,L1-icache-load-misses,L1-icache-loads,LLC-load-misses,LLC-loads,branch-load-misses,branch-loads,dTLB-load-misses,dTLB-loads,iTLB-load-misses,iTLB-loads -- bash -c 'echo "7^999999" | bc > /dev/null'
Performance counter stats for 'bash -c echo "7^999999" | bc > /dev/null':
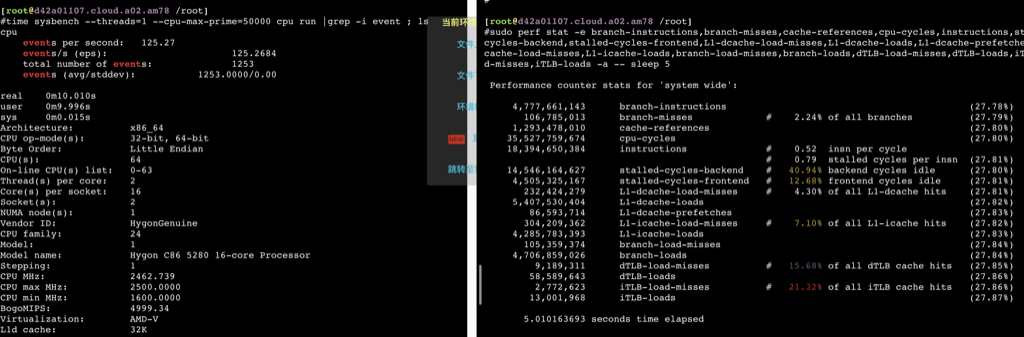
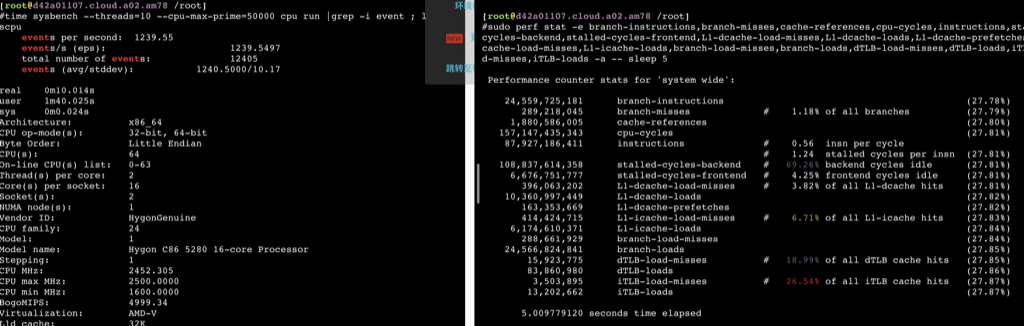
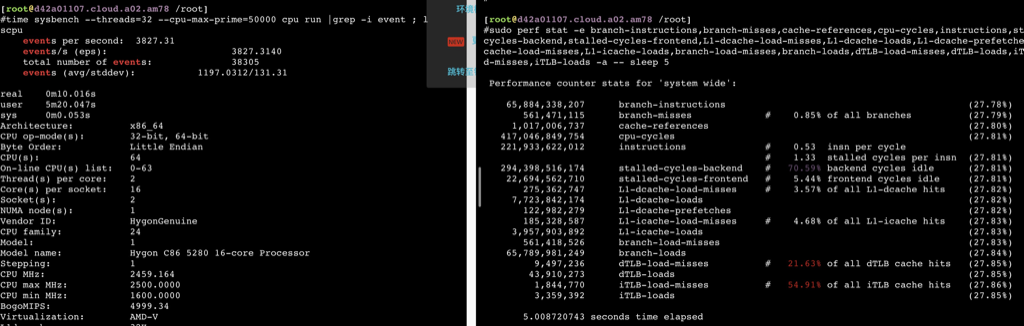
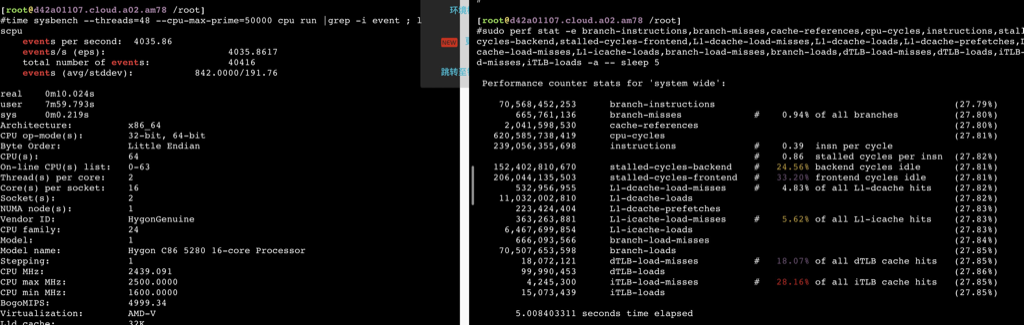
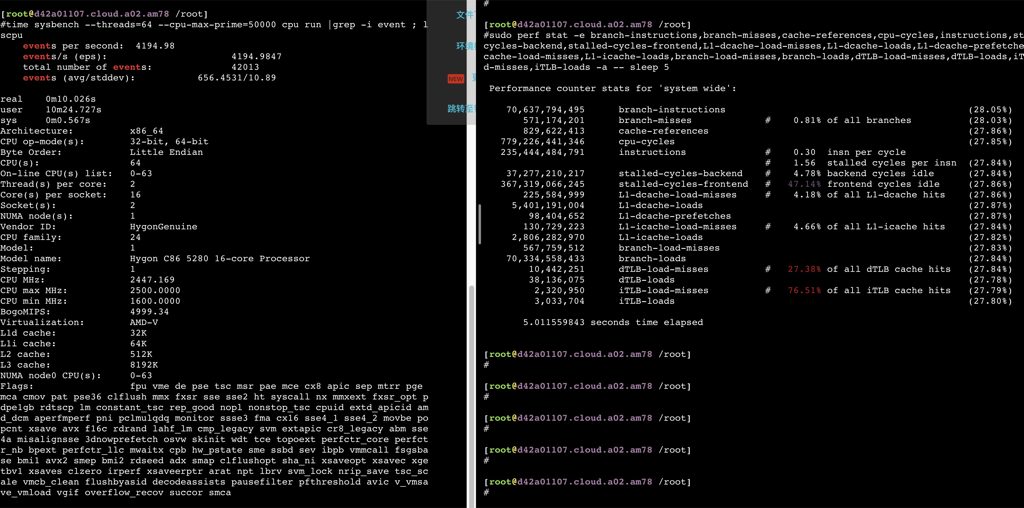
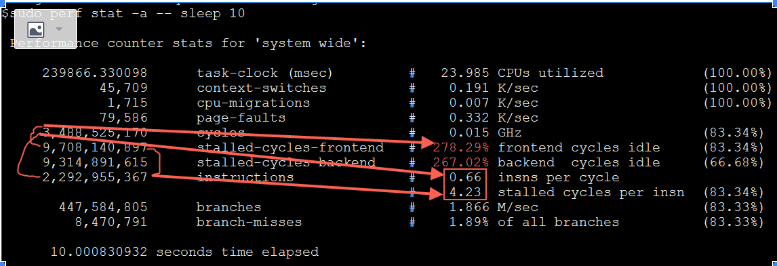
sudo perf stat -e branch-instructions,branch-misses,cache-references,cpu-cycles,instructions,stalled-cycles-backend,stalled-cycles-frontend,L1-dcache-load-misses,L1-dcache-loads,L1-dcache-prefetches,L1-icache-load-misses,L1-icache-loads,branch-load-misses,branch-loads,dTLB-load-misses,dTLB-loads,iTLB-load-misses,iTLB-loads -a -- bash -c 'echo "7^999999" | bc > /dev/null'
Performance counter stats for 'system wide':
57,795,675,025 branch-instructions (27.78%) 2,459,509,459 branch-misses # 4.26% of all branches (27.78%) 12,171,133,272 cache-references (27.79%) 317,353,262,523 cpu-cycles (27.79%) 293,162,940,548 instructions # 0.92 insn per cycle # 0.19 stalled cycles per insn (27.79%) 55,152,807,029 stalled-cycles-backend # 17.38% backend cycles idle (27.79%) 44,410,732,991 stalled-cycles-frontend # 13.99% frontend cycles idle (27.79%) 4,065,273,083 L1-dcache-load-misses # 3.58% of all L1-dcache hits (27.79%) 113,699,208,151 L1-dcache-loads (27.79%) 1,351,513,191 L1-dcache-prefetches (27.79%) 2,091,035,340 L1-icache-load-misses # 4.43% of all L1-icache hits (27.79%) 47,240,289,316 L1-icache-loads (27.79%) 2,459,838,728 branch-load-misses (27.79%) 57,855,156,991 branch-loads (27.78%) 69,731,473 dTLB-load-misses # 20.40% of all dTLB cache hits (27.78%) 341,773,319 dTLB-loads (27.78%) 26,351,132 iTLB-load-misses # 15.91% of all iTLB cache hits (27.78%) 165,656,863 iTLB-loads (27.78%)
time perf stat -e branch-misses,bus-cycles,cache-misses,cache-references,cpu-cycles,instructions,L1-dcache-load-misses,L1-dcache-loads,L1-dcache-store-misses,L1-dcache-stores,L1-icache-load-misses,L1-icache-loads,branch-load-misses,branch-loads,dTLB-load-misses,iTLB-load-misses -a -- bash -c 'echo "7^999999" | bc > /dev/null'
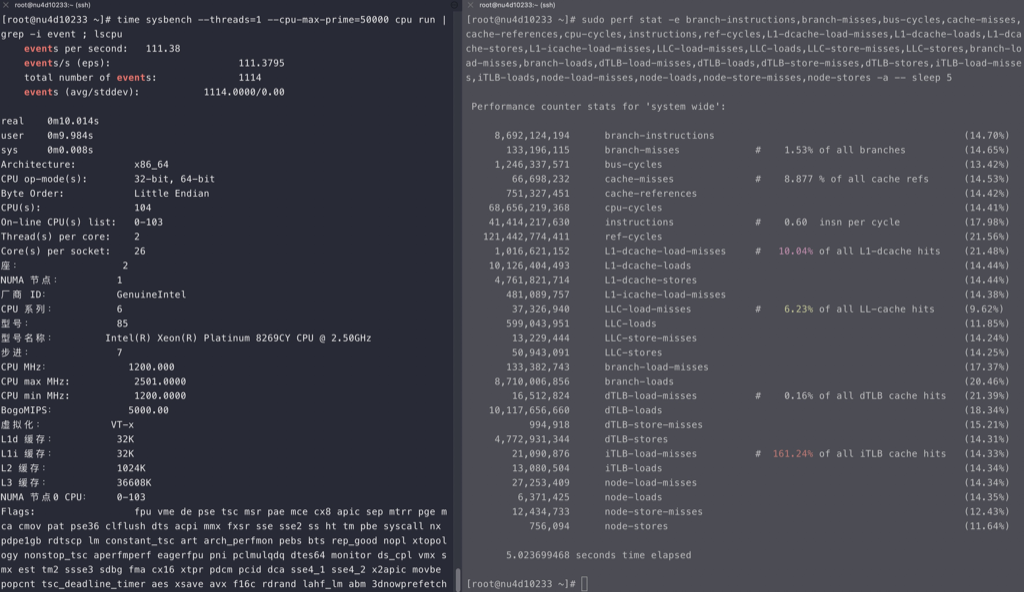
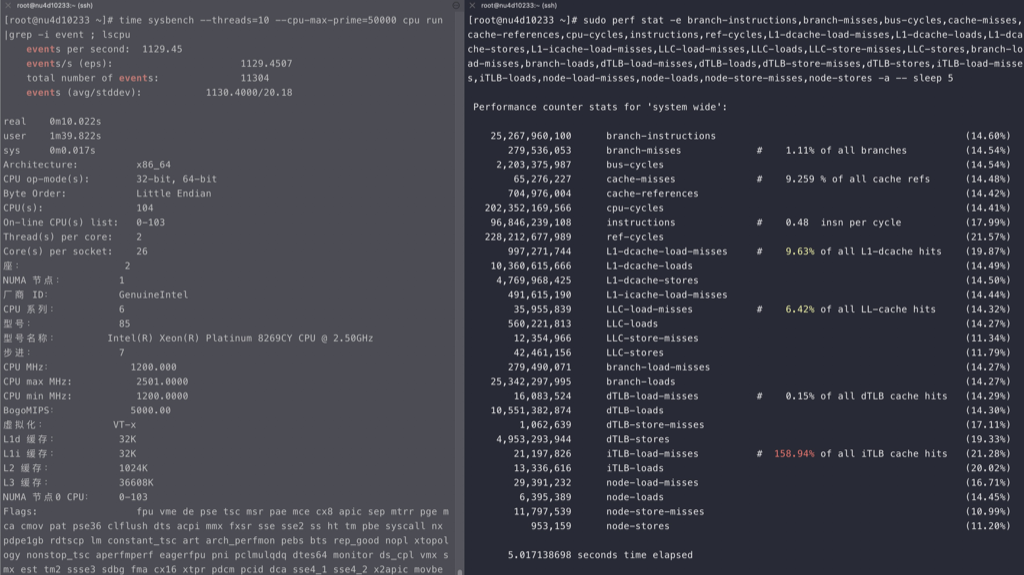
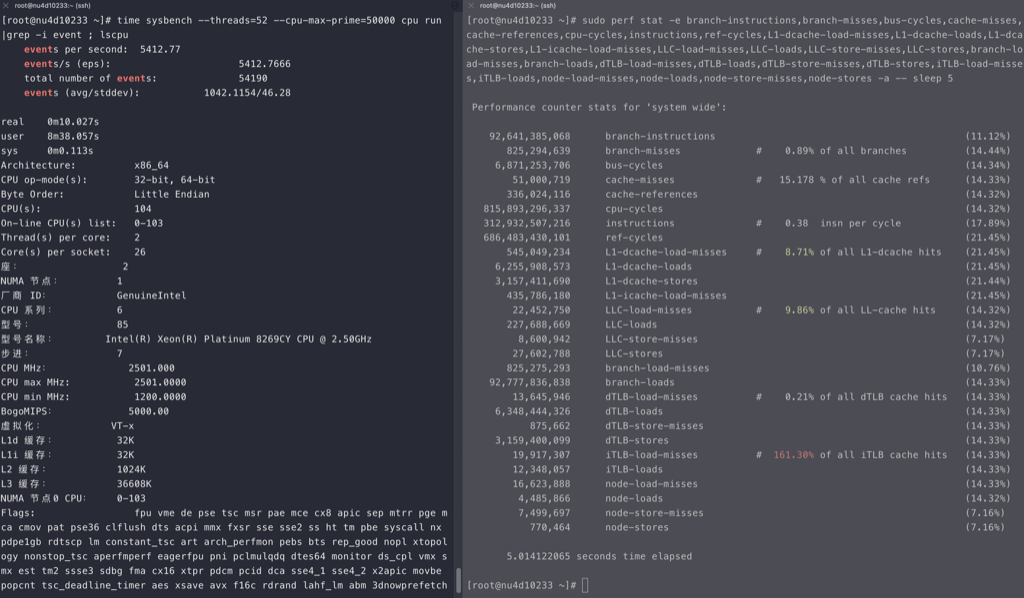
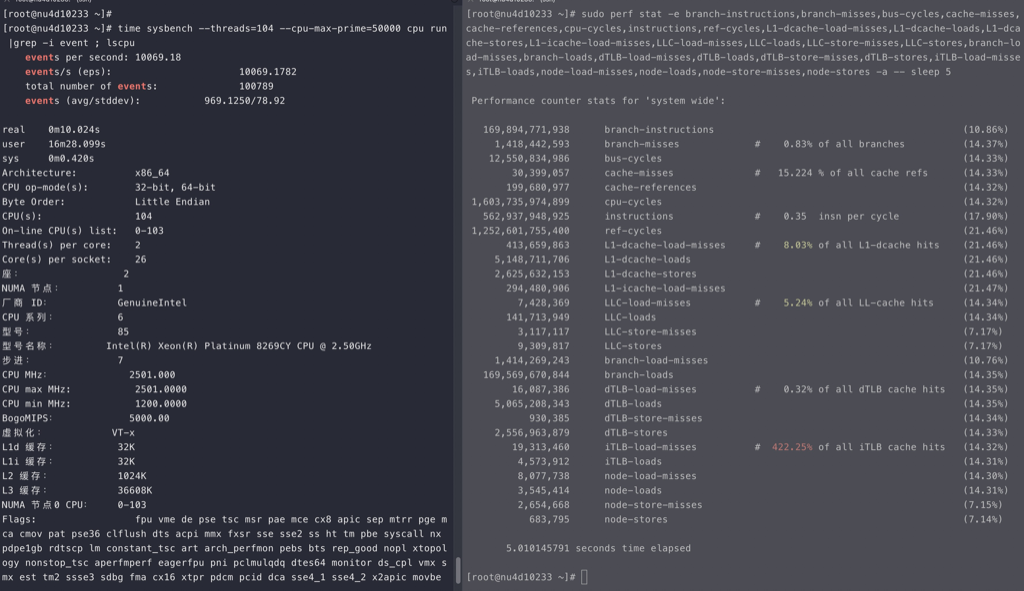
# sudo perf stat -e branch-instructions,branch-misses,bus-cycles,cache-misses,cache-references,cpu-cycles,instructions,ref-cycles,L1-dcache-load-misses,L1-dcache-loads,L1-dcache-stores,L1-icache-load-misses,LLC-load-misses,LLC-loads,LLC-store-misses,LLC-stores,branch-load-misses,branch-loads,dTLB-load-misses,dTLB-loads,dTLB-store-misses,dTLB-stores,iTLB-load-misses,iTLB-loads,node-load-misses,node-loads,node-store-misses,node-stores -a ./memory_bound
Performance counter stats for 'system wide':
36,162,872,212 branch-instructions (14.21%) 586,644,153 branch-misses # 1.62% of all branches (12.95%) 4,632,787,085 bus-cycles (14.40%) 476,189,785 cache-misses # 17.714 % of all cache refs (14.38%) 2,688,284,129 cache-references (14.35%) 258,946,713,506 cpu-cycles (17.93%) 181,069,328,200 instructions # 0.70 insn per cycle (21.51%) 456,889,428,341 ref-cycles (22.31%) 3,928,434,098 L1-dcache-load-misses # 7.46% of all L1-dcache hits (14.21%) 52,656,559,902 L1-dcache-loads (14.31%) 26,711,751,387 L1-dcache-stores (14.30%) 2,618,739,340 L1-icache-load-misses (18.05%) 154,326,888 LLC-load-misses # 8.60% of all LL-cache hits (19.84%) 1,795,112,198 LLC-loads (9.81%) 66,802,375 LLC-store-misses (10.19%) 206,810,811 LLC-stores (11.16%) 586,120,789 branch-load-misses (14.28%) 36,121,237,395 branch-loads (14.29%) 114,927,298 dTLB-load-misses # 0.22% of all dTLB cache hits (14.29%) 52,902,163,128 dTLB-loads (14.29%) 7,010,297 dTLB-store-misses (14.29%) 26,587,353,417 dTLB-stores (18.00%) 106,209,281 iTLB-load-misses # 174.17% of all iTLB cache hits (19.33%) 60,978,626 iTLB-loads (21.53%) 117,197,042 node-load-misses (19.71%) 35,764,508 node-loads (11.65%) 57,655,994 node-store-misses (7.80%) 11,563,328 node-stores (9.45%)
16.700731355 seconds time elapsed # sudo perf stat -e branch-instructions,branch-misses,bus-cycles,cache-misses,cache-references,cpu-cycles,instructions,ref-cycles,L1-dcache-load-misses,L1-dcache-loads,L1-dcache-stores,L1-icache-load-misses,LLC-load-misses,LLC-loads,LLC-store-misses,LLC-stores,branch-load-misses,branch-loads,dTLB-load-misses,dTLB-loads,dTLB-store-misses,dTLB-stores,iTLB-load-misses,iTLB-loads,node-load-misses,node-loads,node-store-misses,node-stores -a ./cpu_bound
Performance counter stats for 'system wide':
43,013,055,562 branch-instructions (14.33%) 436,722,063 branch-misses # 1.02% of all branches (11.58%) 3,154,327,457 bus-cycles (14.31%) 306,977,772 cache-misses # 17.837 % of all cache refs (14.42%) 1,721,062,233 cache-references (14.39%) 176,119,834,487 cpu-cycles (17.98%) 276,038,539,571 instructions # 1.57 insn per cycle (21.55%) 309,334,354,268 ref-cycles (22.31%) 2,551,915,790 L1-dcache-load-misses # 6.78% of all L1-dcache hits (13.12%) 37,638,319,334 L1-dcache-loads (14.32%) 19,132,537,445 L1-dcache-stores (15.73%) 1,834,976,400 L1-icache-load-misses (18.90%) 131,307,343 LLC-load-misses # 11.46% of all LL-cache hits (19.94%) 1,145,964,874 LLC-loads (16.60%) 45,561,247 LLC-store-misses (8.11%) 140,236,535 LLC-stores (9.60%) 423,294,349 branch-load-misses (14.27%) 46,645,623,485 branch-loads (14.28%) 73,377,533 dTLB-load-misses # 0.19% of all dTLB cache hits (14.28%) 37,905,428,246 dTLB-loads (15.69%) 4,969,973 dTLB-store-misses (17.21%) 18,729,947,580 dTLB-stores (19.71%) 72,073,313 iTLB-load-misses # 167.86% of all iTLB cache hits (20.60%) 42,935,532 iTLB-loads (19.16%) 112,306,453 node-load-misses (15.35%) 37,239,267 node-loads (7.44%) 37,455,335 node-store-misses (10.00%) 8,134,155 node-stores (8.87%)
#time perf stat -e branch-misses,bus-cycles,cache-misses,cache-references,cpu-cycles,instructions,L1-dcache-load-misses,L1-dcache-loads,L1-dcache-store-misses,L1-dcache-stores,L1-icache-load-misses,L1-icache-loads,branch-load-misses,branch-loads,dTLB-load-misses,iTLB-load-misses -a ./cpu_bound
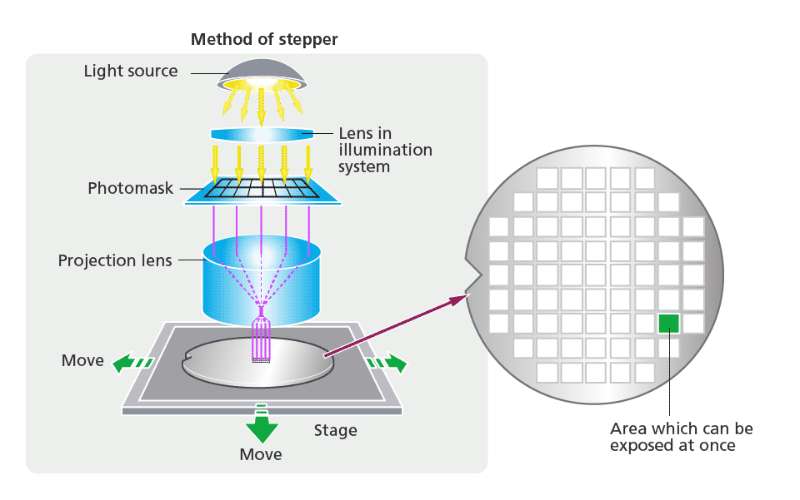
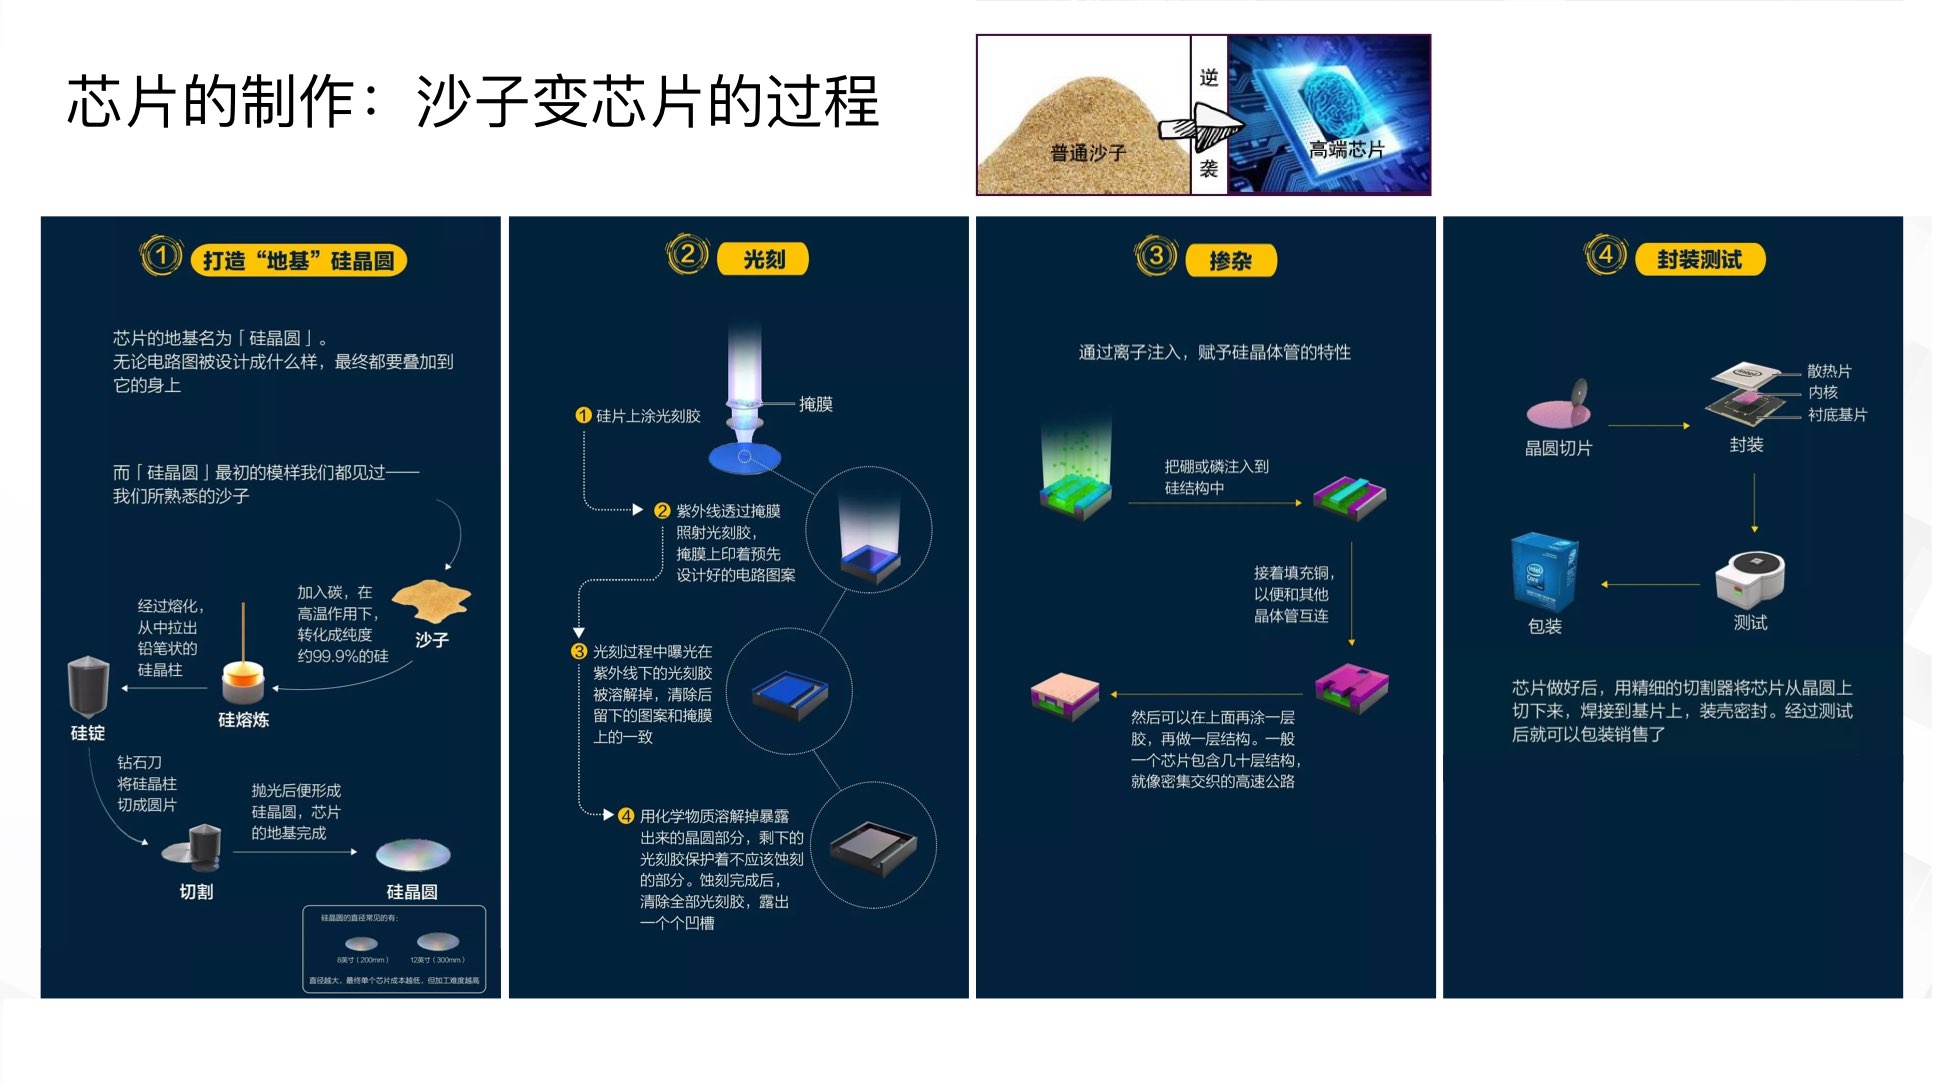
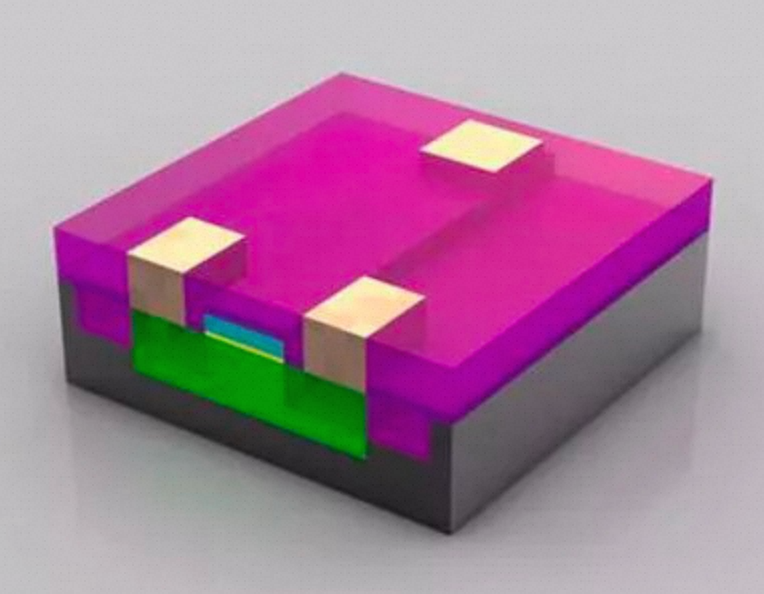
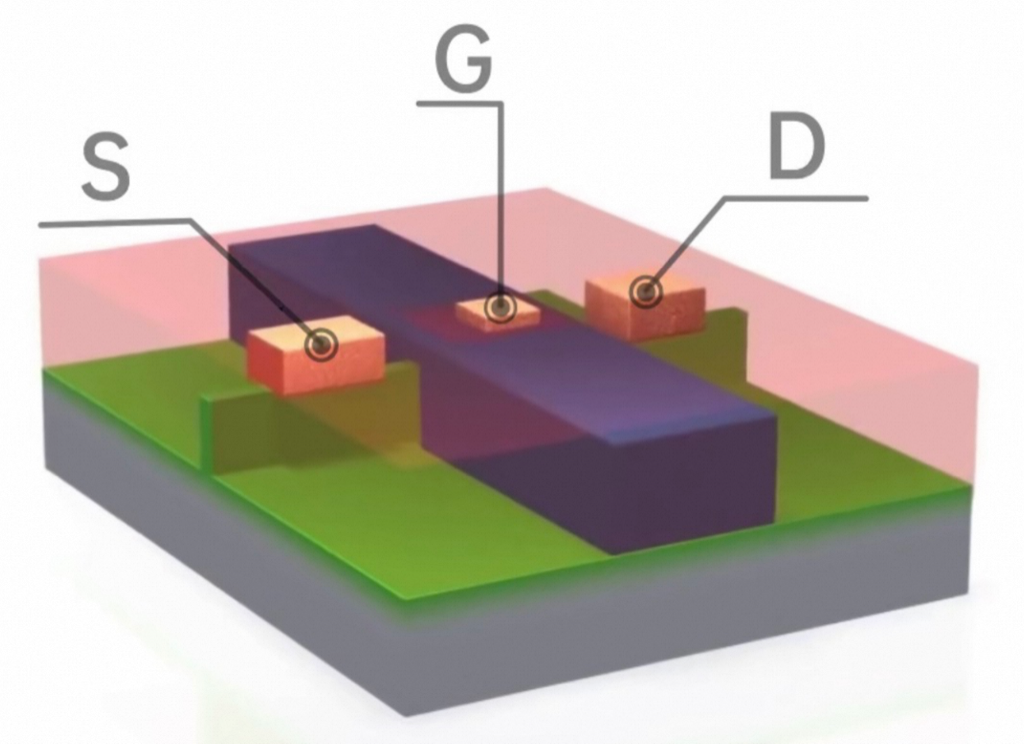
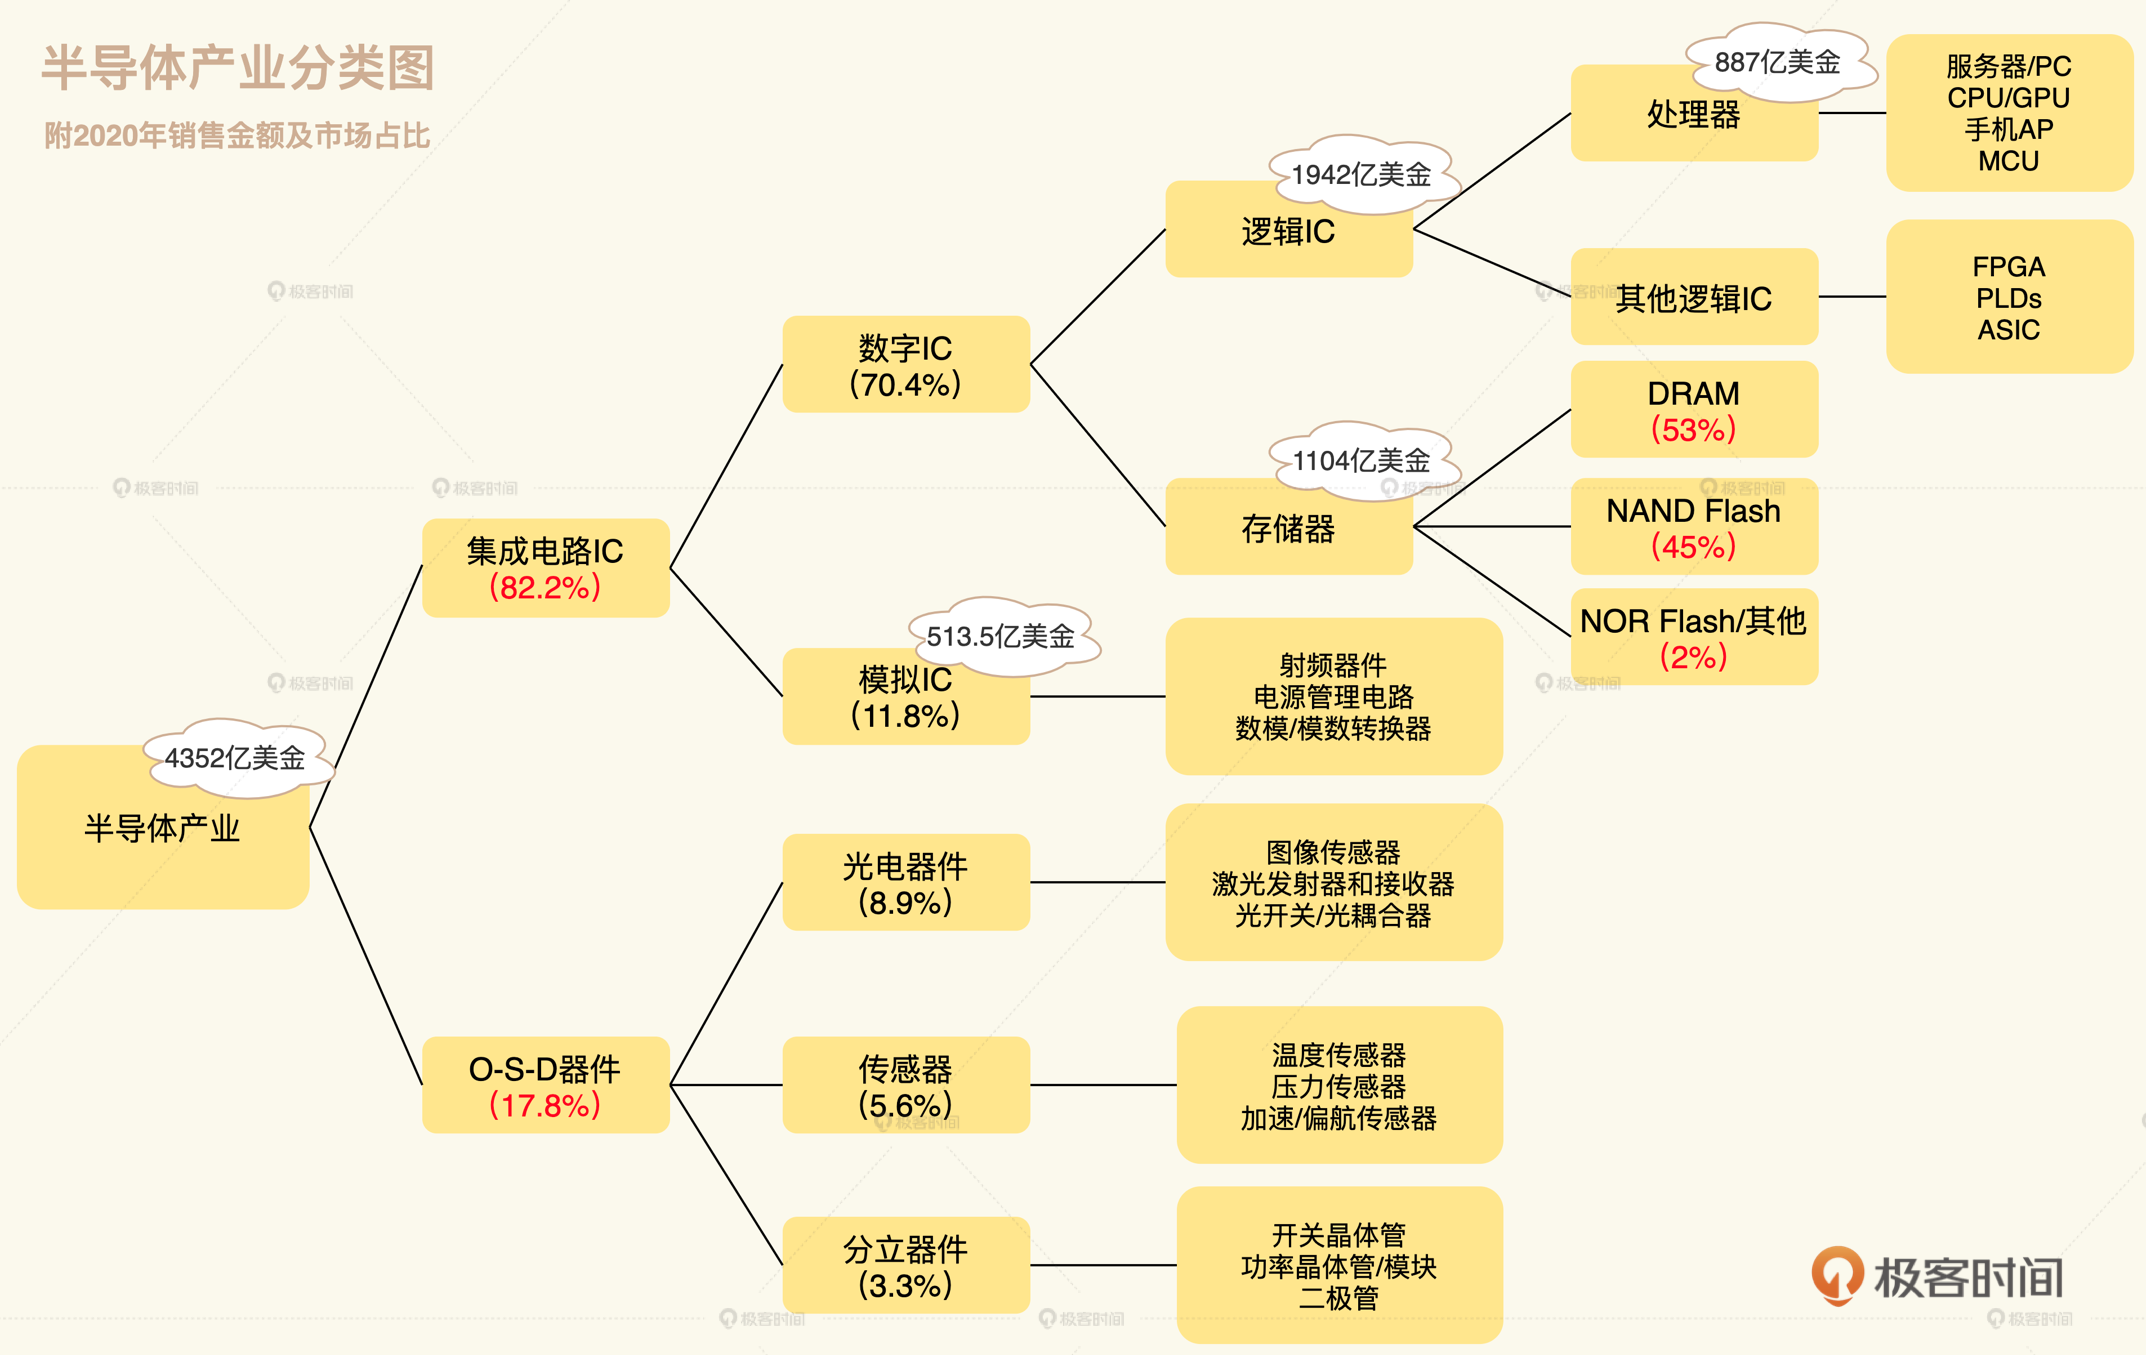
MOS :金属-氧化物-半导体,而拥有这种结构的晶体管我们称之为MOS晶体管。 MOS晶体管有P型MOS管和N型MOS管之分。 由MOS管构成的集成电路称为MOS集成电路,由NMOS组成的电路就是NMOS集成电路,由PMOS管组成的电路就是PMOS集成电路,由NMOS和PMOS两种管子组成的互补MOS电路,即CMOS电路
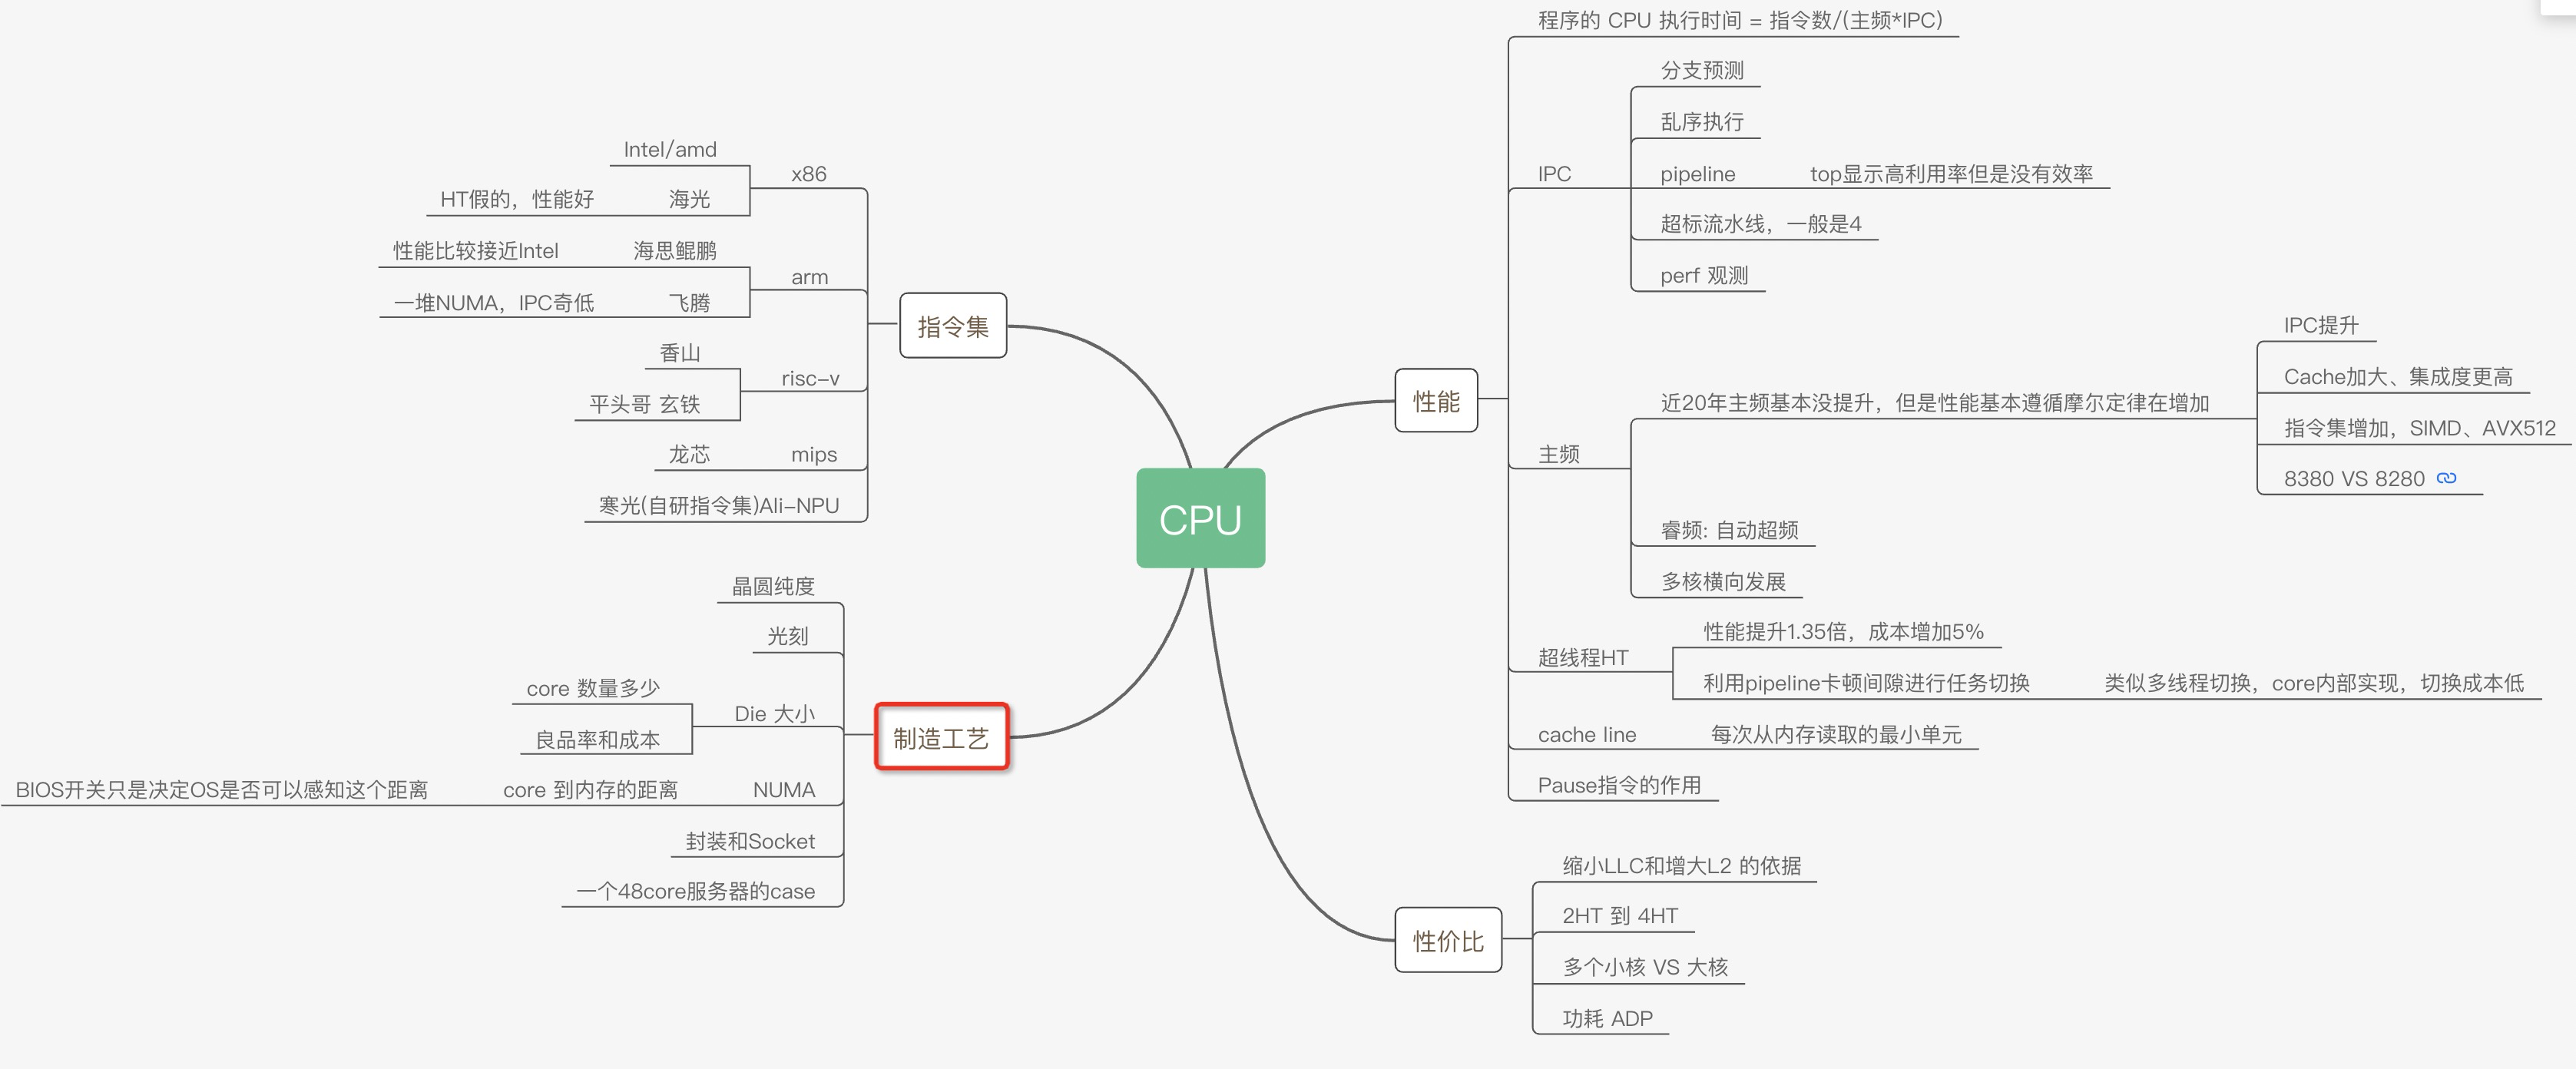
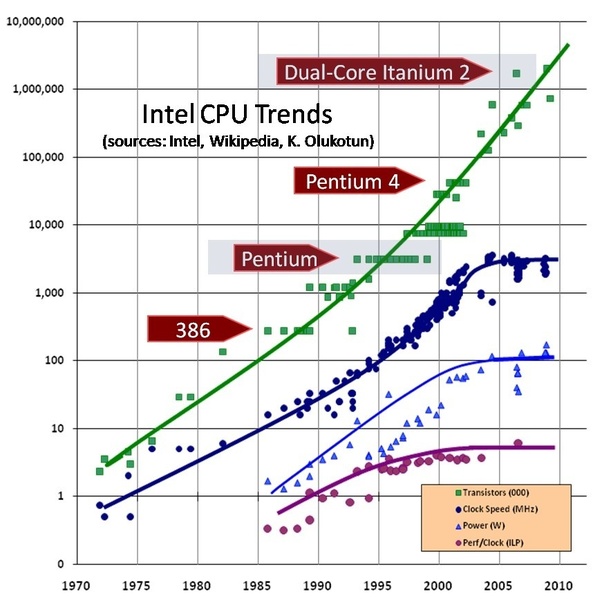
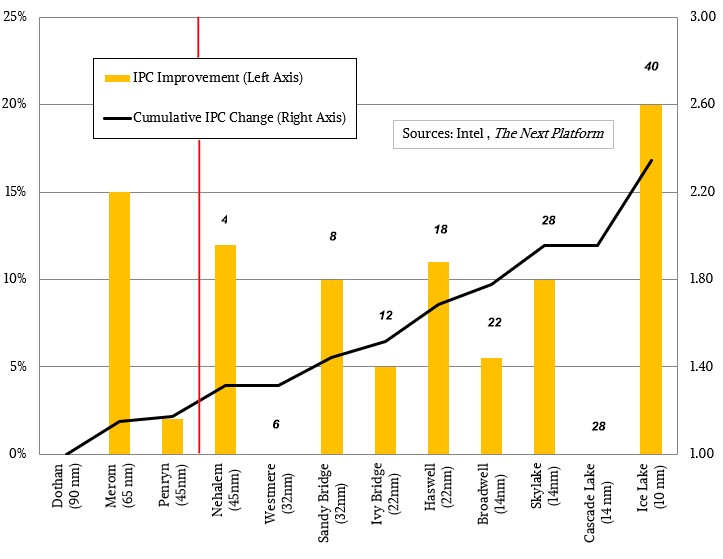
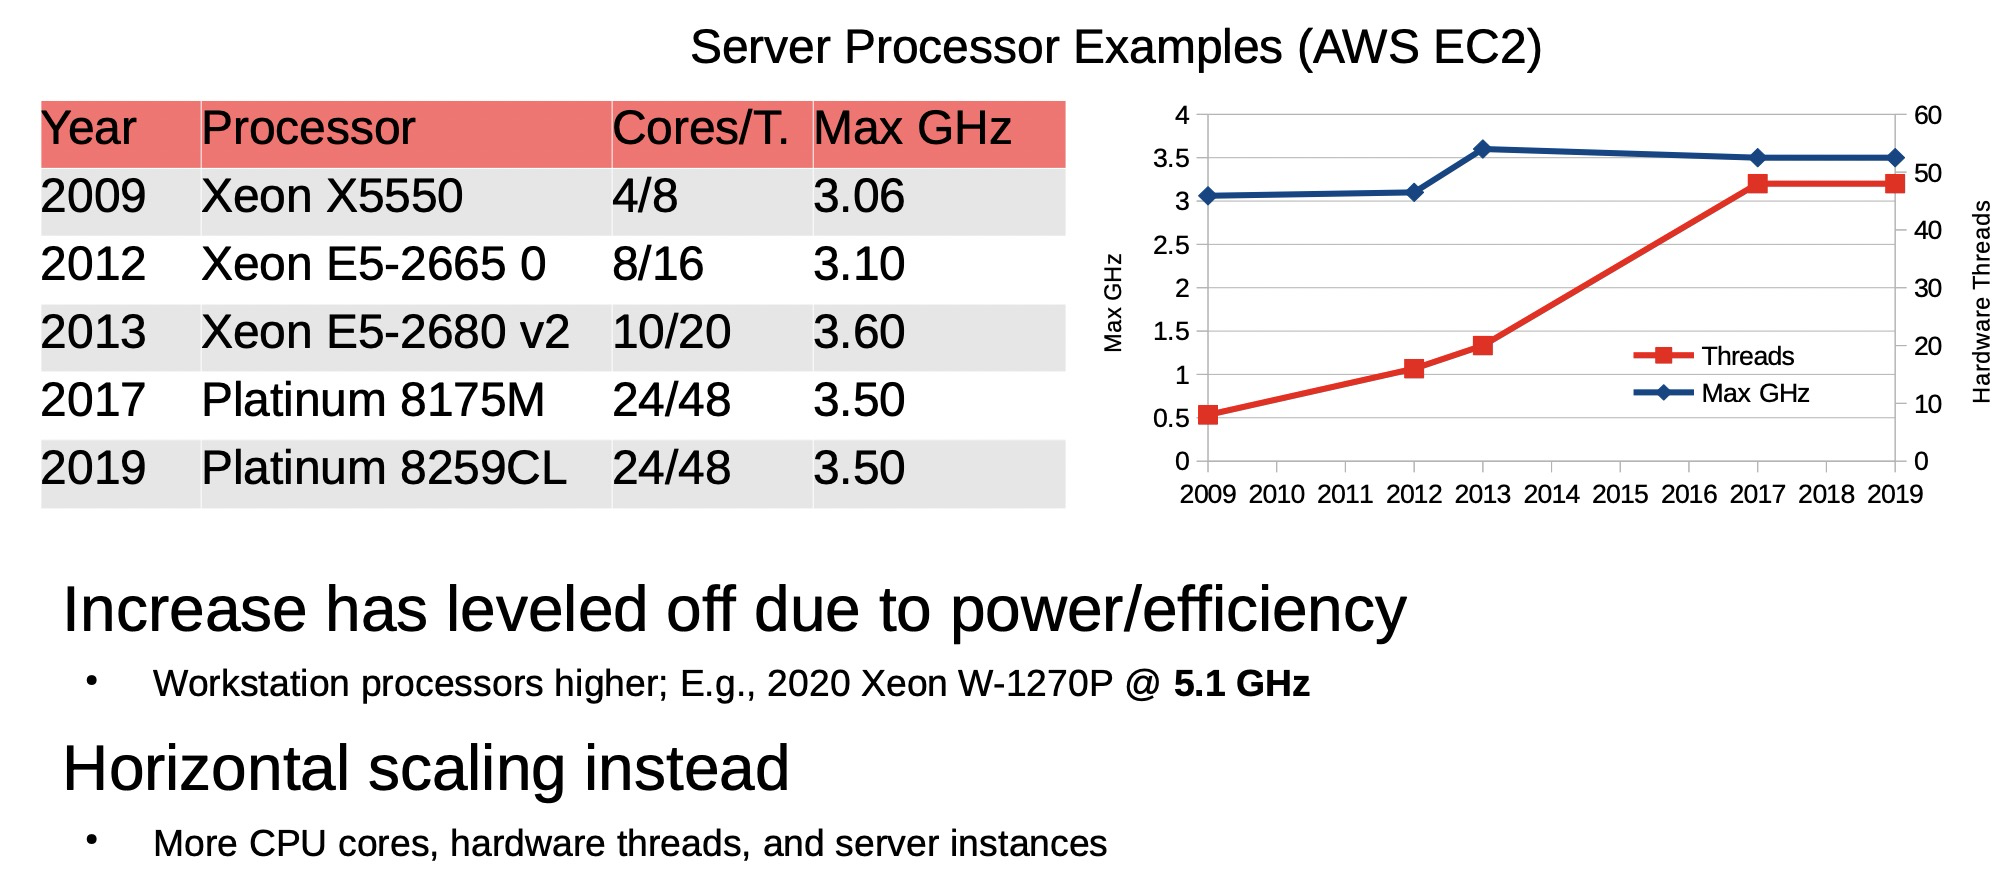
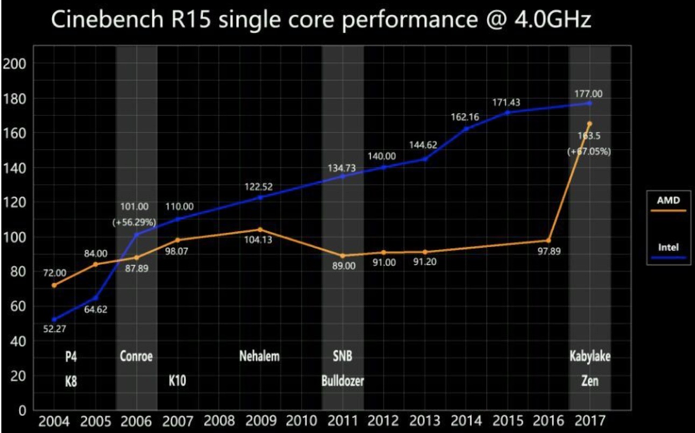
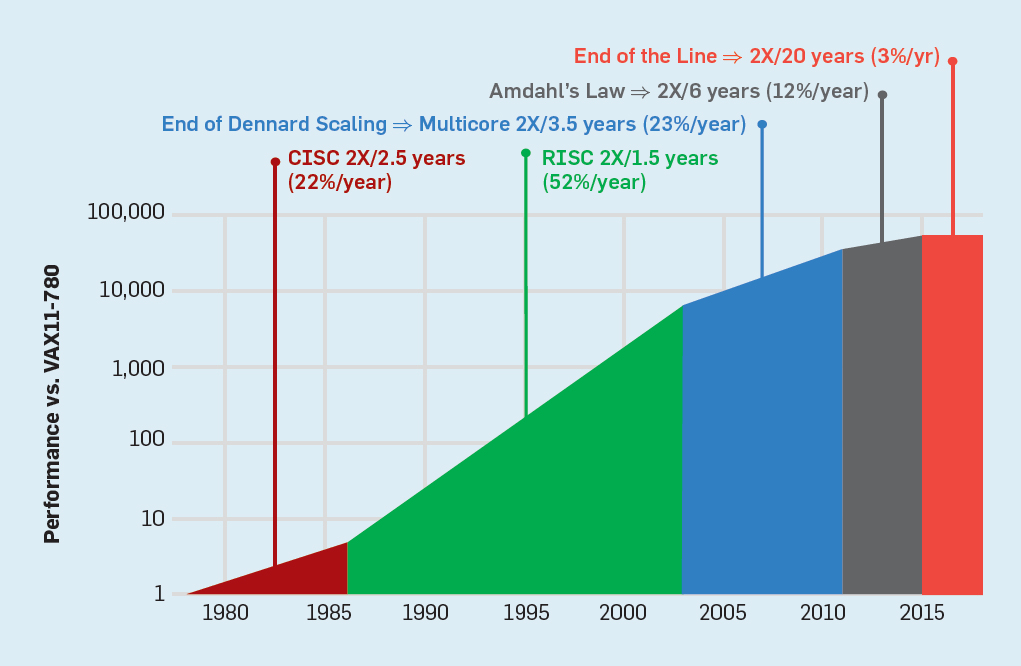
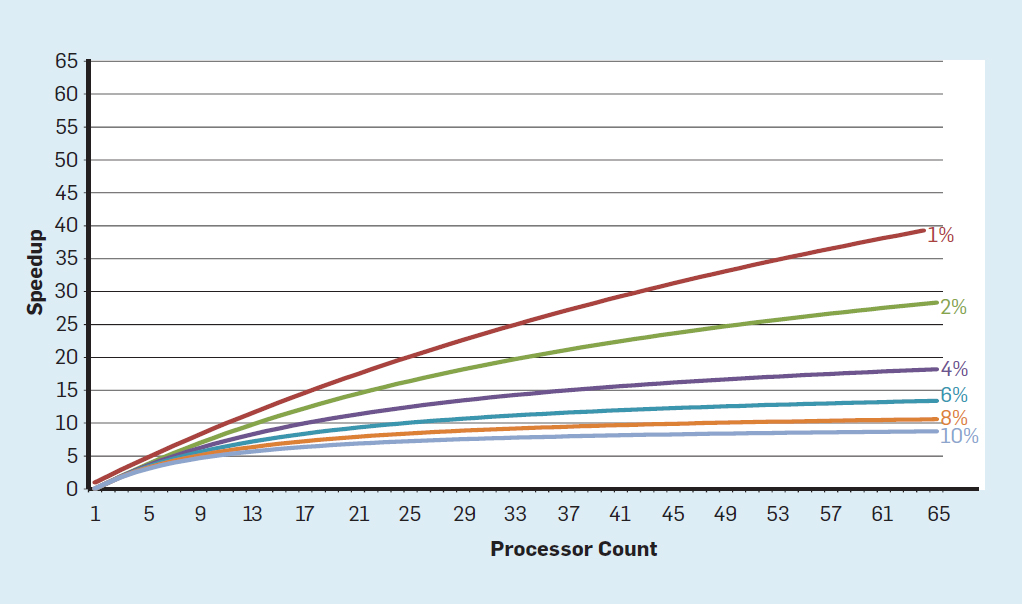
the industry came up with many different solution to create better computers w/o (or almost without) increasing the clock speed.
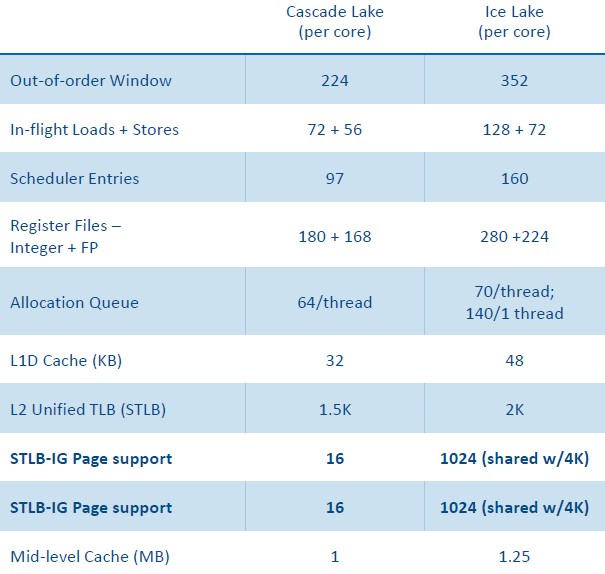
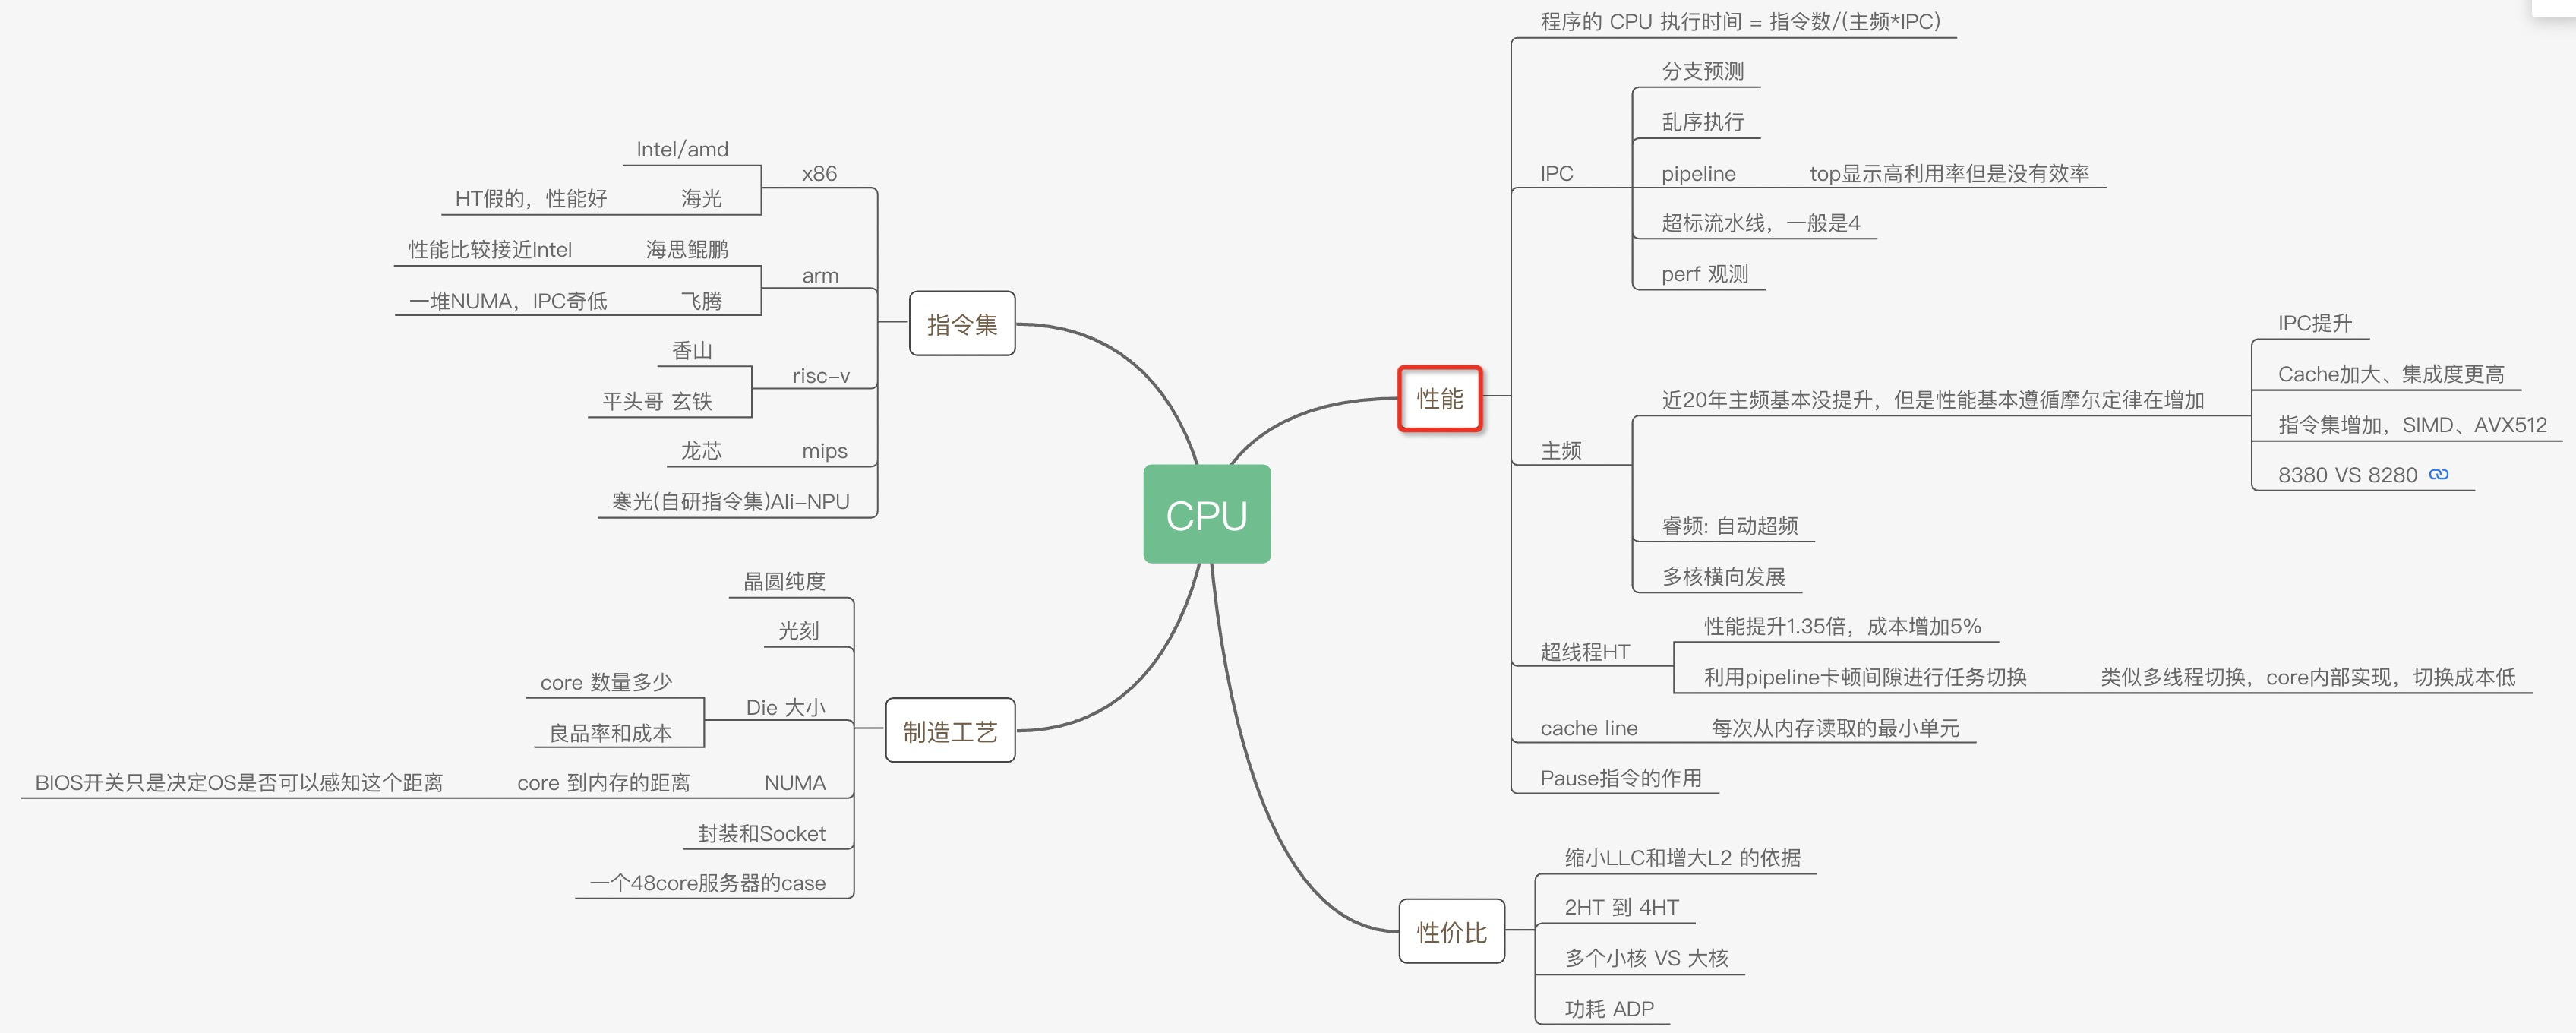
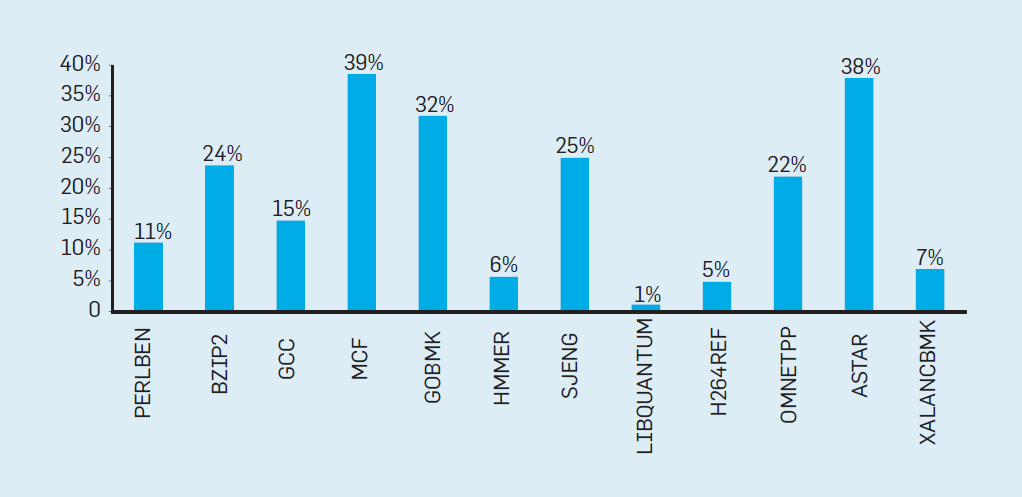
比较两代CPU性能变化
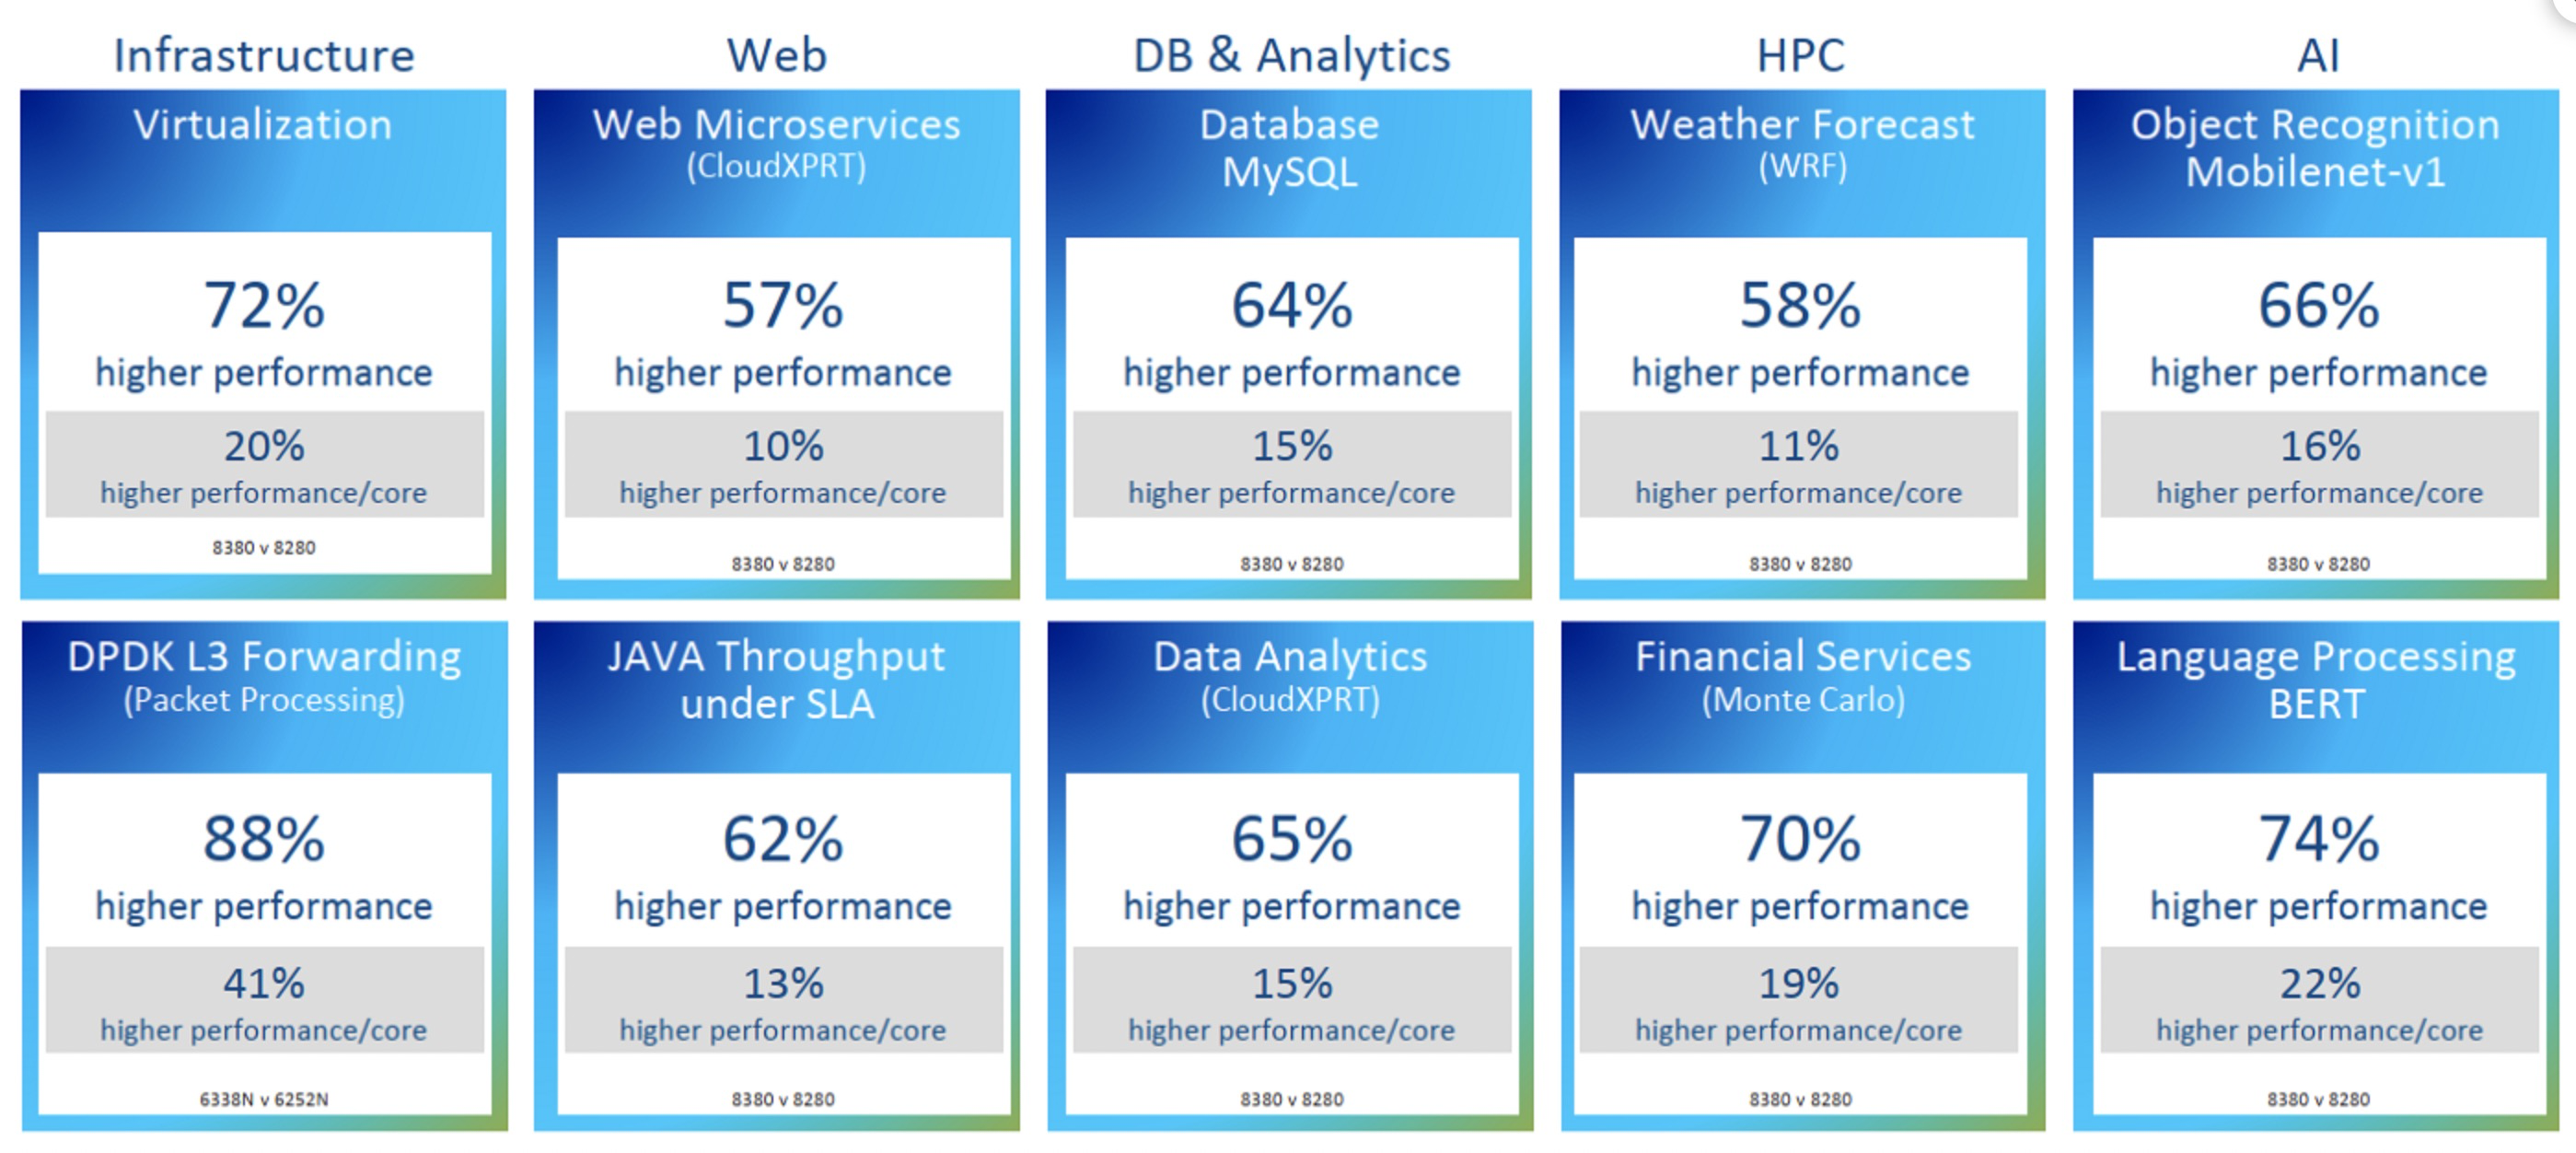
Intel 最新的CPU Ice Lake(8380)和其上一代(8280)的性能对比数据:
上图最终结果导致了IPC提升了20%
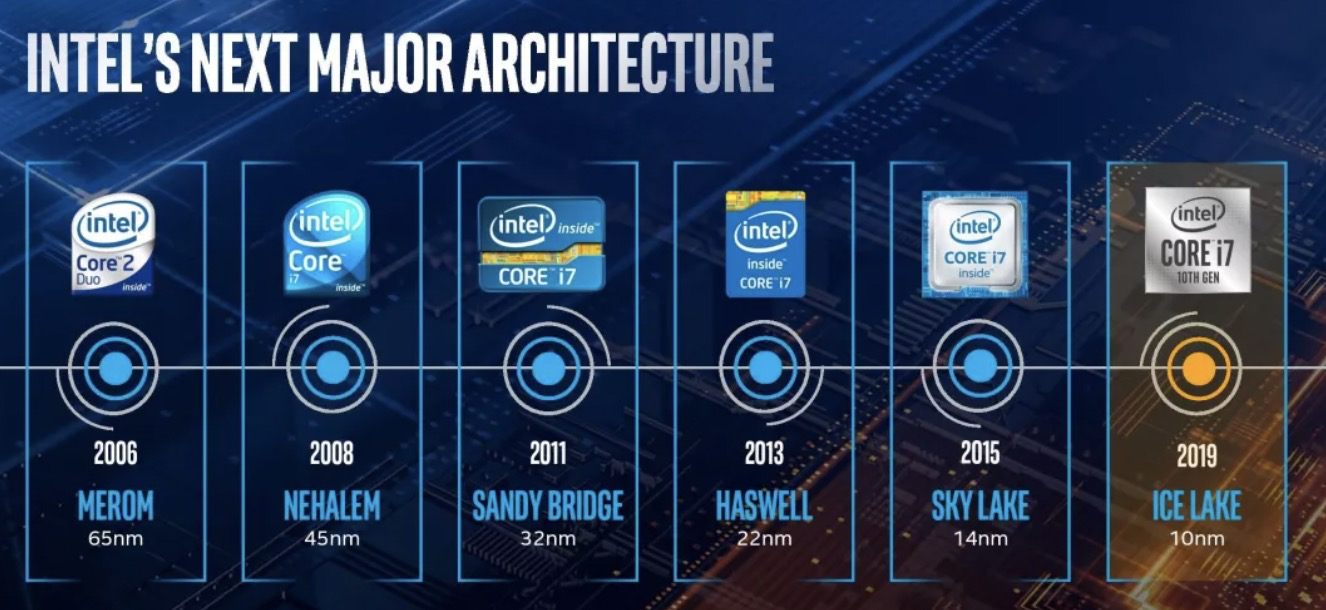
But tock Intel did with the Ice Lake processors and their Sunny Cove cores, and the tock, at 20 percent instructions per clock (IPC) improvement on integer work
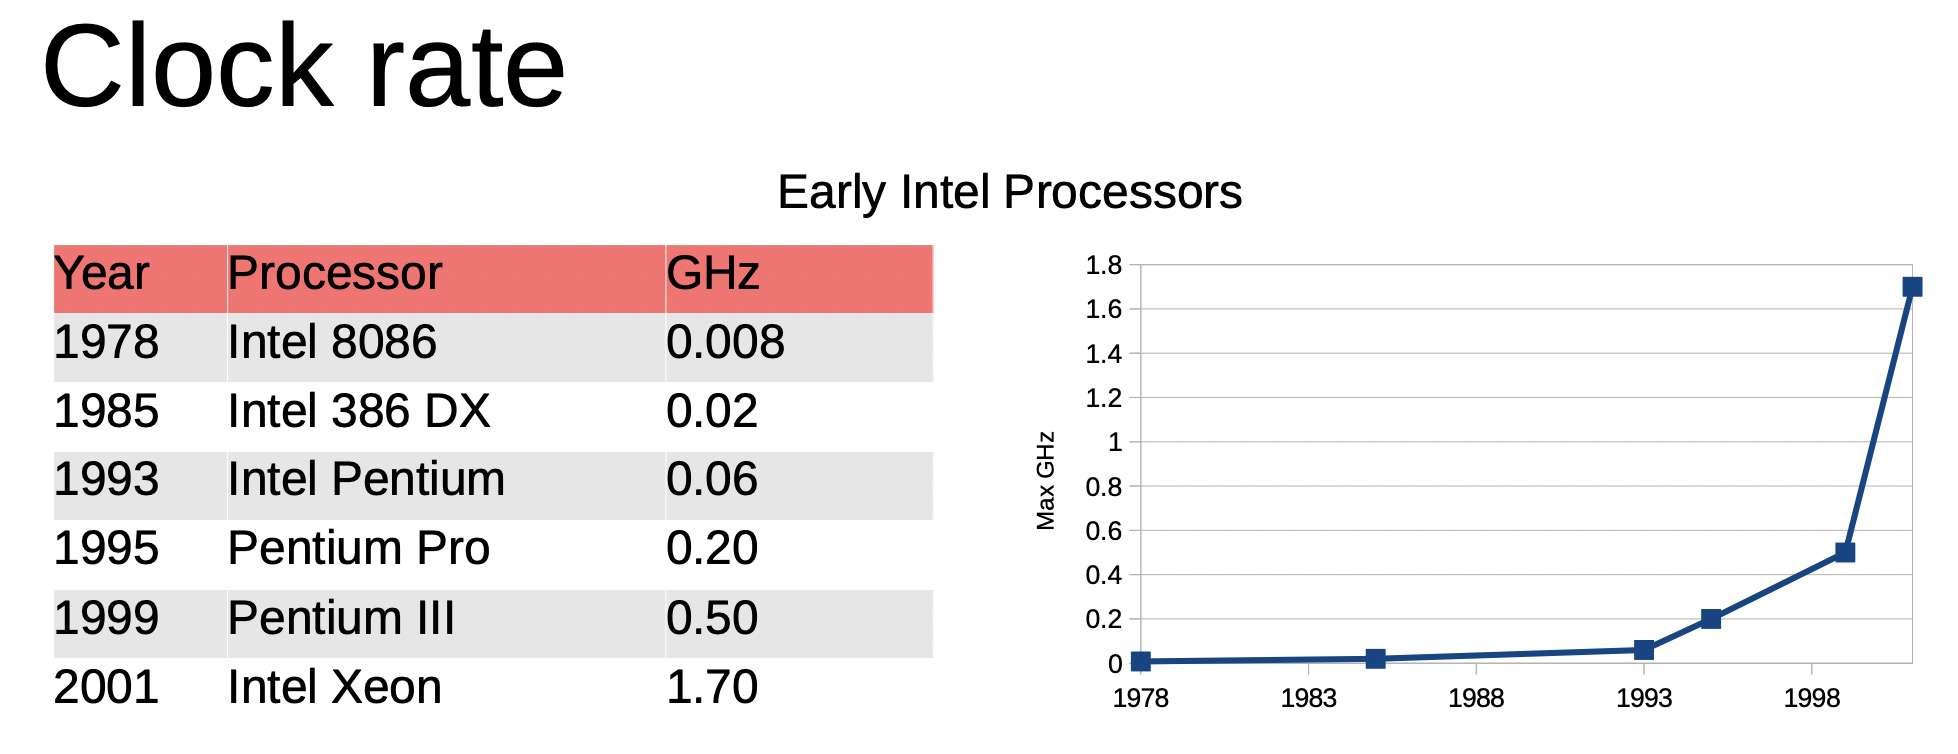
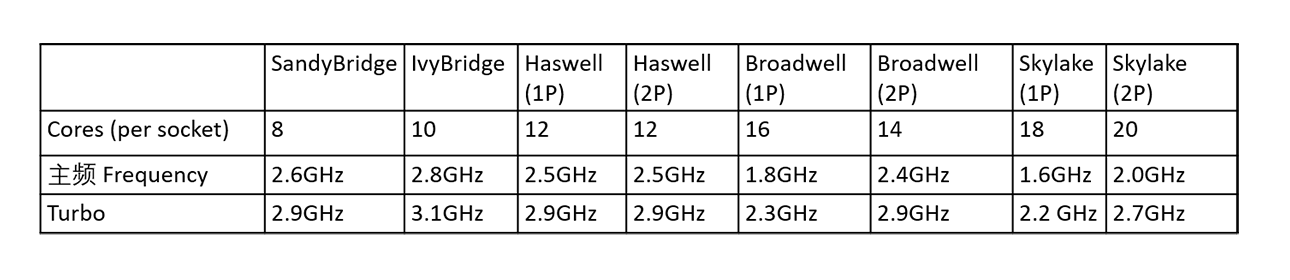
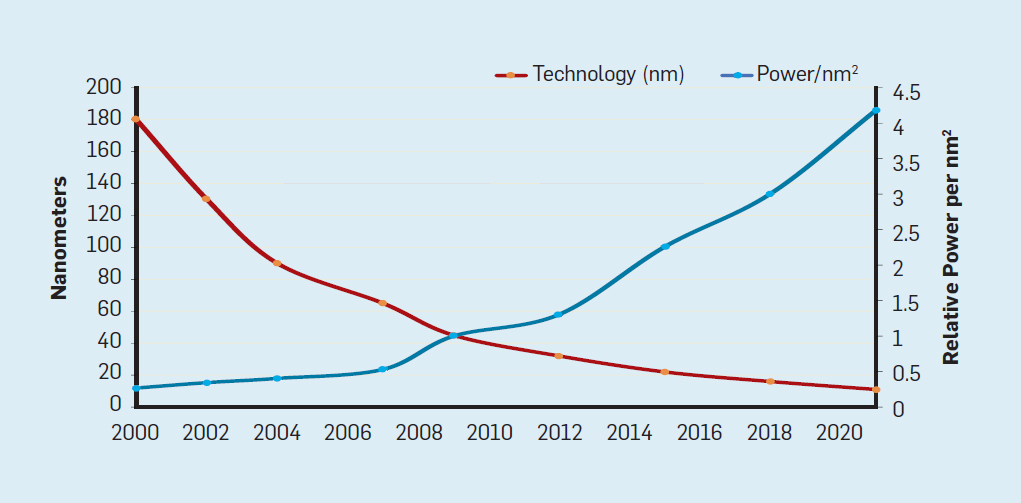
The successive nodes of CMOS technologies lead to x1.4 decrease of the gate delays. It led to a 25% increase per year of clock frequencies from 740 kHz (Intel 4004) to 3 GHz (Intel Xeons with 45-nm nodes).
Measuring Peak Injection Memory Bandwidths for the system Bandwidths are in MB/sec (1 MB/sec = 1,000,000 Bytes/sec) Using all the threads from each core if Hyper-threading is enabled Using traffic with the following read-write ratios ALL Reads : 232777.7 3:1 Reads-Writes : 216680.7 2:1 Reads-Writes : 213856.4 1:1 Reads-Writes : 197430.7 Stream-triad like: 194310.3
Measuring Memory Bandwidths between nodes within system Bandwidths are in MB/sec (1 MB/sec = 1,000,000 Bytes/sec) Using all the threads from each core if Hyper-threading is enabled Using Read-only traffic type Numa node Numa node 0 1 2 3 0 58908.9 59066.0 50548.0 50479.6 1 59111.3 58882.6 50539.0 50479.3 2 50541.7 50495.8 58950.2 58934.0 3 50526.3 50492.4 59171.9 58701.5
Measuring Loaded Latencies for the system Using all the threads from each core if Hyper-threading is enabled Using Read-only traffic type Inject Latency Bandwidth Delay (ns) MB/sec ========================== 00000 242.78 232249.0 00002 242.90 232248.8 00008 242.63 232226.0 00015 247.47 233159.0 00050 250.26 233489.7 00100 245.88 233253.4 00200 109.72 183071.9 00300 93.95 128676.2 00400 88.51 98678.4 00500 85.15 80026.2 00700 83.74 58136.1 01000 82.16 41372.4 01300 81.59 32184.0 01700 81.14 24896.1 02500 80.80 17248.5 03500 80.32 12571.3 05000 79.58 9060.5 09000 78.27 5411.6 20000 76.09 2911.5
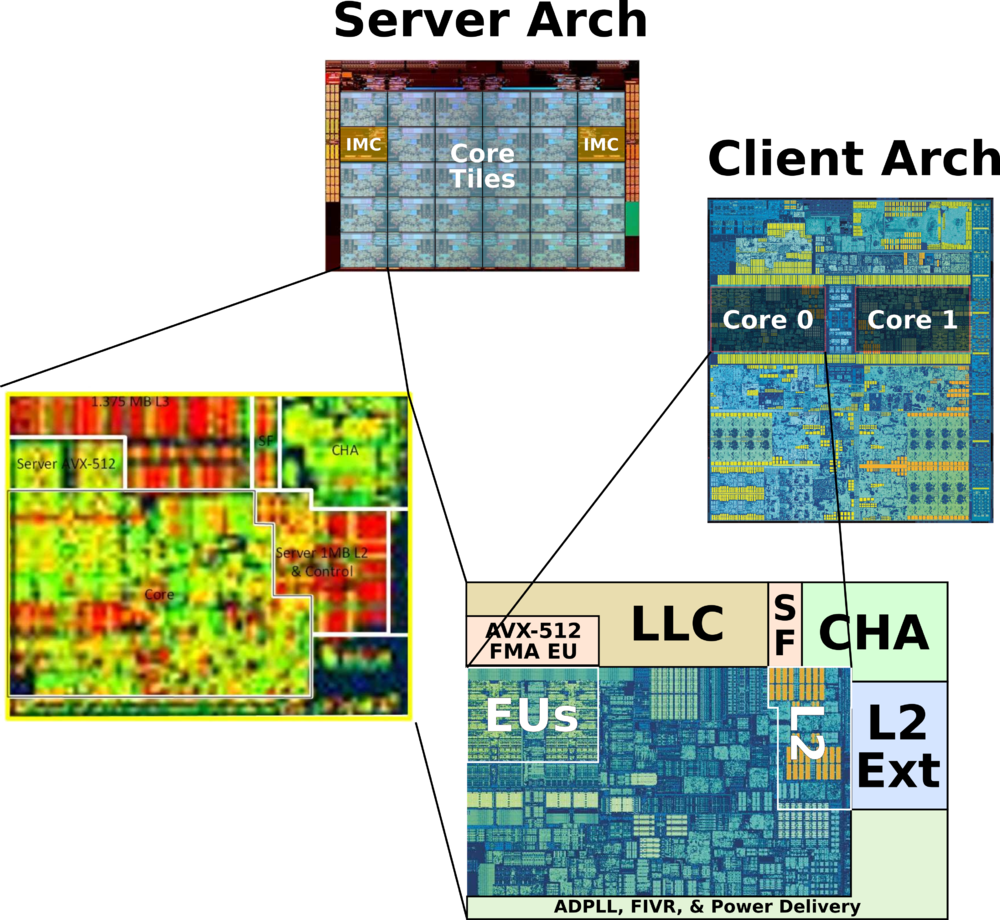
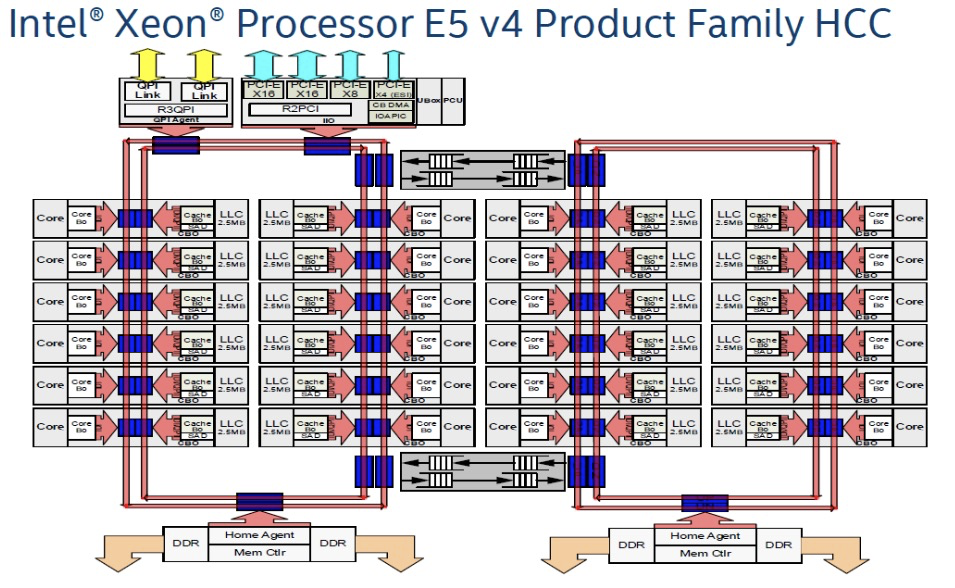
“Uncore“ is a term used by Intel to describe the functions of a microprocessor that are not in the core, but which must be closely connected to the core to achieve high performance.[1] It has been called “system agent“ since the release of the Sandy Bridgemicroarchitecture.[2]
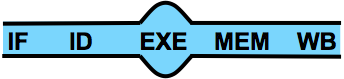
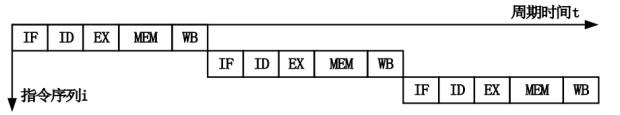
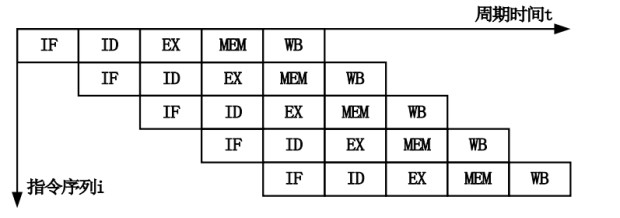
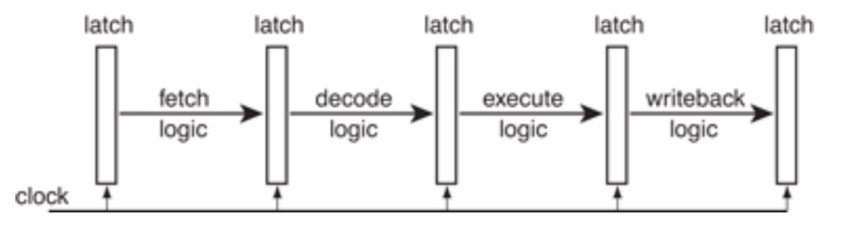
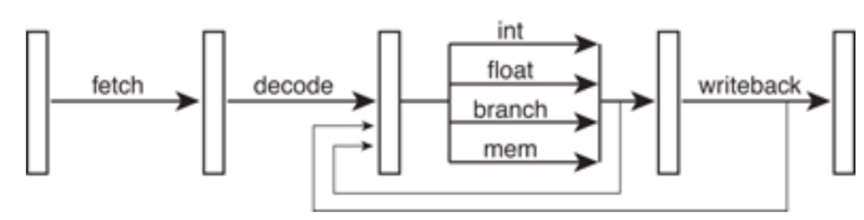
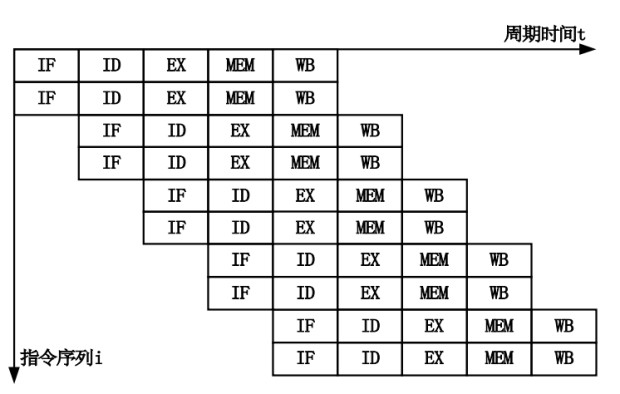
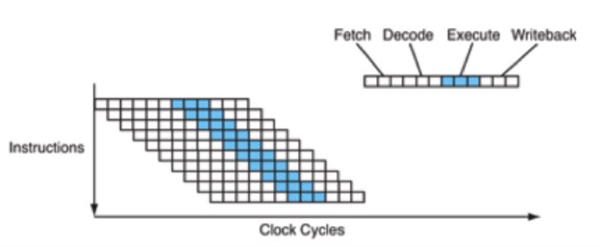
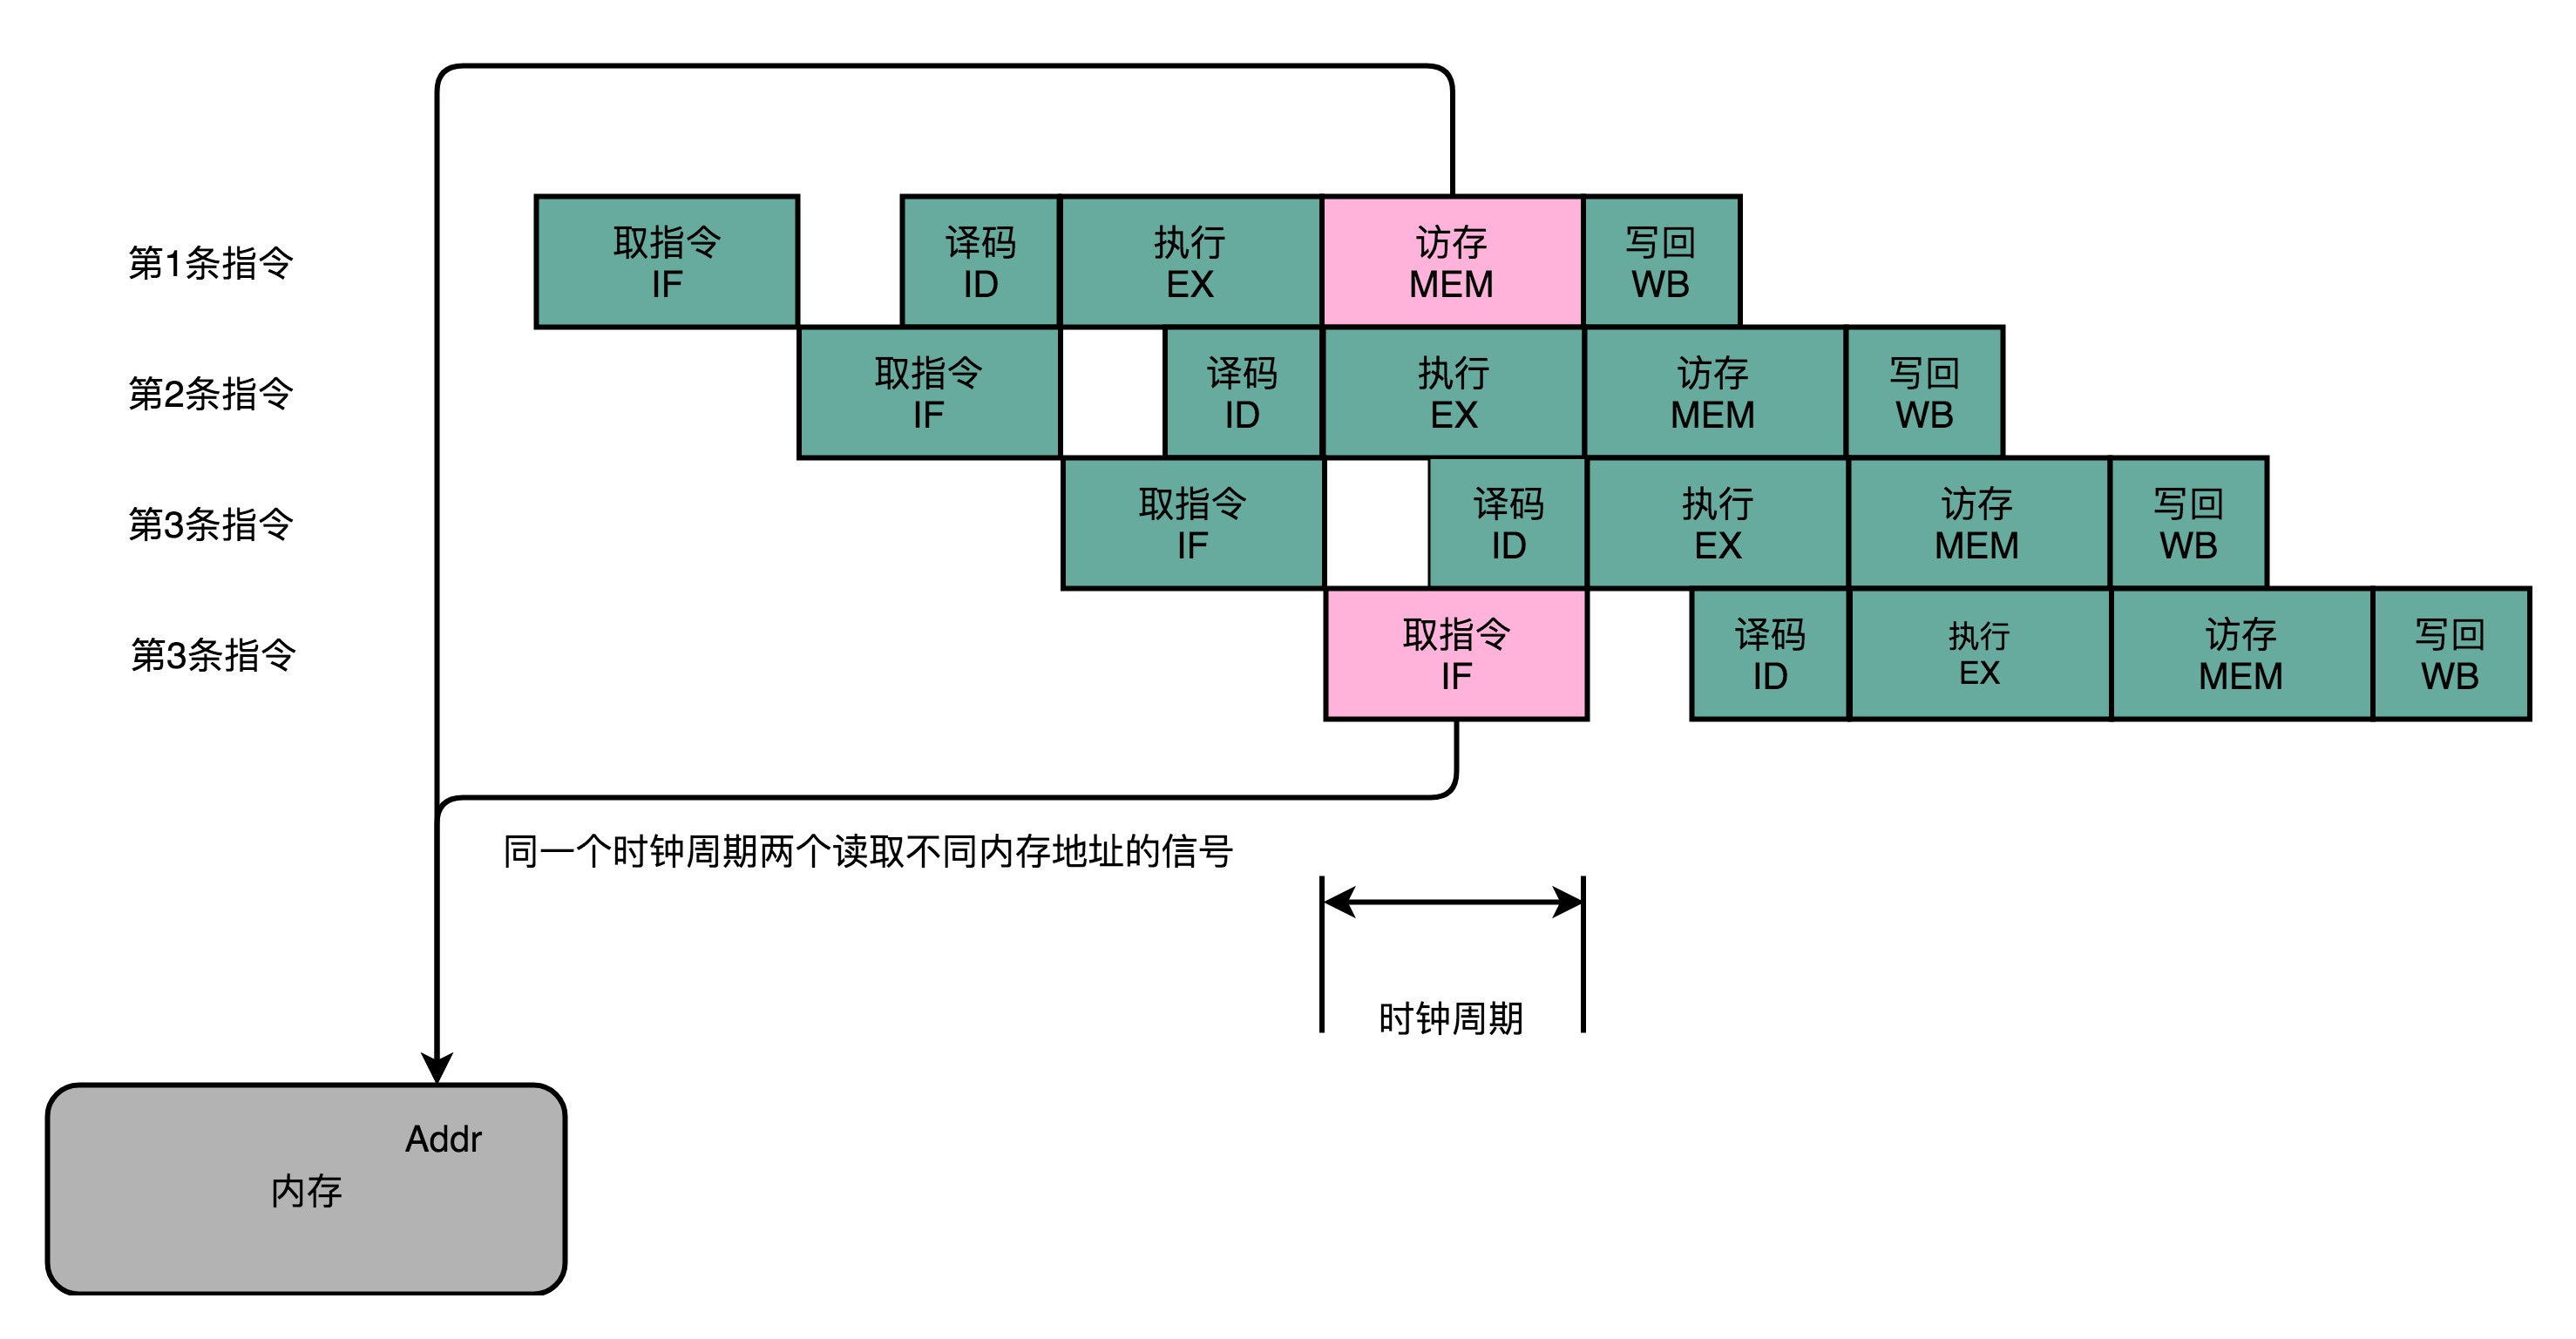
从最简单的单指令周期 CPU 来说,其实时钟周期应该是放下最复杂的一条指令的时间长度。但是,我们现在实际用的都没有单指令周期 CPU 了,而是采用了流水线技术。采用了流水线技术之后,单个时钟周期里面,能够执行的就不是一个指令了。我们会把一条机器指令,拆分成很多个小步骤。不同的指令的步骤数量可能还不一样。不同的步骤的执行时间,也不一样。所以,一个时钟周期里面,能够放下的是最耗时间的某一个指令步骤。
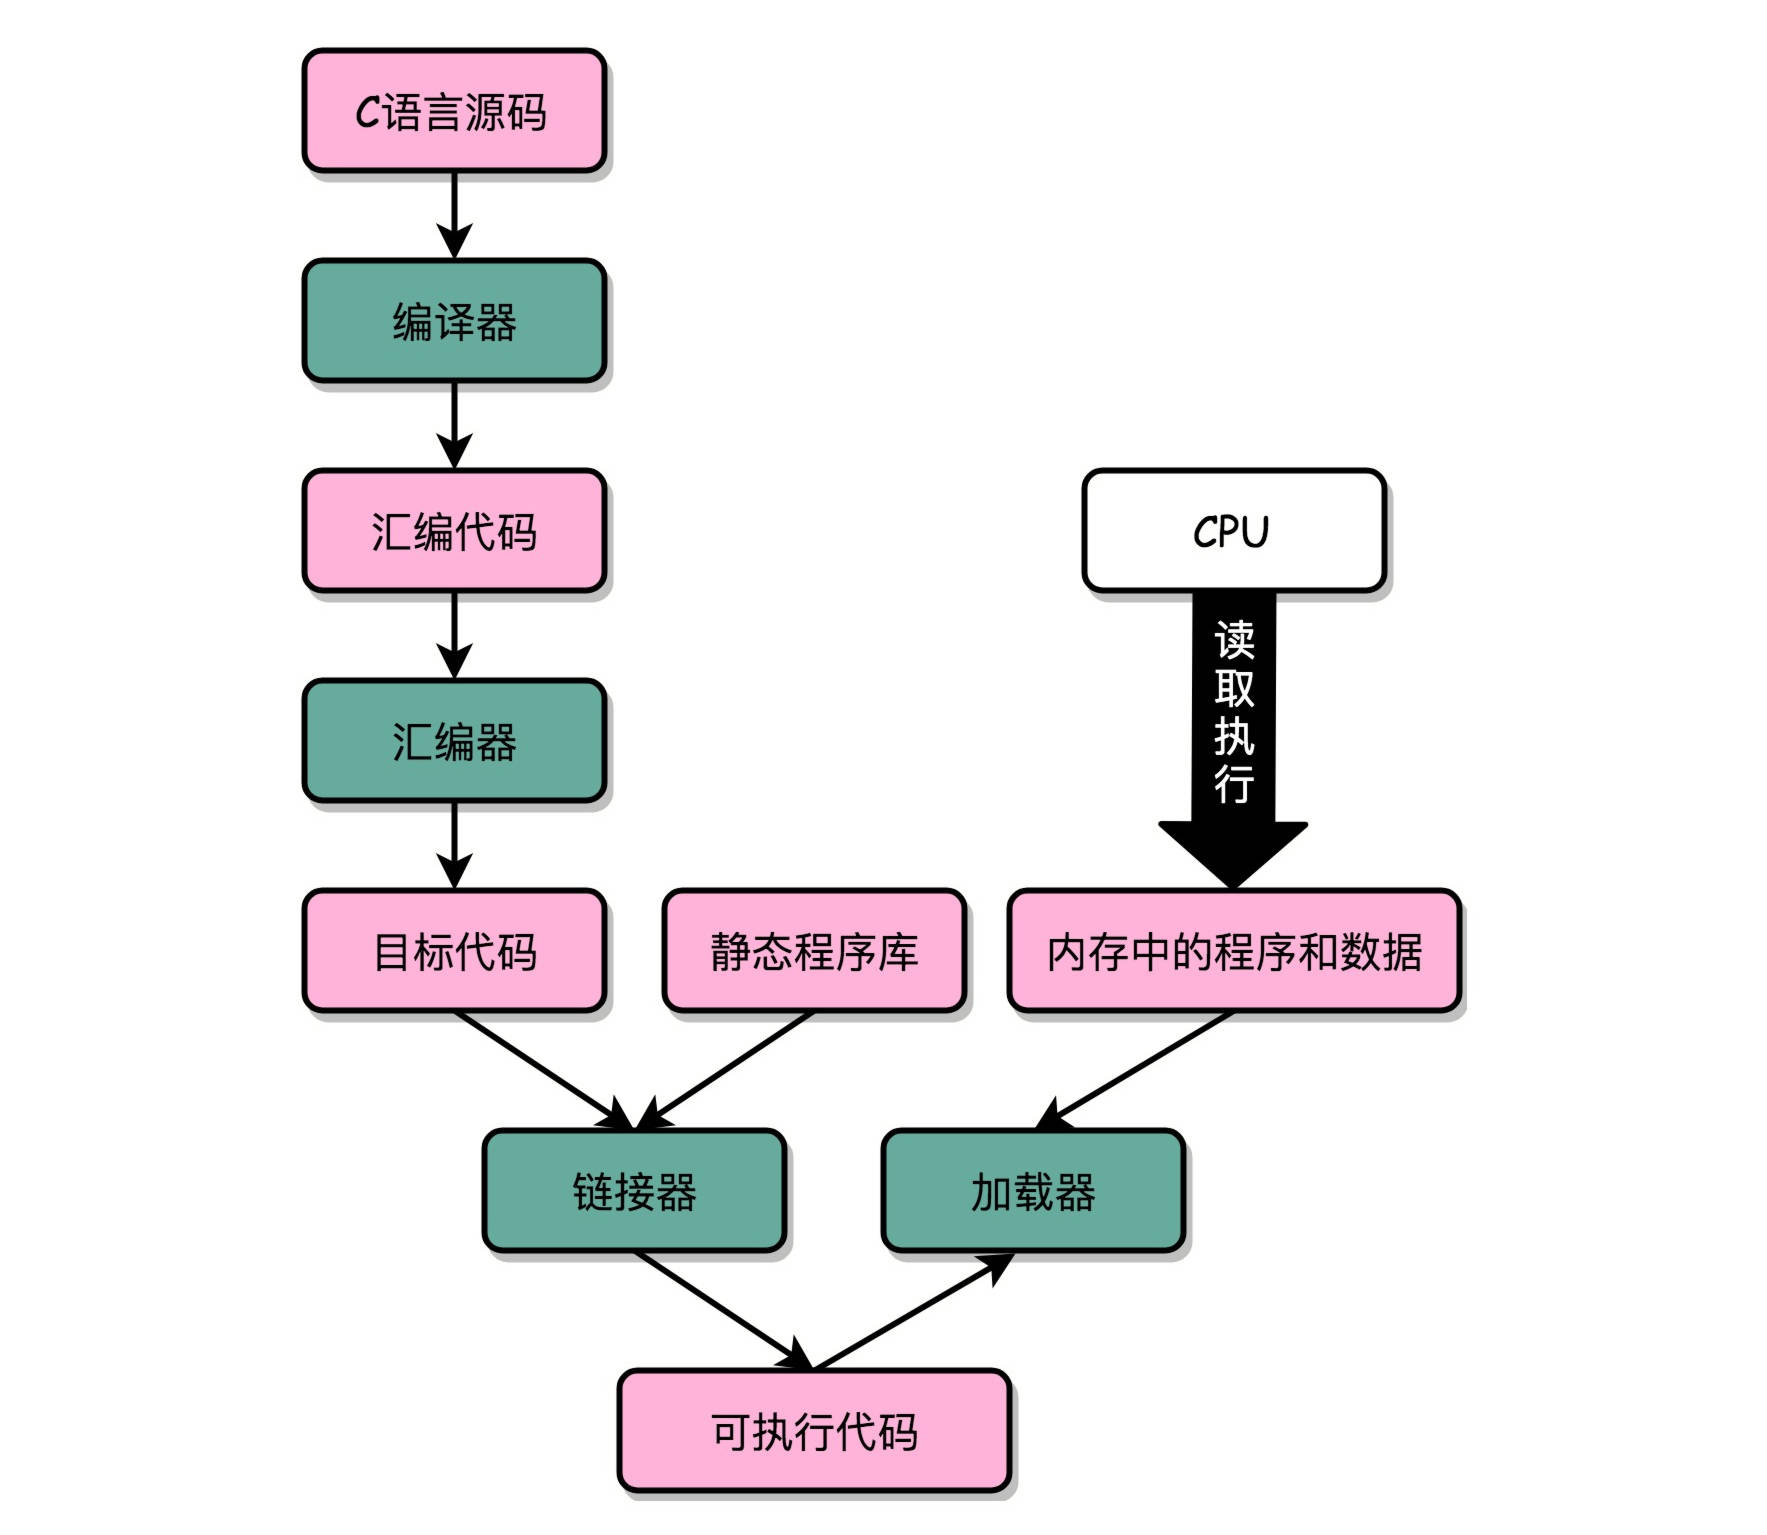
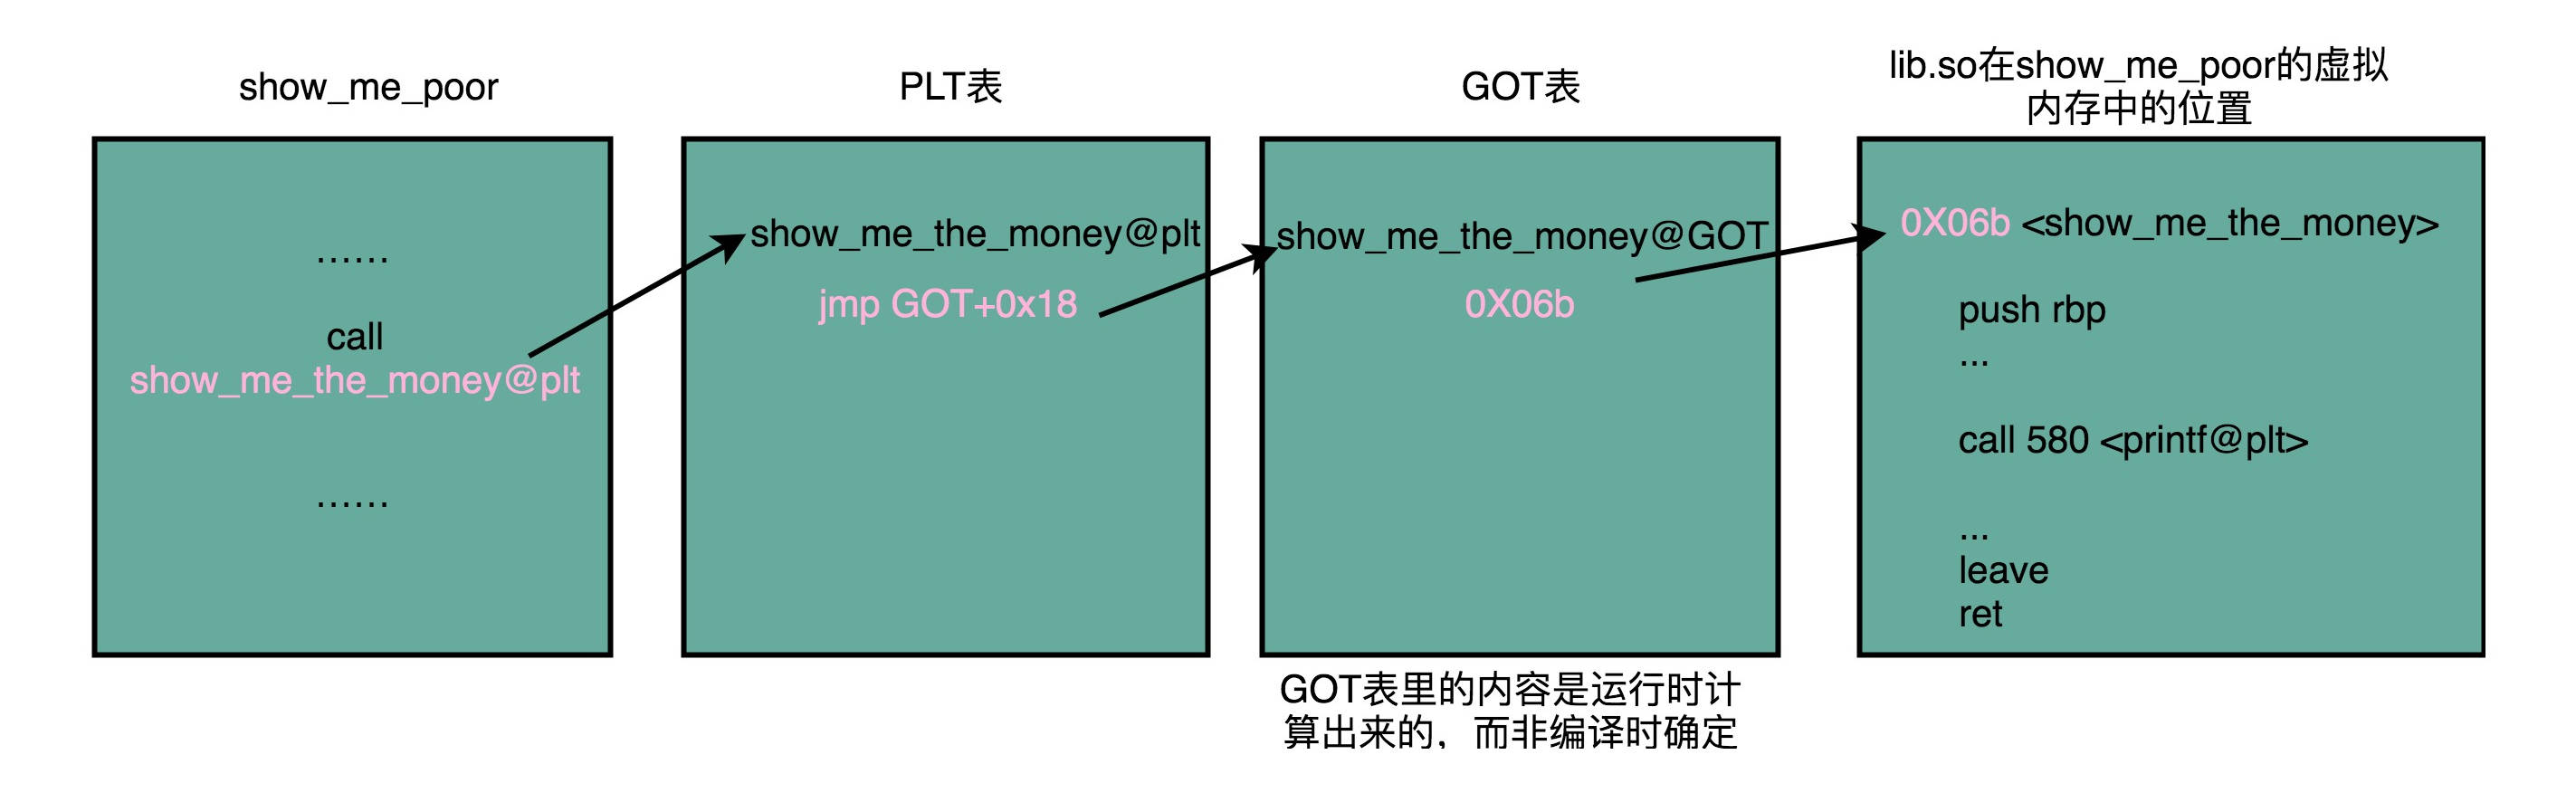
共享库:在 Windows 下,这些共享库文件就是.dll 文件,也就是 Dynamic-Link Libary(DLL,动态链接库)。在 Linux 下,这些共享库文件就是.so 文件,也就是 Shared Object(一般我们也称之为动态链接库). 不同的进程,调用同样的 lib.so,各自 全局偏移表(GOT,Global Offset Table) 里面指向最终加载的动态链接库里面的虚拟内存地址是不同的, 各个程序各自维护好自己的 GOT,能够找到对应的动态库就好了, 有点像函数指针。
符号表:/boot/System.map 和 /proc/kallsyms
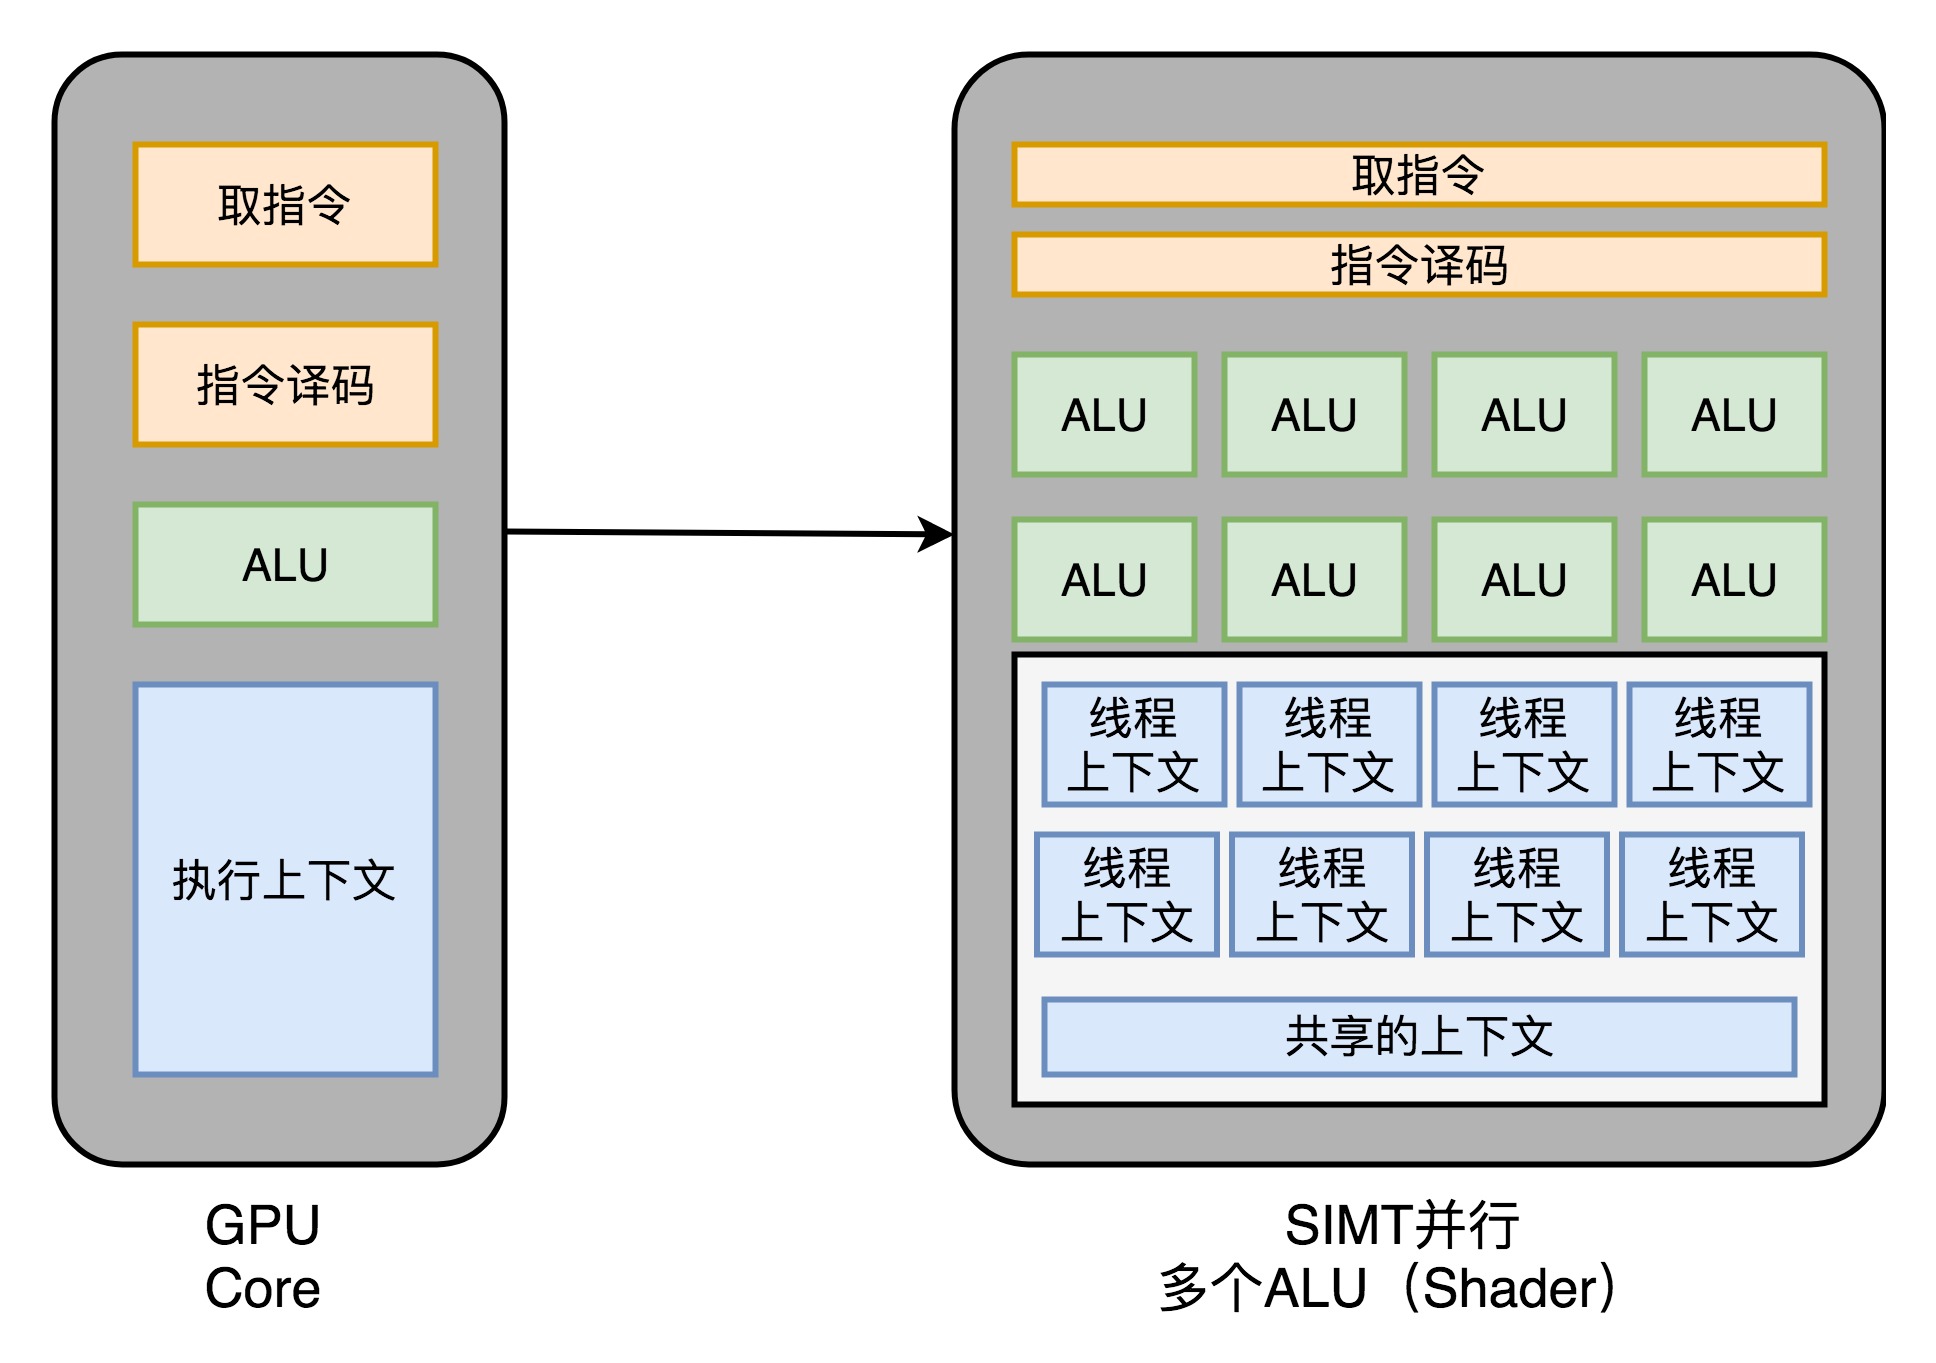
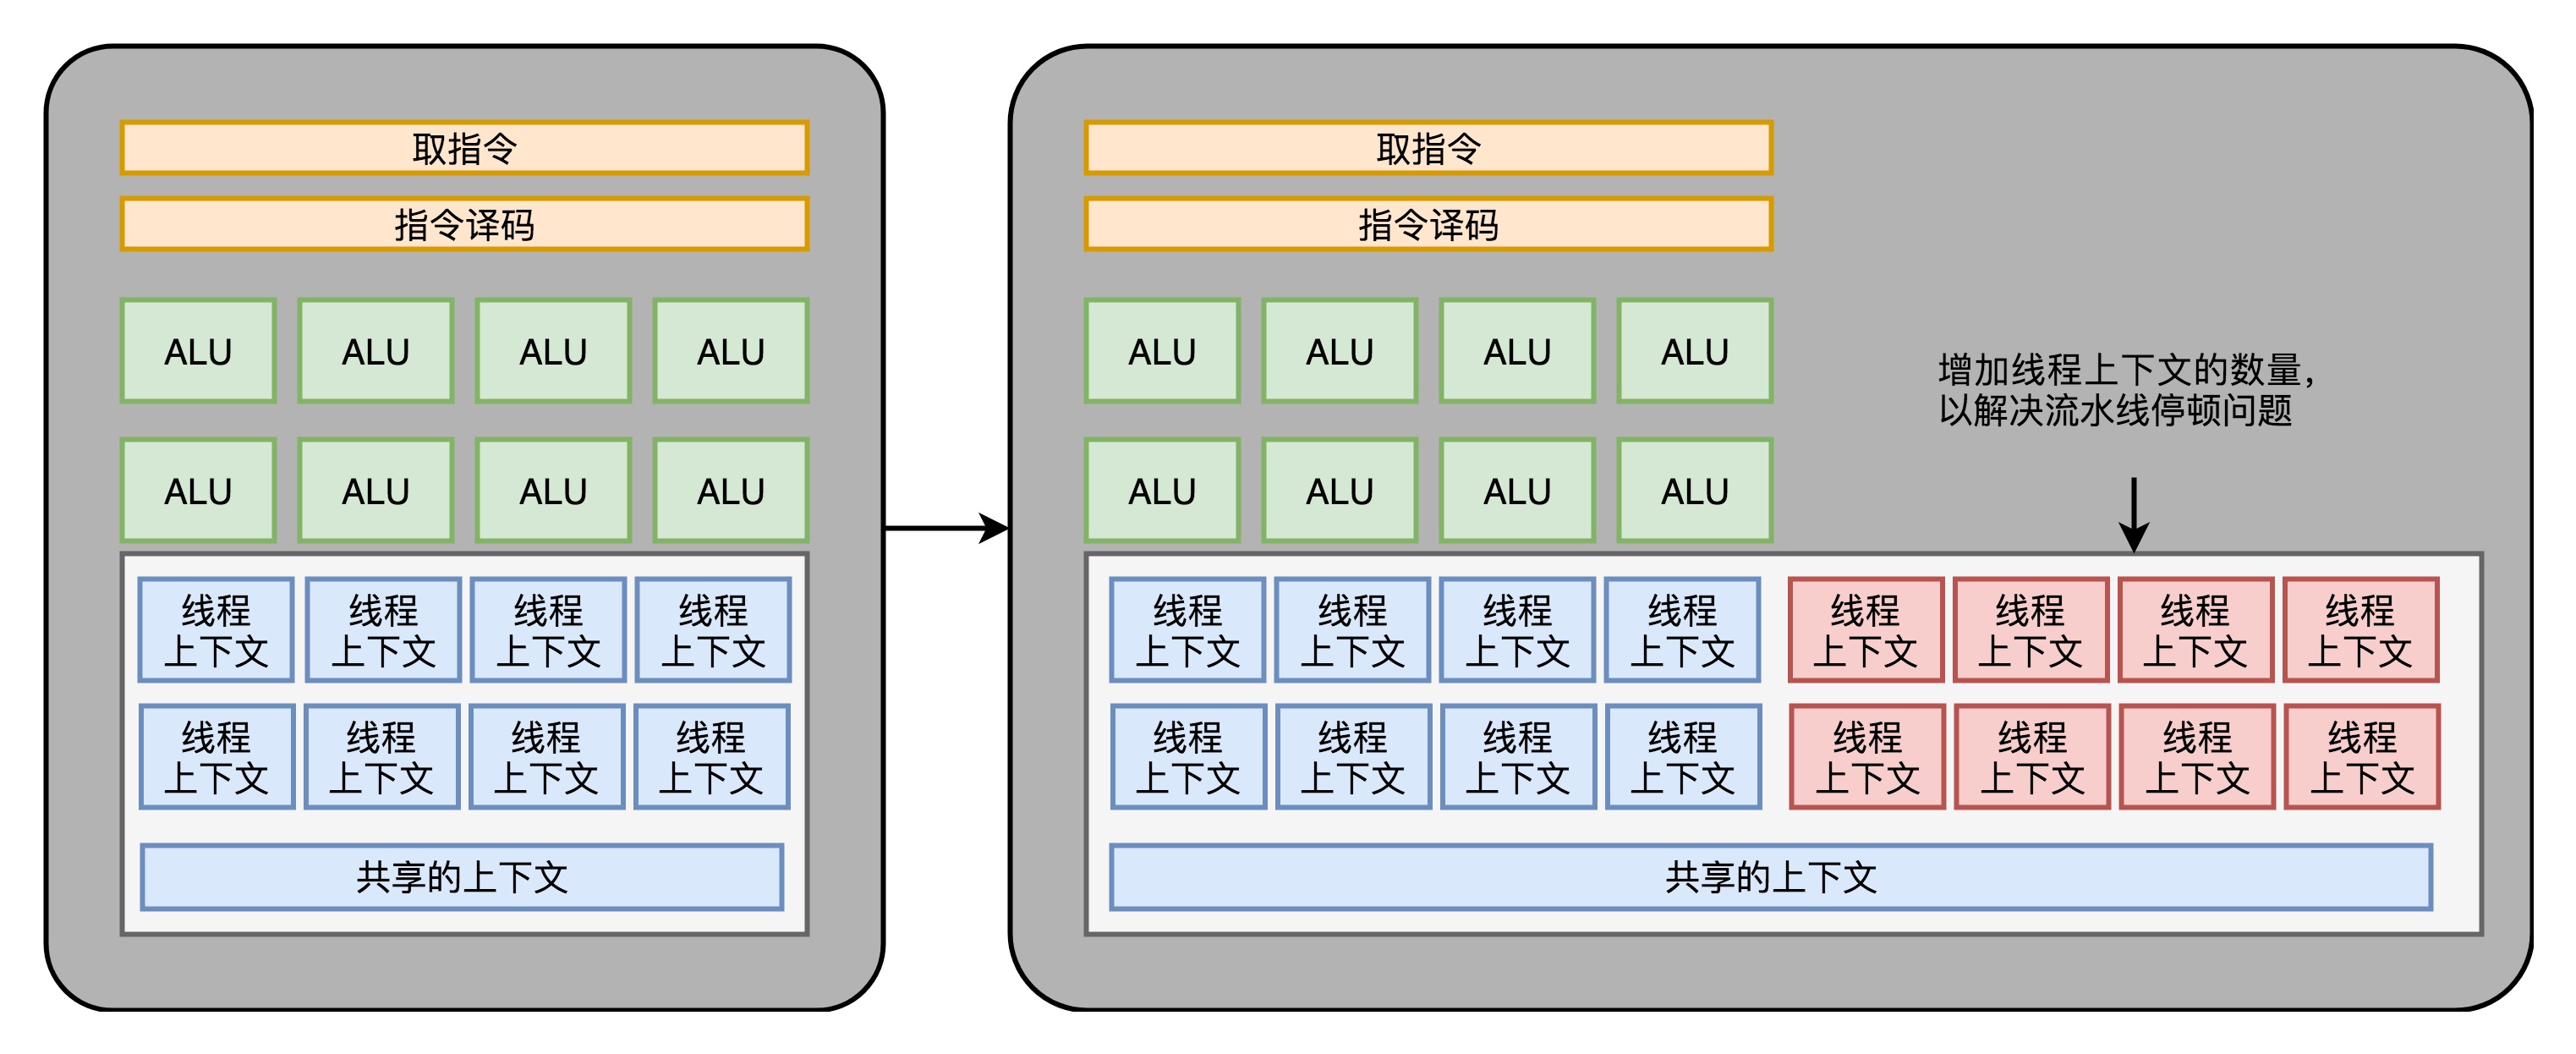
超线程(Hyper-Threading): 在CPU内部增加寄存器等硬件设施,但是ALU、译码器等关键单元还是共享。在一个物理 CPU 核心内部,会有双份的 PC 寄存器、指令寄存器乃至条件码寄存器。超线程的目的,是在一个线程 A 的指令,在流水线里停顿的时候,让另外一个线程去执行指令。因为这个时候,CPU 的译码器和 ALU 就空出来了,那么另外一个线程 B,就可以拿来干自己需要的事情。这个线程 B 可没有对于线程 A 里面指令的关联和依赖。
Cache Line 是 CPU 和主存之间数据传输的最小单位。当一行 Cache Line 被从内存拷贝到 Cache 里,Cache 里会为这个 Cache Line 创建一个条目。这个 Cache 条目里既包含了拷贝的内存数据,即 Cache Line,又包含了这行数据在内存里的位置等元数据信息。
处理器都实现了 Cache 一致性 (Cache Coherence)协议。如历史上 x86 曾实现了 MESI 协议,以及 MESIF 协议。
假设两个处理器 A 和 B, 都在各自本地 Cache Line 里有同一个变量的拷贝时,此时该 Cache Line 处于 Shared 状态。当处理器 A 在本地修改了变量,除去把本地变量所属的 Cache Line 置为 Modified 状态以外,还必须在另一个处理器 B 读同一个变量前,对该变量所在的 B 处理器本地 Cache Line 发起 Invaidate 操作,标记 B 处理器的那条 Cache Line 为 Invalidate 状态。随后,若处理器 B 在对变量做读写操作时,如果遇到这个标记为 Invalidate 的状态的 Cache Line,即会引发 Cache Miss,从而将内存中最新的数据拷贝到 Cache Line 里,然后处理器 B 再对此 Cache Line 对变量做读写操作。
long timediff(clock_t t1, clock_t t2) { long elapsed; elapsed = ((double)t2 - t1) / CLOCKS_PER_SEC * 1000; return elapsed; }
int main(int argc, char *argv[]) { long length=64*1024*1024; int* arr=malloc(64*1024*1024 * sizeof(int)); long i=0; long j=0; for (i = 0; i < length; i++) arr[i] = i;
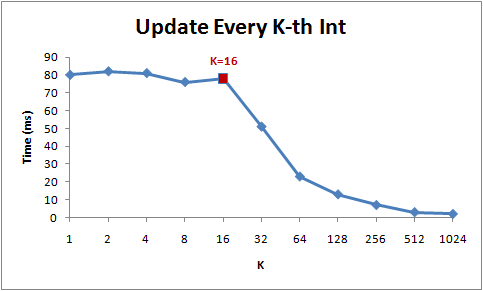
clock_t start=clock(); // 循环1 for(j=0; j<10; j++){ for (i = 0; i < length; i++) arr[i] *= 3; //每取一次arr[i], 通过cache_line顺便把后面15个arr[i]都取过来了 } clock_t end =clock(); printf("%lu\n", timediff(start,end));
start=clock(); // 循环2 for(j=0; j<10; j++){ for (i = 0; i < length; i += 16) arr[i] *= 3; } end =clock(); printf("%lu\n", timediff(start,end)); }
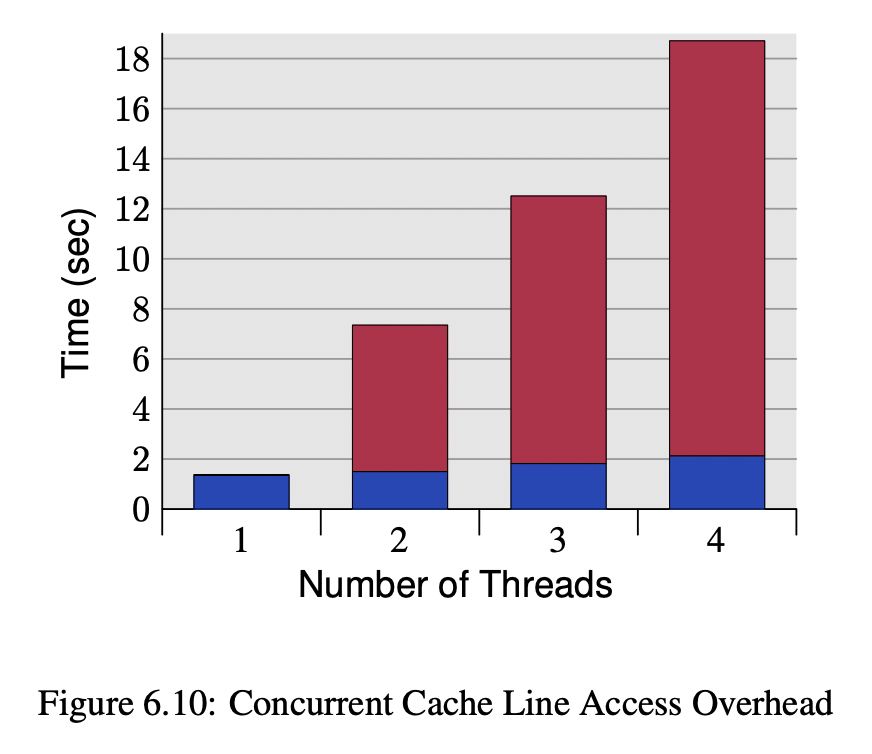
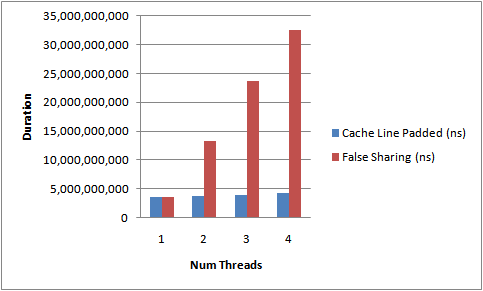
We will illustrate the cost of locks with a simple demonstration. The focus of this experiment is to call a function which increments a 64-bit counter in a loop 500 million times. This can be executed by a single thread on a 2.4Ghz Intel Westmere EP in just 300ms if written in Java. The language is unimportant to this experiment and results will be similar across all languages with the same basic primitives.
Once a lock is introduced to provide mutual exclusion, even when the lock is as yet un-contended, the cost goes up significantly. The cost increases again, by orders of magnitude, when two or more threads begin to contend. The results of this simple experiment are shown in the table below:
public class LockBenchmark{ public static void runIncrement() { long counter = 0; long max = 50000000000L; long start = System.currentTimeMillis(); while (counter < max) { counter++; } long end = System.currentTimeMillis(); System.out.println("Time spent is " + (end-start) + "ms without lock"); }
public static void runIncrementWithLock() { Lock lock = new ReentrantLock(); long counter = 0; long max = 500000000L; long start = System.currentTimeMillis(); while (counter < max) { if (lock.tryLock()){ counter++; lock.unlock(); } } long end = System.currentTimeMillis(); System.out.println("Time spent is " + (end-start) + "ms with lock"); }
public class LockBenchmark{ public static void runIncrement() { long counter = 0; long max = 500000000L; double sum =100.0; long start = System.currentTimeMillis(); while (counter < max) { counter++; sum=3.251; for(int i=0; i<10; ++i){ sum += sum*3.75/3; } } long end = System.currentTimeMillis(); System.out.println("Time spent is " + (end-start) + "ms without lock:"+sum); }
public static void runIncrementWithLock() { Lock lock = new ReentrantLock(); long counter = 0; double sum=100.0; long max = 500000000L; long start = System.currentTimeMillis(); while (counter < max) { if (lock.tryLock()){ counter++; sum=3.253; for(int i=0; i<10; ++i){ sum += sum*3.75/3; } lock.unlock(); } } long end = System.currentTimeMillis(); System.out.println("Time spent is " + (end-start) + "ms with lock:"+sum); }
#java test.LockBenchmark //如上代码循环次数都是5亿次, intel cpu Time spent is 11884ms without lock:10810.40962948895 start runIncrementWithLock. Time spent is 22662ms with lock:10817.060142949109
#perf stat -p `jps | grep LockBenchmark | awk '{ print $1 }'` ^C Performance counter stats for process id '117862':
#java test.LockBenchmark //鲲鹏920 Time spent is 37037ms without lock:10810.40962948895 start runIncrementWithLock. Time spent is 37045ms with lock:10817.060142949109 //极低的概率这里能跑出来15秒,应该是偷鸡优化了
#perf stat -p `jps | grep LockBenchmark | awk '{ print $1 }'` ^Cfailed to read counter branches
Performance counter stats for process id '104166':
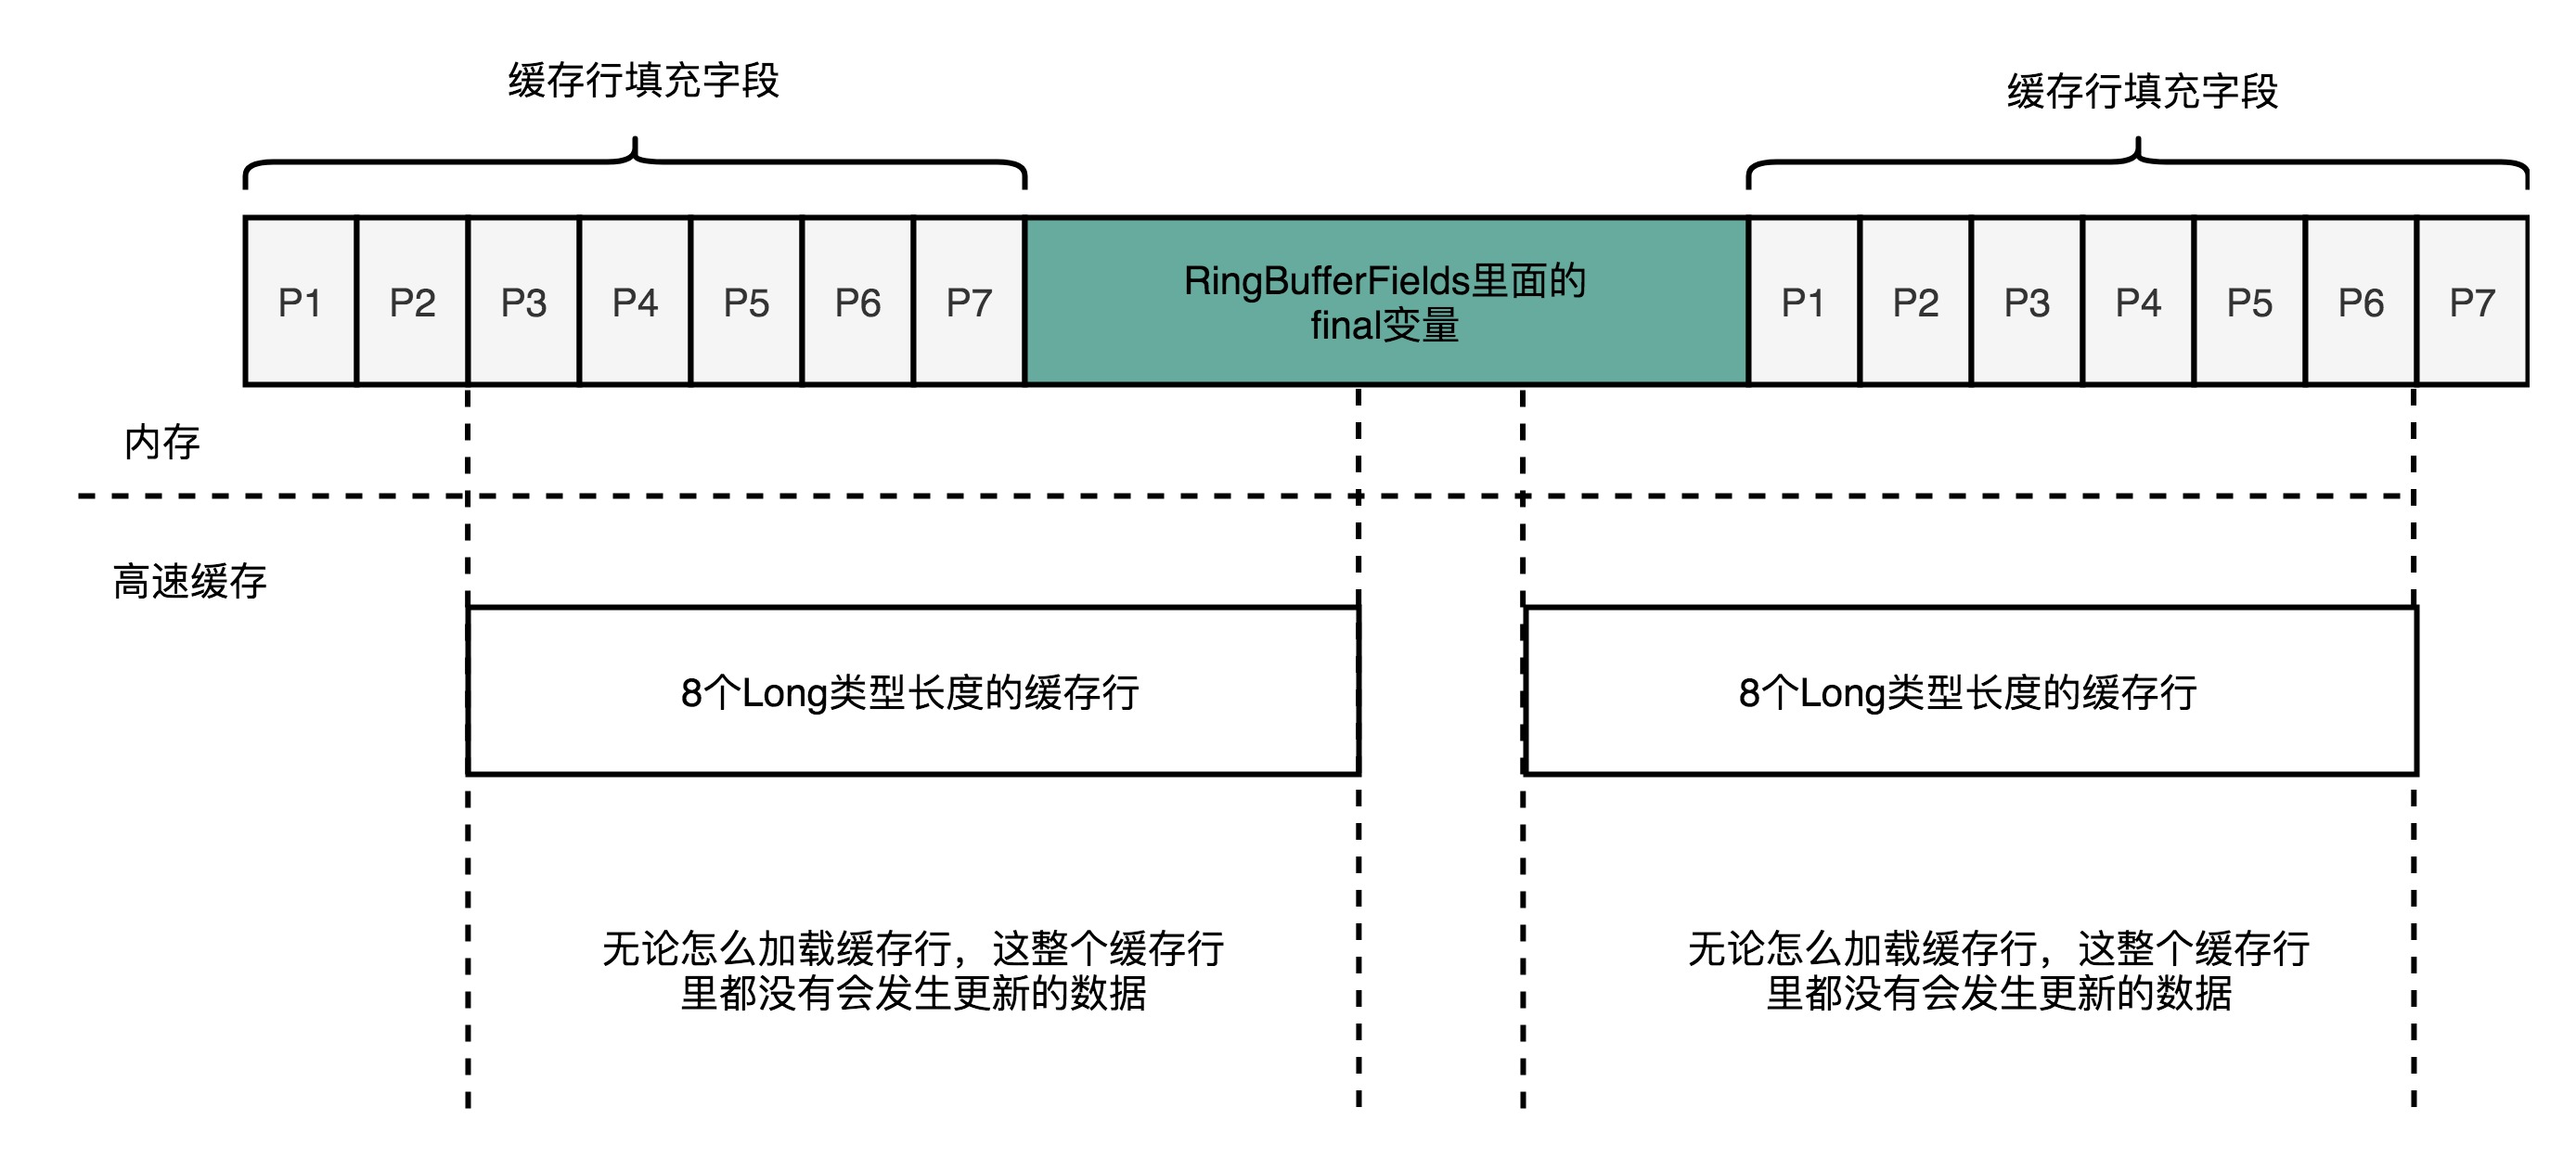
abstract class RingBufferPad
{
    protected long p1, p2, p3, p4, p5, p6, p7;
}

abstract class RingBufferFields<E> extends RingBufferPad
{
    ......
    private final long indexMask;
    private final Object[] entries;
    protected final int bufferSize;
    protected final Sequencer sequencer;
    ......
}

public final class RingBuffer<E> extends RingBufferFields<E> implements Cursored, EventSequencer<E>, EventSink<E>
{
    ......
    protected long p1, p2, p3, p4, p5, p6, p7;
    ......
}
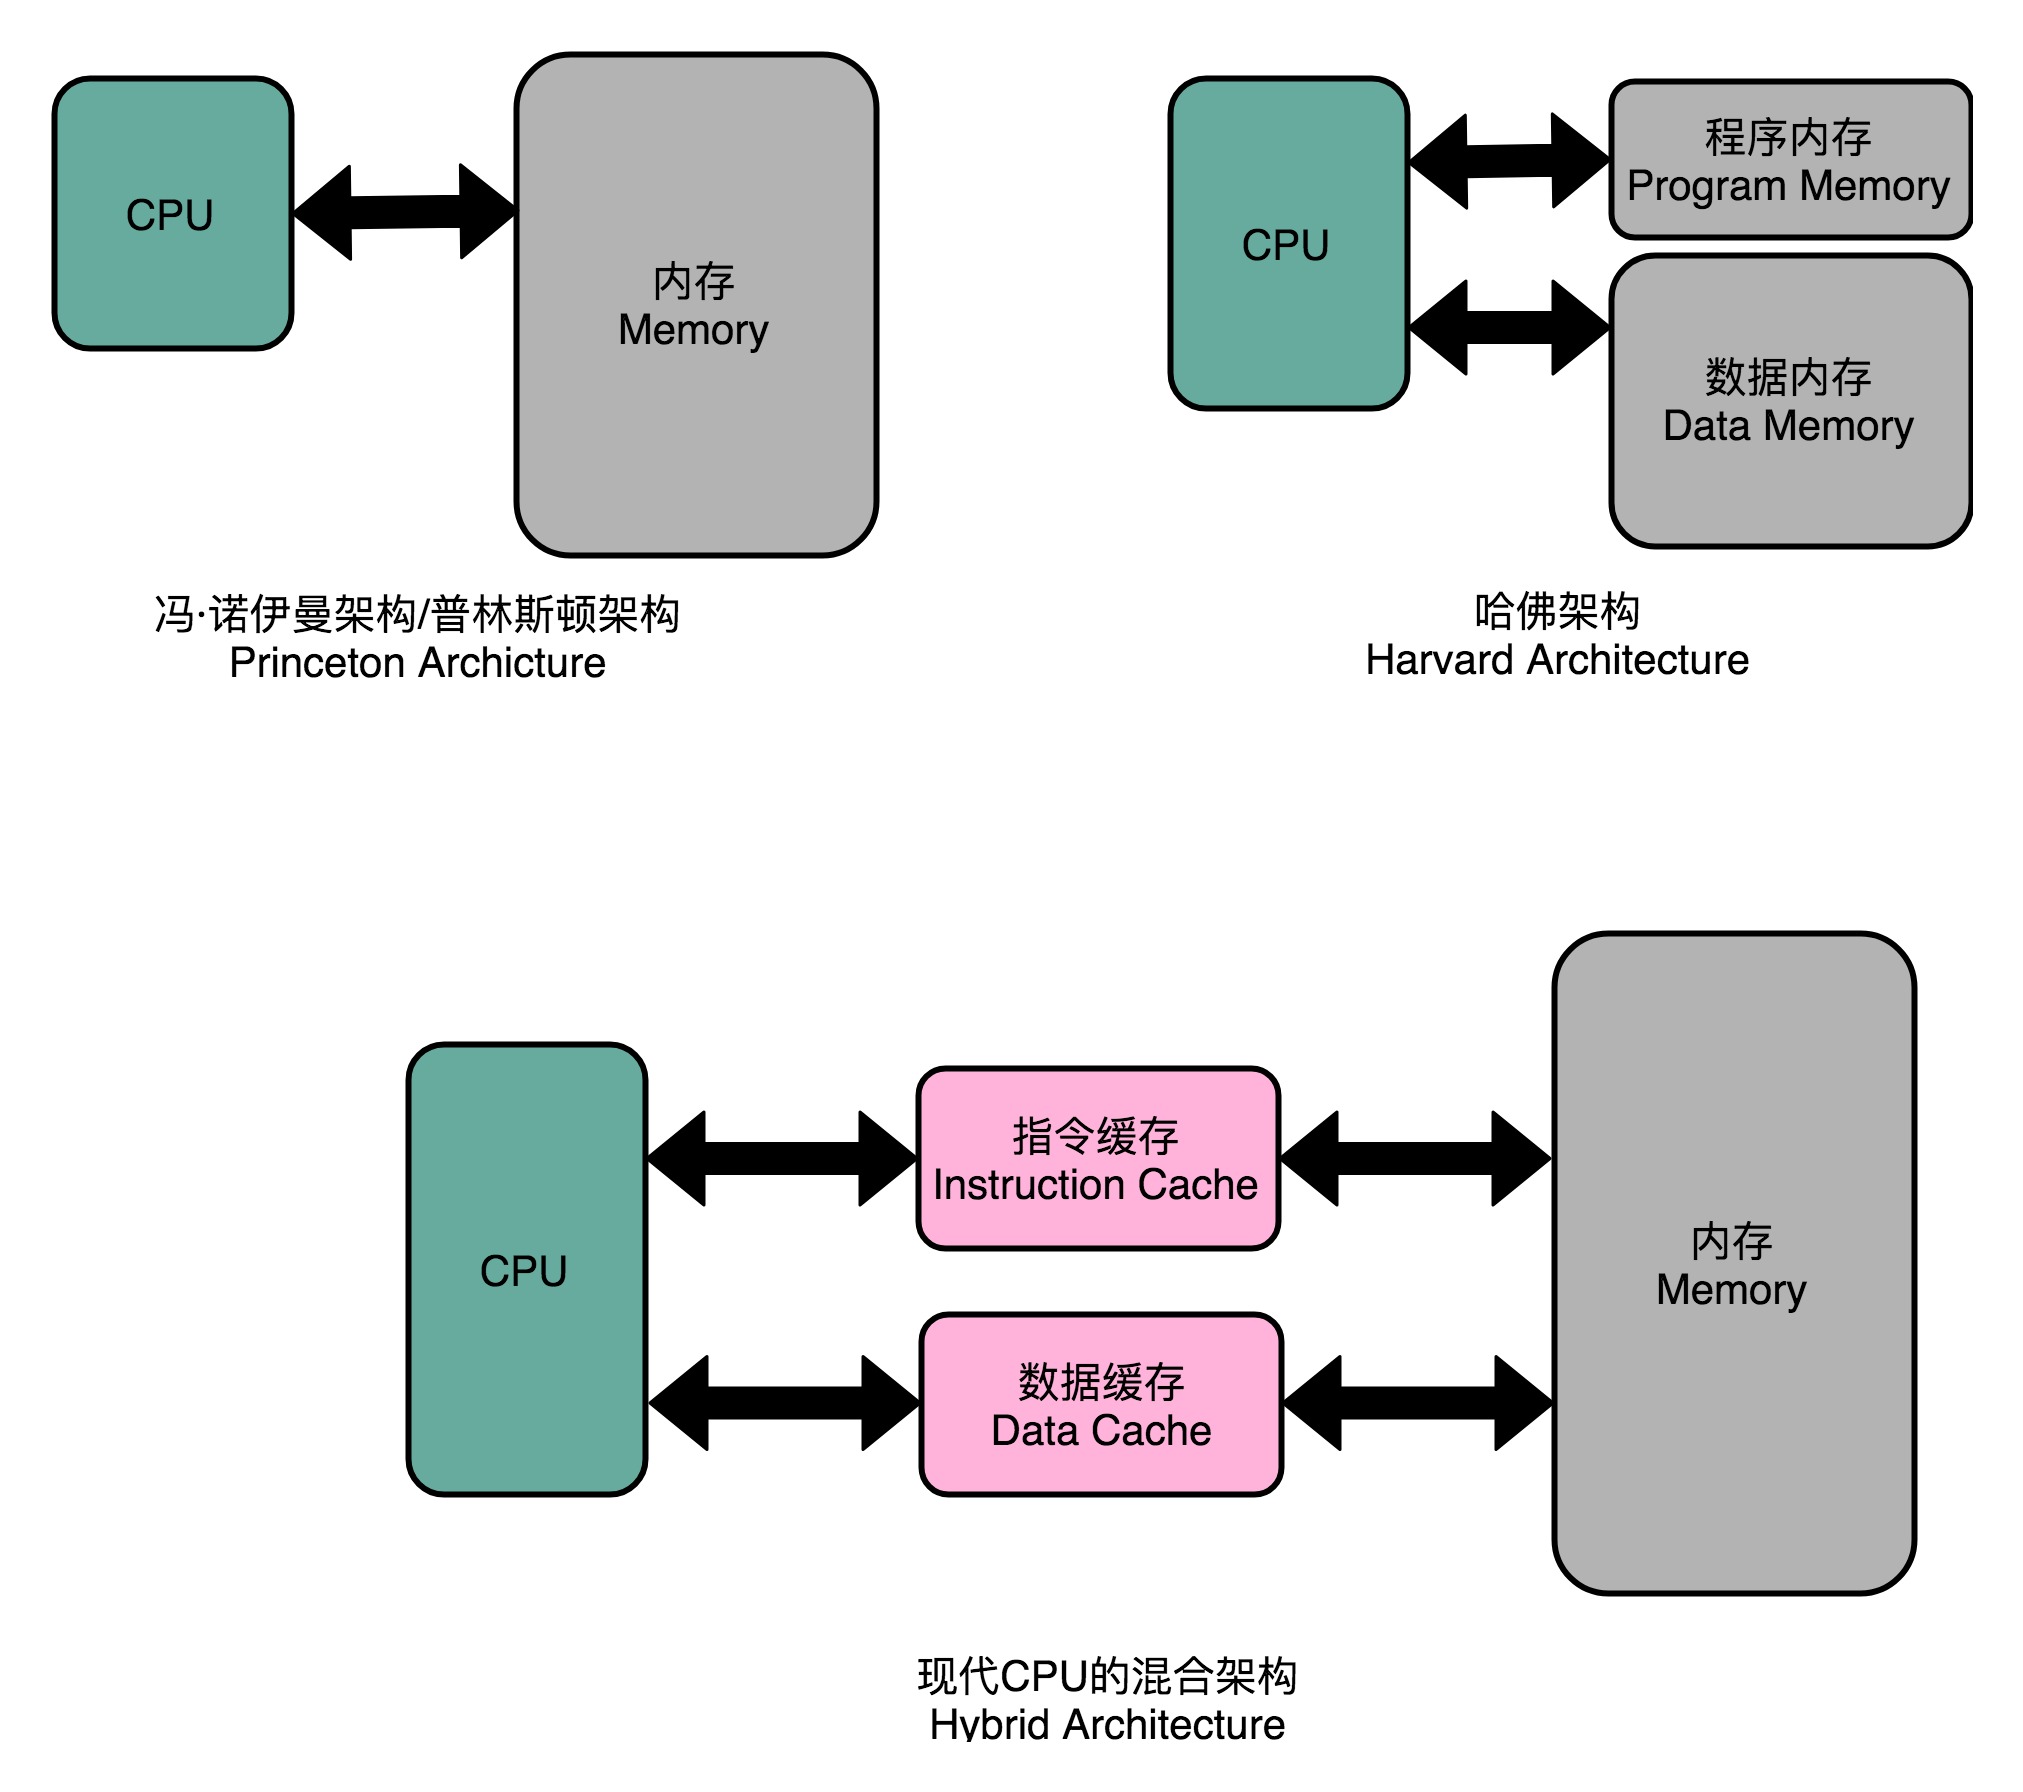
把内存拆成两部分的解决方案,在计算机体系结构里叫作哈佛架构(Harvard Architecture),来自哈佛大学设计Mark I 型计算机时候的设计。我们今天使用的 CPU,仍然是冯·诺依曼体系结构的,并没有把内存拆成程序内存和数据内存这两部分。因为如果那样拆的话,对程序指令和数据需要的内存空间,我们就没有办法根据实际的应用去动态分配了。虽然解决了资源冲突的问题,但是也失去了灵活性。
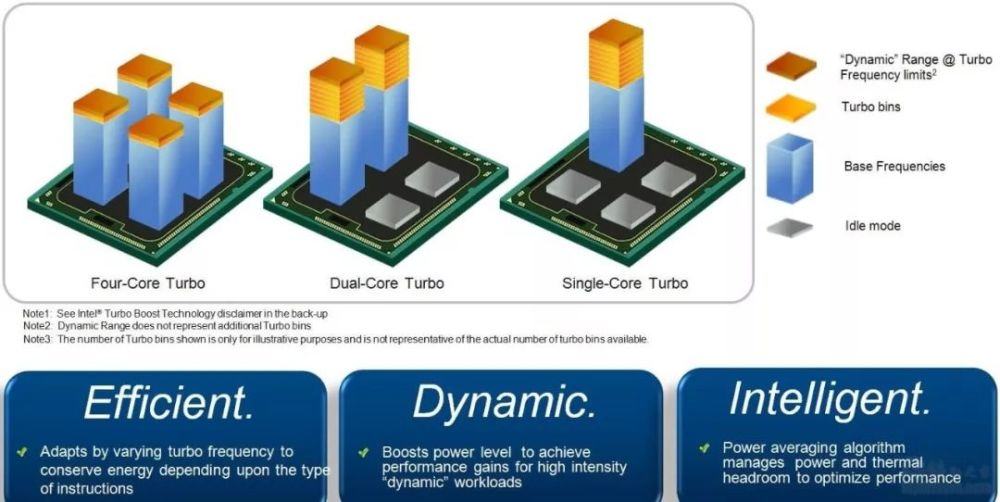
Two logical cores can work through tasks more efficiently than a traditional single-threaded core. By taking advantage of idle time when the core would formerly be waiting for other tasks to complete, Intel® Hyper-Threading Technology improves CPU throughput (by up to 30% in server applications).
举个例子,如果一个线程运行过程中,必须要等到一些数据加载到缓存中以后才能继续执行,此时 CPU 就可以切换到另一个线程,去执行其他指令,而不用去处于空闲状态,等待当前线程的数据加载完毕。通常,一个传统的处理器在线程之间切换,可能需要几万个时钟周期。而一个具有 HT 超线程技术的处理器只需要 1 个时钟周期。因此就大大减小了线程之间切换的成本,从而最大限度地让处理器满负荷运转。
ARM芯片基本不做超线程,另外请思考为什么有了应用层的多线程切换还需要CPU层面的超线程?
超线程(Hyper-Threading)物理实现: 在CPU内部增加寄存器等硬件设施,但是ALU、译码器等关键单元还是共享。在一个物理 CPU 核心内部,会有双份的 PC 寄存器、指令寄存器乃至条件码寄存器。超线程的目的,是在一个线程 A 的指令,在流水线里停顿的时候,让另外一个线程去执行指令。因为这个时候,CPU 的译码器和 ALU 就空出来了,那么另外一个线程 B,就可以拿来干自己需要的事情。这个线程 B 可没有对于线程 A 里面指令的关联和依赖。
把内存拆成两部分的解决方案,在计算机体系结构里叫作哈佛架构(Harvard Architecture),来自哈佛大学设计Mark I 型计算机时候的设计。我们今天使用的 CPU,仍然是冯·诺依曼体系结构的,并没有把内存拆成程序内存和数据内存这两部分。因为如果那样拆的话,对程序指令和数据需要的内存空间,我们就没有办法根据实际的应用去动态分配了。虽然解决了资源冲突的问题,但是也失去了灵活性。
在流水线产生依赖的时候必须pipeline stall,也就是让依赖的指令执行NOP。
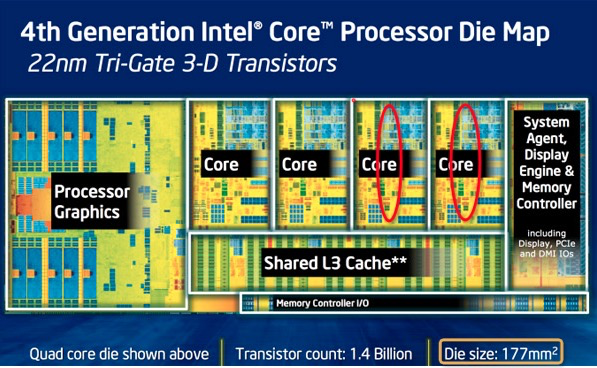
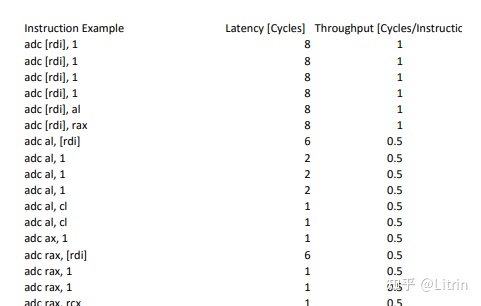
Intel X86每个指令需要的cycle
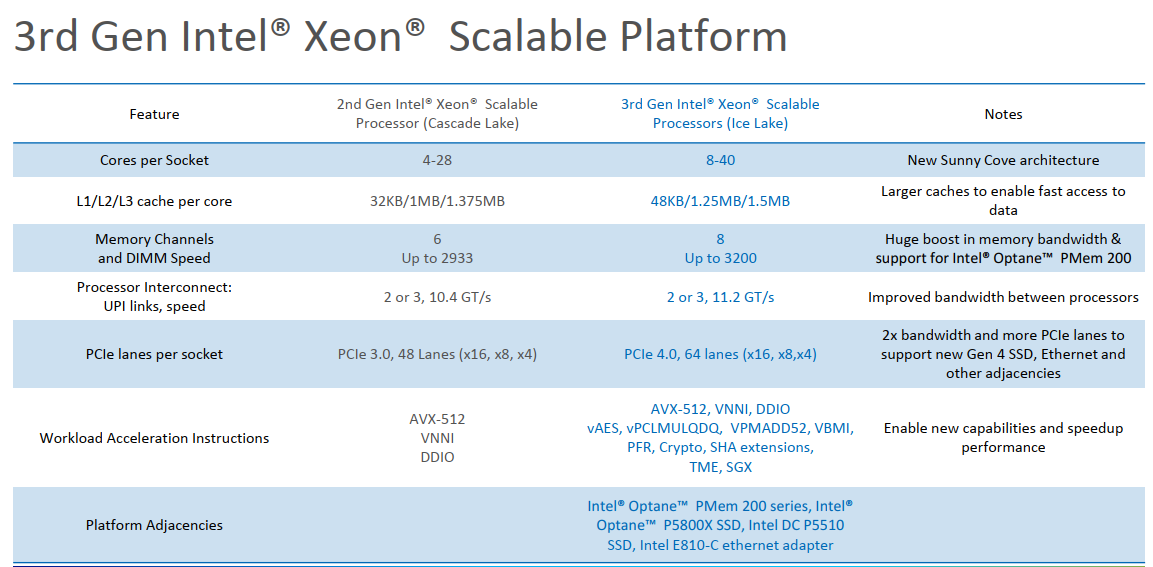
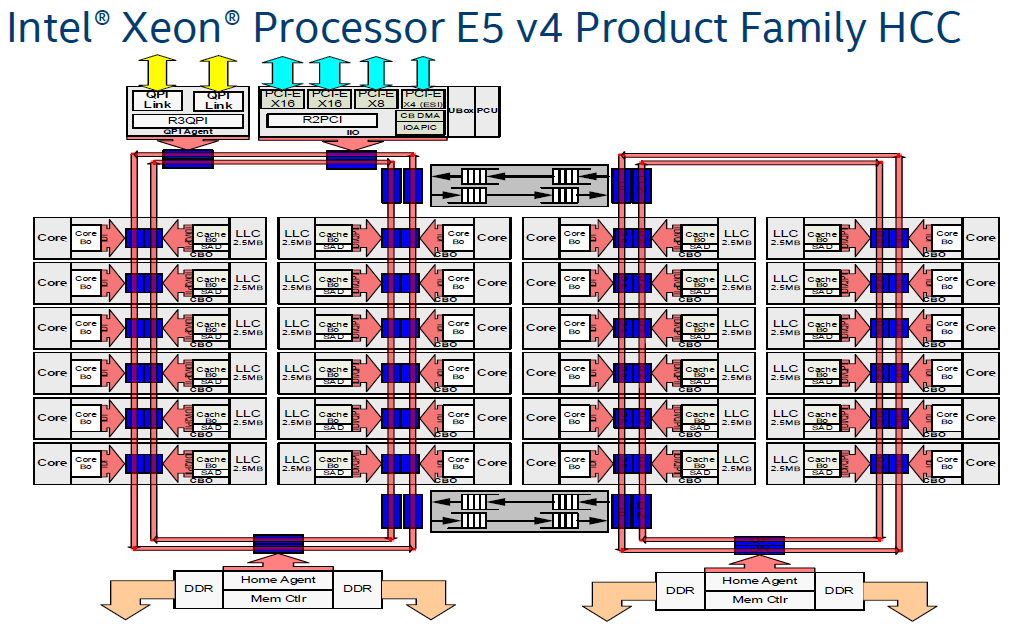
Intel xeon
不同架构带来IPC变化:
Intel 最新的CPU Ice Lake和其上一代的性能对比数据:
上图最终结果导致了IPC提升了20%,以及整体效率的提升:
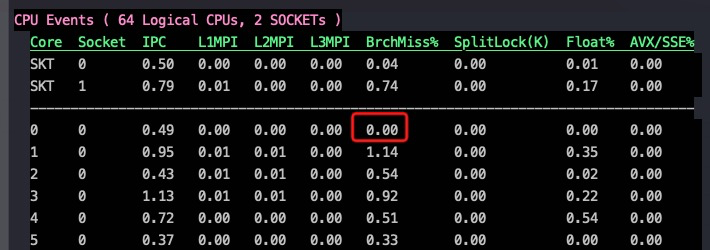
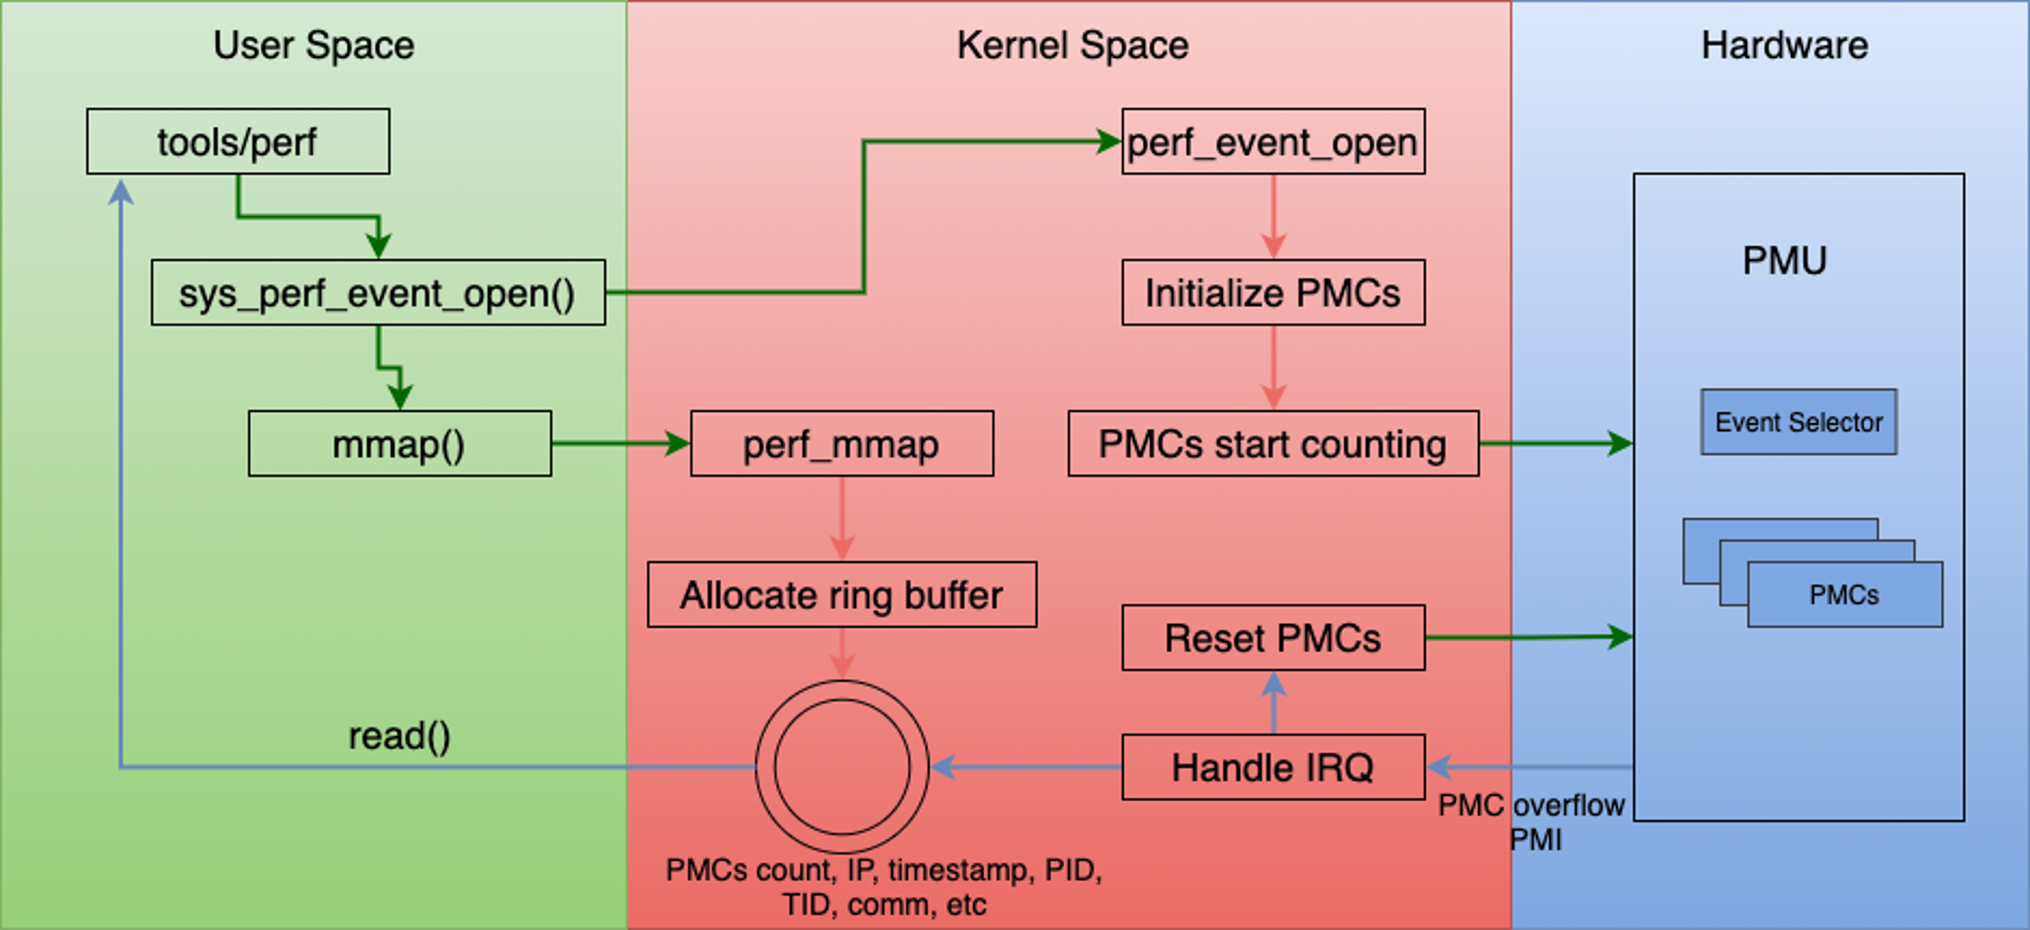
perf 使用
主要是通过采集 PMU(Performance Monitoring Unit – CPU内部提供)数据来做性能监控
Two logical cores can work through tasks more efficiently than a traditional single-threaded core. By taking advantage of idle time when the core would formerly be waiting for other tasks to complete, Intel® Hyper-Threading Technology improves CPU throughput (by up to 30% in server applications).
举个例子,如果一个线程运行过程中,必须要等到一些数据加载到缓存中以后才能继续执行,此时 CPU 就可以切换到另一个线程,去执行其他指令,而不用去处于空闲状态,等待当前线程的数据加载完毕。通常,一个传统的处理器在线程之间切换,可能需要几万个时钟周期。而一个具有 HT 超线程技术的处理器只需要 1 个时钟周期。因此就大大减小了线程之间切换的成本,从而最大限度地让处理器满负荷运转。
ARM芯片基本不做超线程,另外请思考为什么有了应用层的多线程切换还需要CPU层面的超线程?
超线程(Hyper-Threading)物理实现: 在CPU内部增加寄存器等硬件设施,但是ALU、译码器等关键单元还是共享。在一个物理 CPU 核心内部,会有双份的 PC 寄存器、指令寄存器乃至条件码寄存器。超线程的目的,是在一个线程 A 的指令,在流水线里停顿的时候,让另外一个线程去执行指令。因为这个时候,CPU 的译码器和 ALU 就空出来了,那么另外一个线程 B,就可以拿来干自己需要的事情。这个线程 B 可没有对于线程 A 里面指令的关联和依赖。
#dmidecode -t processor # dmidecode 3.0 Getting SMBIOS data from sysfs. SMBIOS 3.2.0 present. # SMBIOS implementations newer than version 3.0 are not # fully supported by this version of dmidecode.
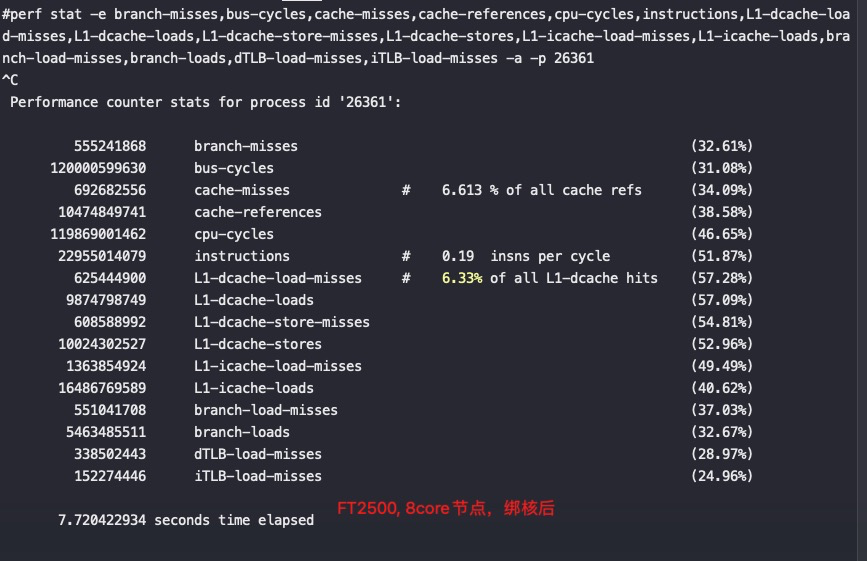
Handle 0x0004, DMI type 4, 48 bytes Processor Information Socket Designation: BGA3576 Type: Central Processor Family: <OUT OF SPEC> Manufacturer: PHYTIUM ID: 00 00 00 00 70 1F 66 22 Version: FT2500 Voltage: 0.8 V External Clock: 50 MHz Max Speed: 2100 MHz Current Speed: 2100 MHz Status: Populated, Enabled Upgrade: Other L1 Cache Handle: 0x0005 L2 Cache Handle: 0x0007 L3 Cache Handle: 0x0008 Serial Number: 1234567 Asset Tag: No Asset Tag Part Number: NULL Core Count: 64 Core Enabled: 64 Thread Count: 64 Characteristics: 64-bit capable Multi-Core Hardware Thread Execute Protection Enhanced Virtualization Power/Performance Control
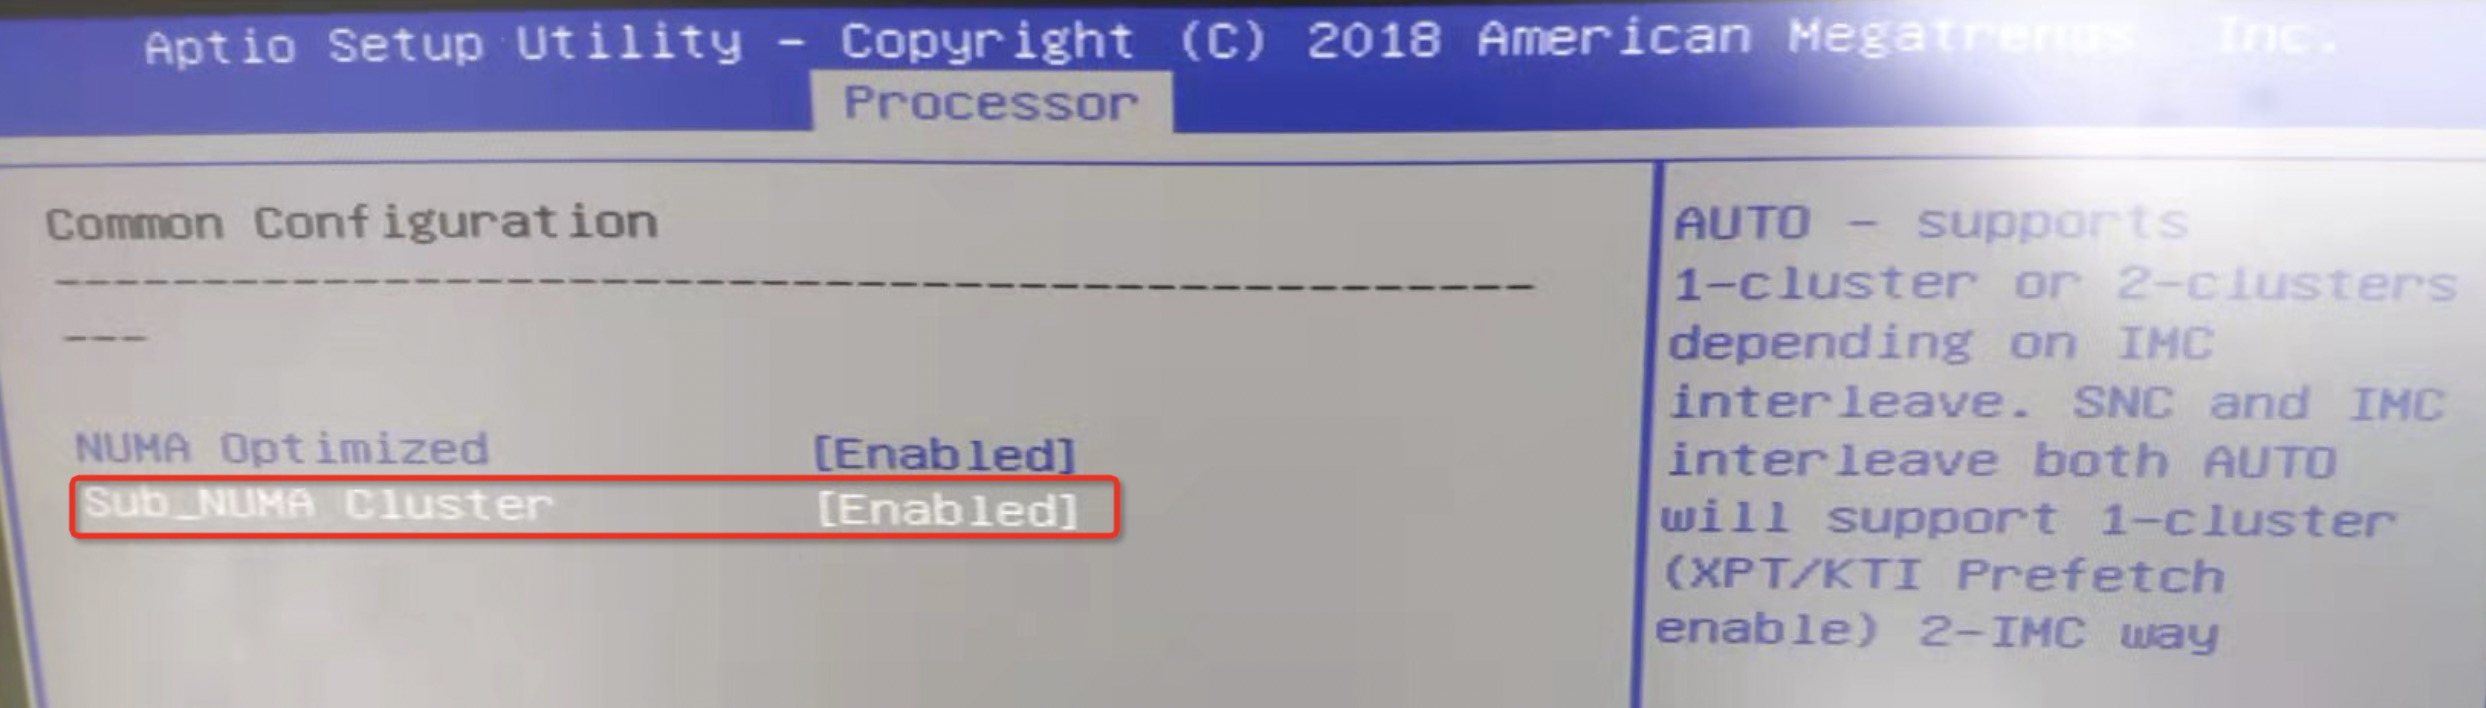
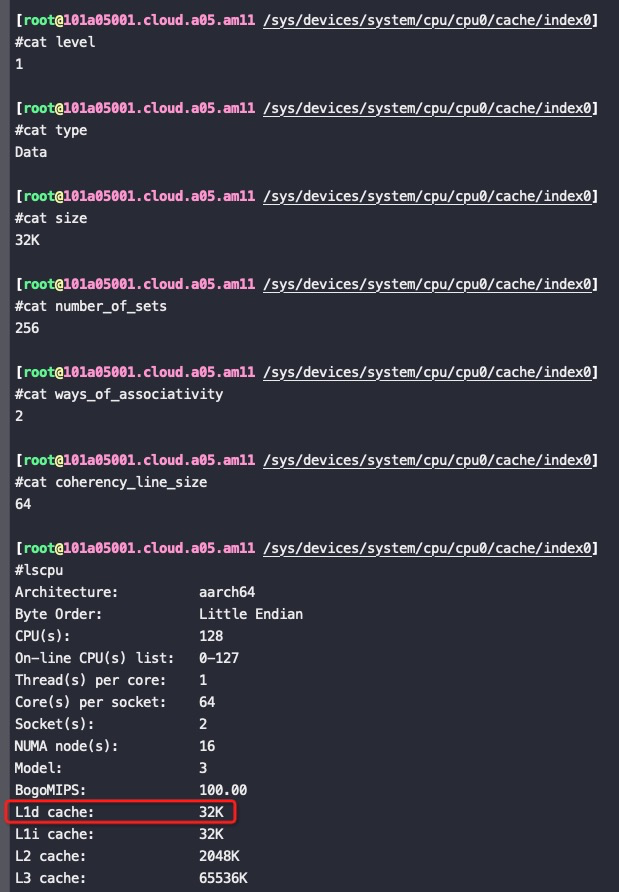
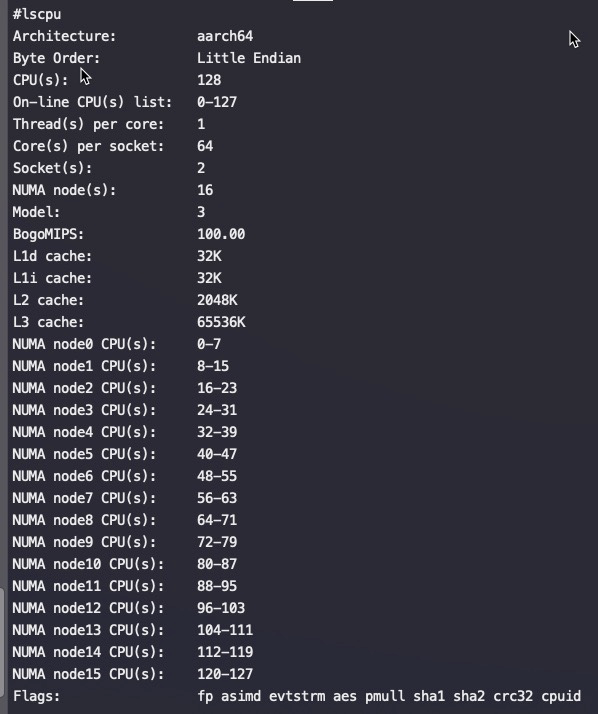
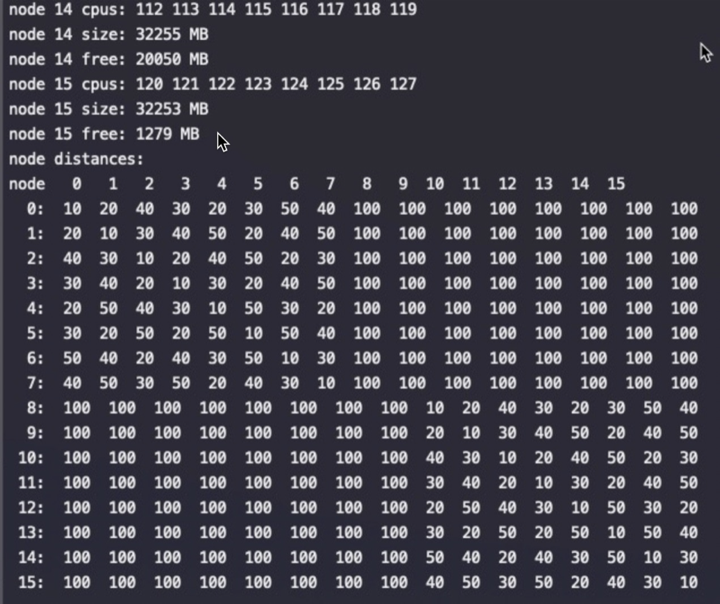
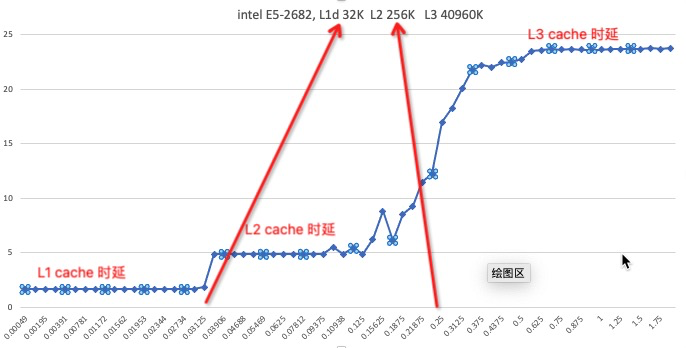
#lscpu
Architecture:          aarch64
Byte Order:            Little Endian
CPU(s):                128
On-line CPU(s) list:   0-127
Thread(s) per core:    1
Core(s) per socket:    64
Socket(s):             2
NUMA node(s):          16
Model:                 3
BogoMIPS:              100.00
L1d cache:             32K
L1i cache:             32K
L2 cache:              2048K
L3 cache:              65536K
NUMA node0 CPU(s):     0-7
NUMA node1 CPU(s):     8-15
NUMA node2 CPU(s):     16-23
NUMA node3 CPU(s):     24-31
NUMA node4 CPU(s):     32-39
NUMA node5 CPU(s):     40-47
NUMA node6 CPU(s):     48-55
NUMA node7 CPU(s):     56-63
NUMA node8 CPU(s):     64-71
NUMA node9 CPU(s):     72-79
NUMA node10 CPU(s):    80-87
NUMA node11 CPU(s):    88-95
NUMA node12 CPU(s):    96-103
NUMA node13 CPU(s):    104-111
NUMA node14 CPU(s):    112-119
NUMA node15 CPU(s):    120-127
Flags:                 fp asimd evtstrm aes pmull sha1 sha2 crc32 cpuid
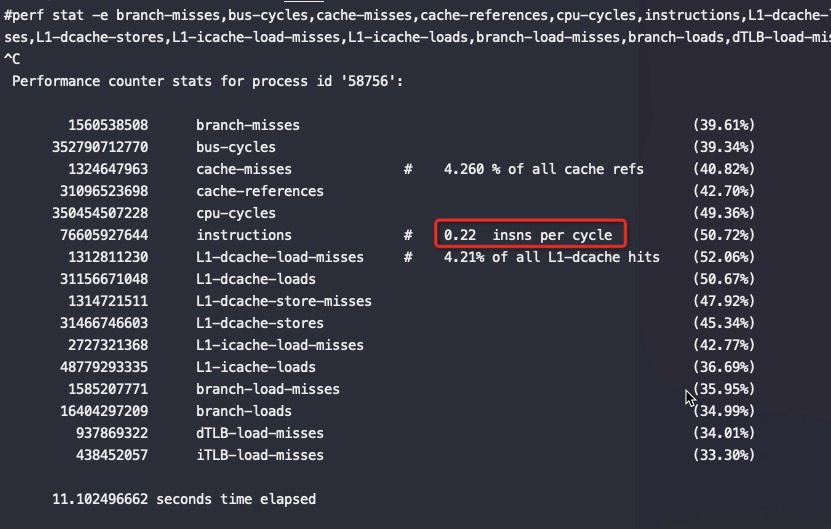
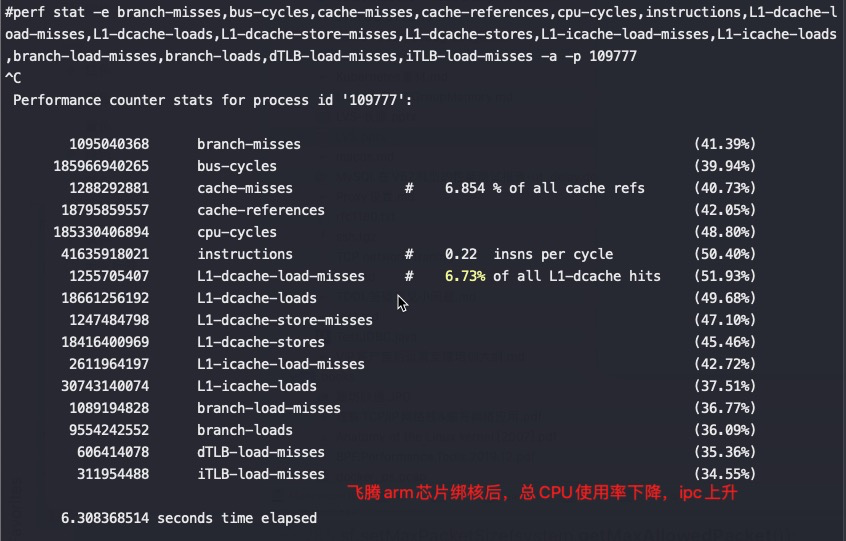
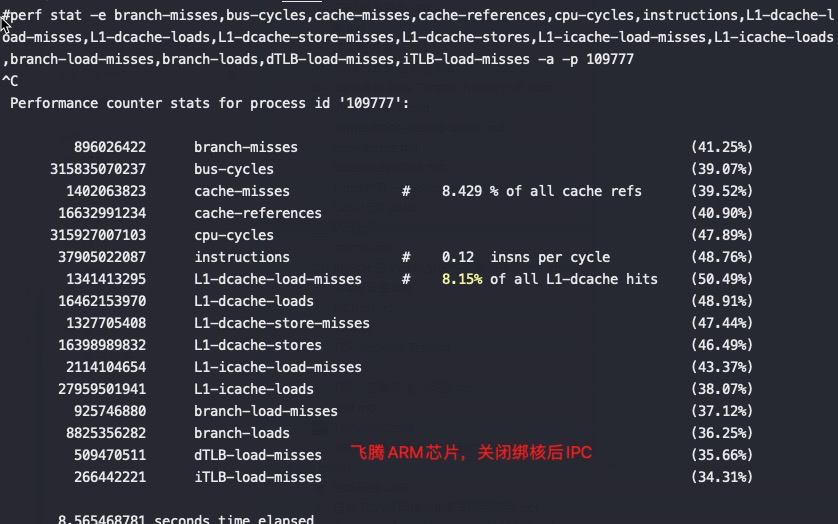
#perf stat -e branch-misses,bus-cycles,cache-misses,cache-references,cpu-cycles,instructions,L1-dcache-load-misses,L1-dcache-loads,L1-dcache-store-misses,L1-dcache-stores,L1-icache-load-misses,L1-icache-loads,branch-load-misses,branch-loads,dTLB-load-misses,iTLB-load-misses -a -p 79694 ^C Performance counter stats for process id '79694':
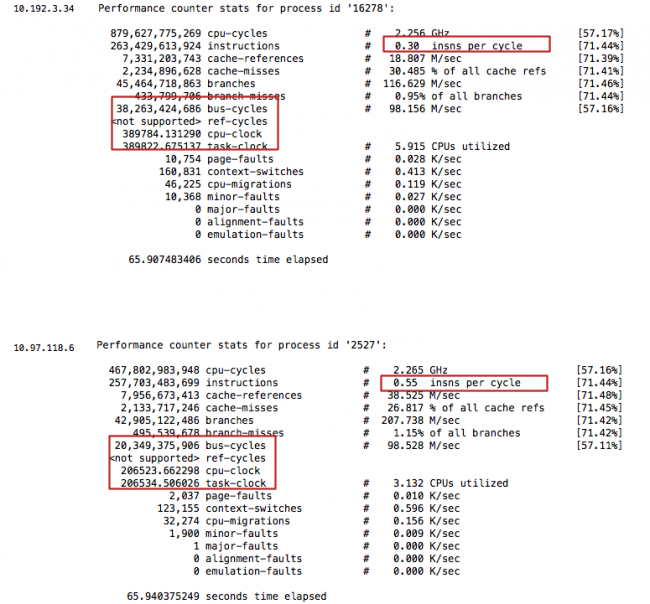
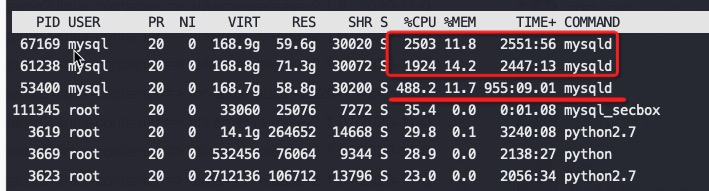
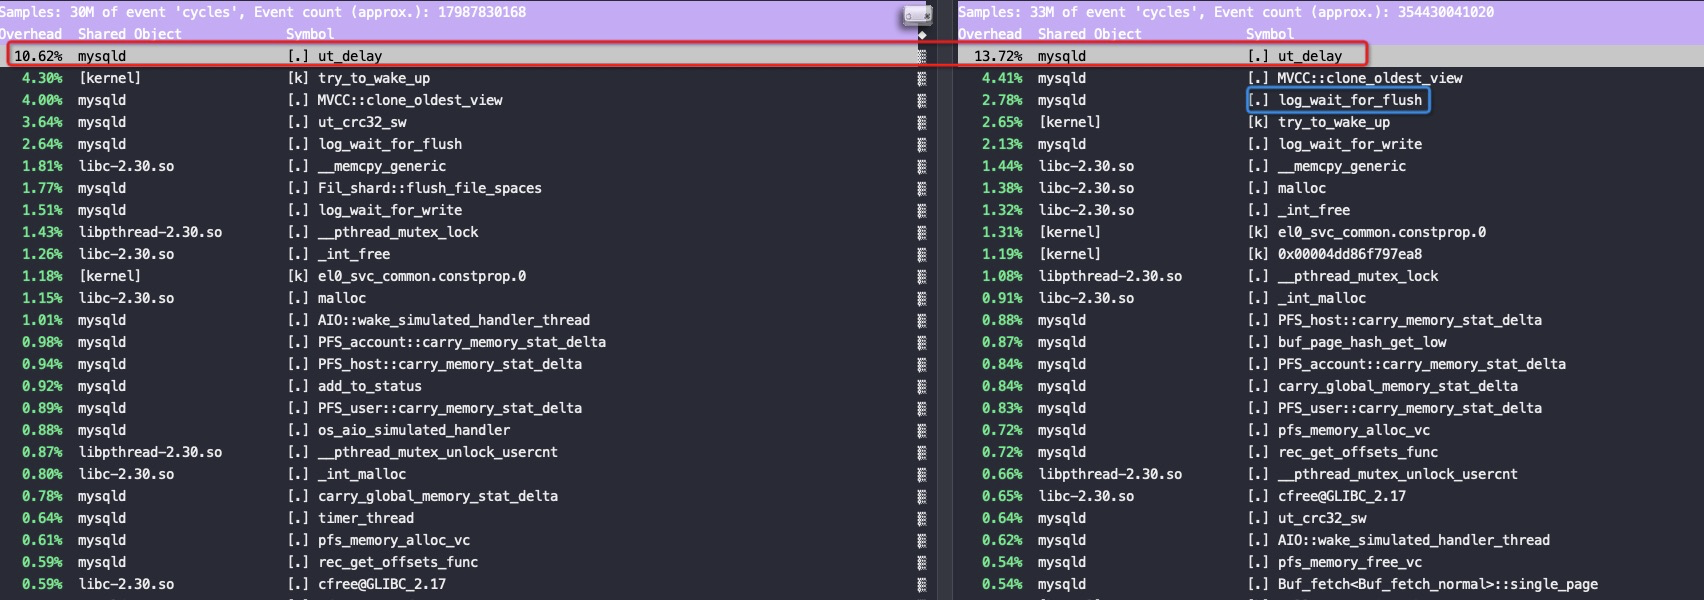
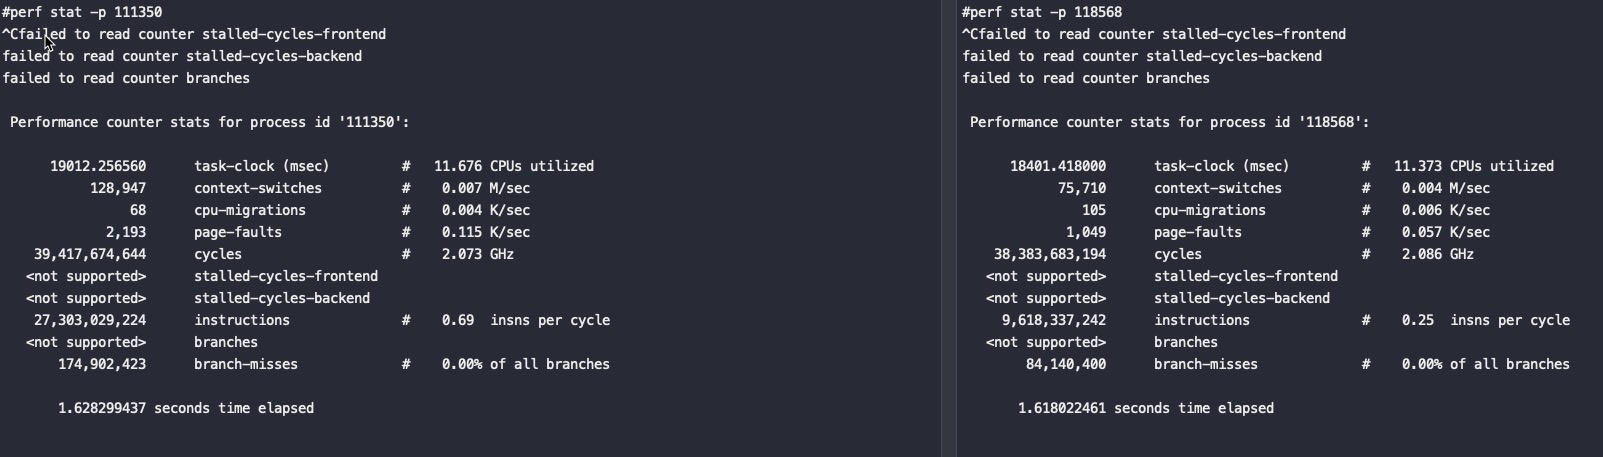
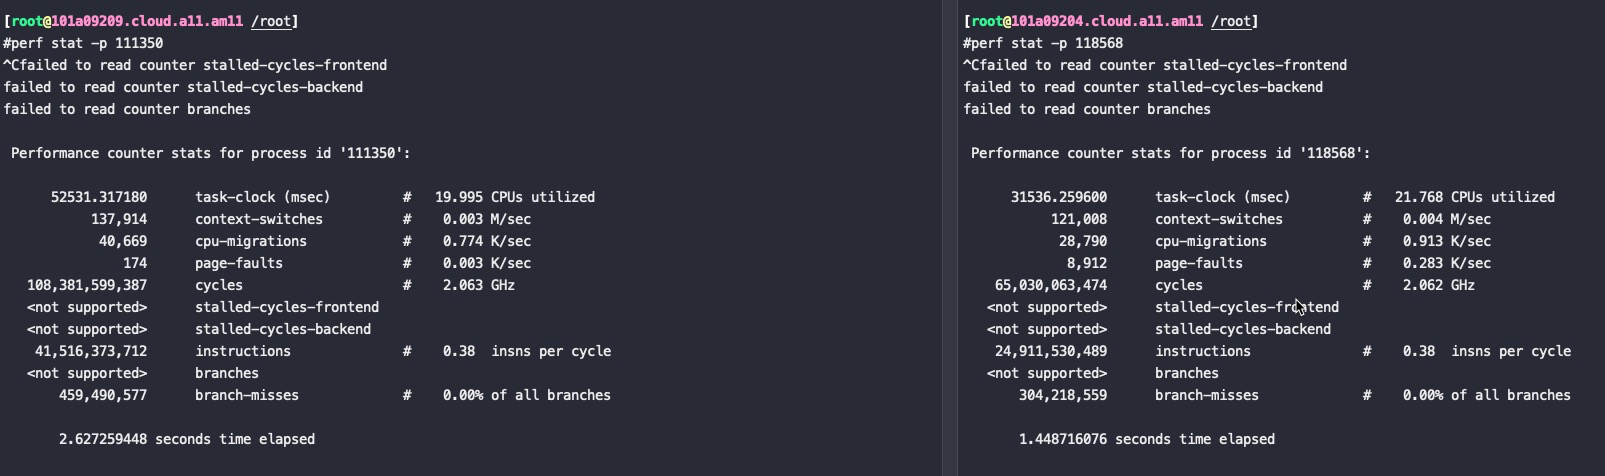
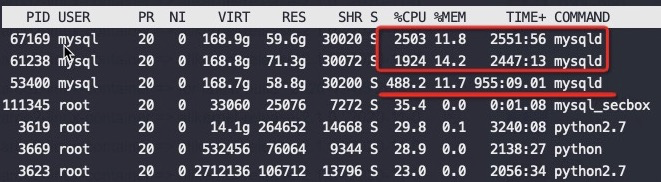
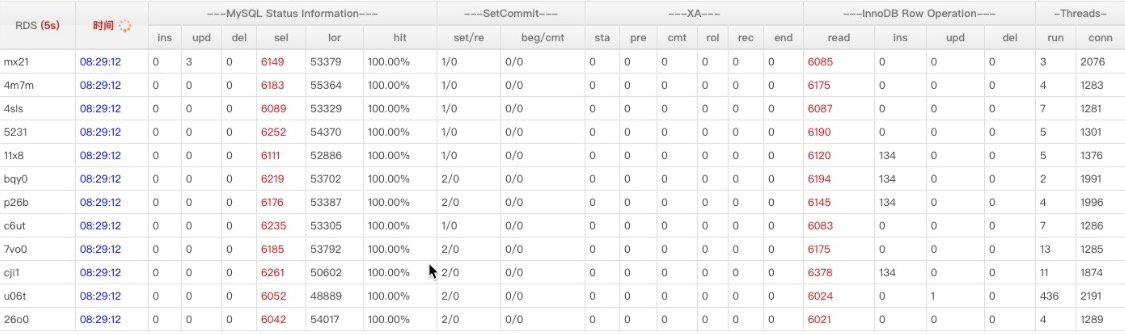
#第二个MySQL IPC只有第三个的30%多点,这就是为什么CPU高这么多,但是QPS差不多 perf stat -e branch-misses,bus-cycles,cache-misses,cache-references,cpu-cycles,instructions,L1-dcache-load-misses,L1-dcache-loads,L1-dcache-store-misses,L1-dcache-stores,L1-icache-load-misses,L1-icache-loads,branch-load-misses,branch-loads,dTLB-load-misses,iTLB-load-misses -a -p 61238 ^C Performance counter stats for process id '61238':
1.163750756 seconds time elapsed #第三个MySQL perf stat -e branch-misses,bus-cycles,cache-misses,cache-references,cpu-cycles,instructions,L1-dcache-load-misses,L1-dcache-loads,L1-dcache-store-misses,L1-dcache-stores,L1-icache-load-misses,L1-icache-loads,branch-load-misses,branch-loads,dTLB-load-misses,iTLB-load-misses -a -p 53400 ^C Performance counter stats for process id '53400':
#第二个 MySQL IPC只有第三个的30%多点,这就是为什么CPU高这么多,但是QPS差不多 perf stat -e branch-misses,bus-cycles,cache-misses,cache-references,cpu-cycles,instructions,L1-dcache-load-misses,L1-dcache-loads,L1-dcache-store-misses,L1-dcache-stores,L1-icache-load-misses,L1-icache-loads,branch-load-misses,branch-loads,dTLB-load-misses,iTLB-load-misses -a -p 61238 ^C Performance counter stats for process id '61238':
#第三个 MySQL perf stat -e branch-misses,bus-cycles,cache-misses,cache-references,cpu-cycles,instructions,L1-dcache-load-misses,L1-dcache-loads,L1-dcache-store-misses,L1-dcache-stores,L1-icache-load-misses,L1-icache-loads,branch-load-misses,branch-loads,dTLB-load-misses,iTLB-load-misses -a -p 53400 ^C Performance counter stats for process id '53400':
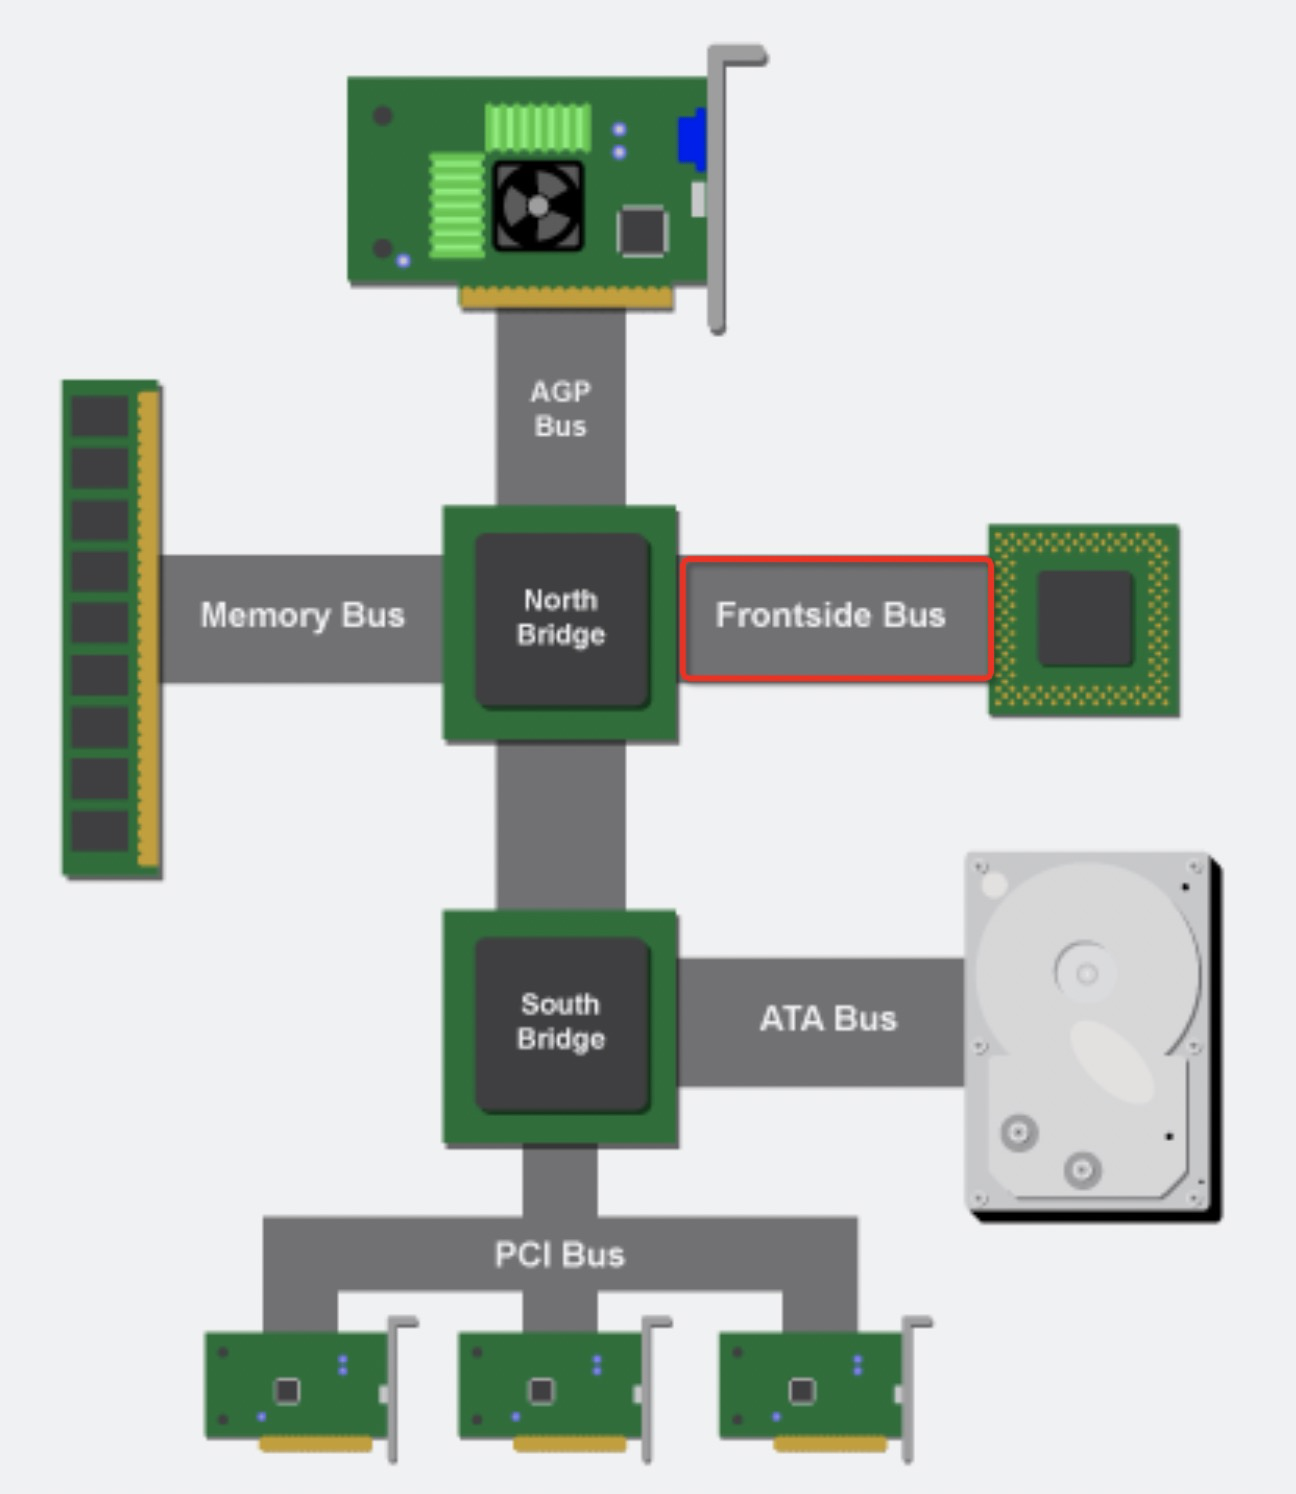
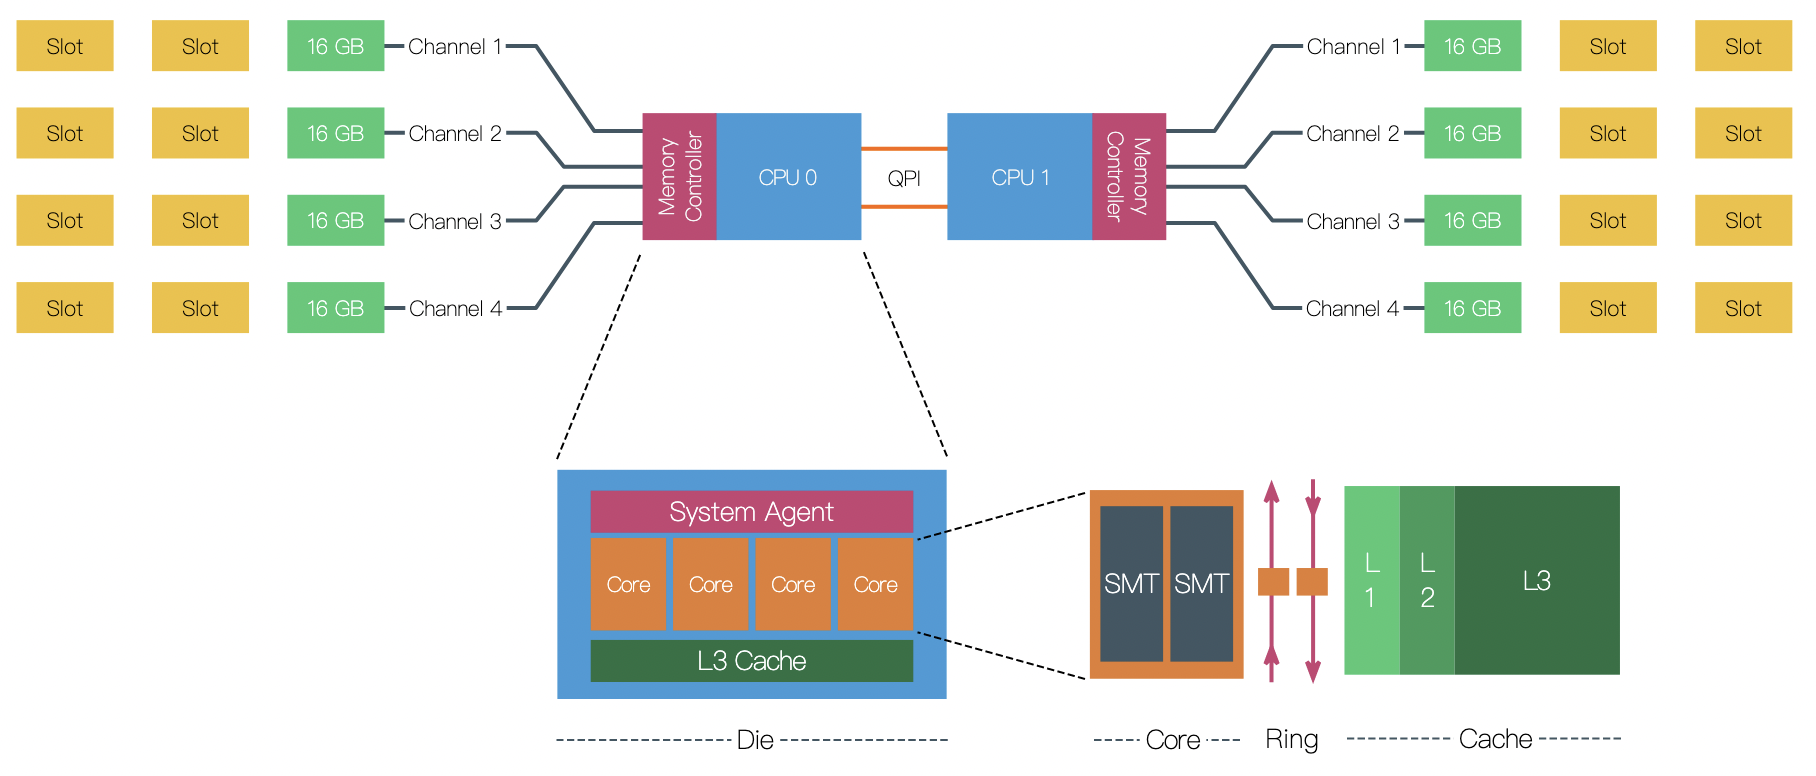
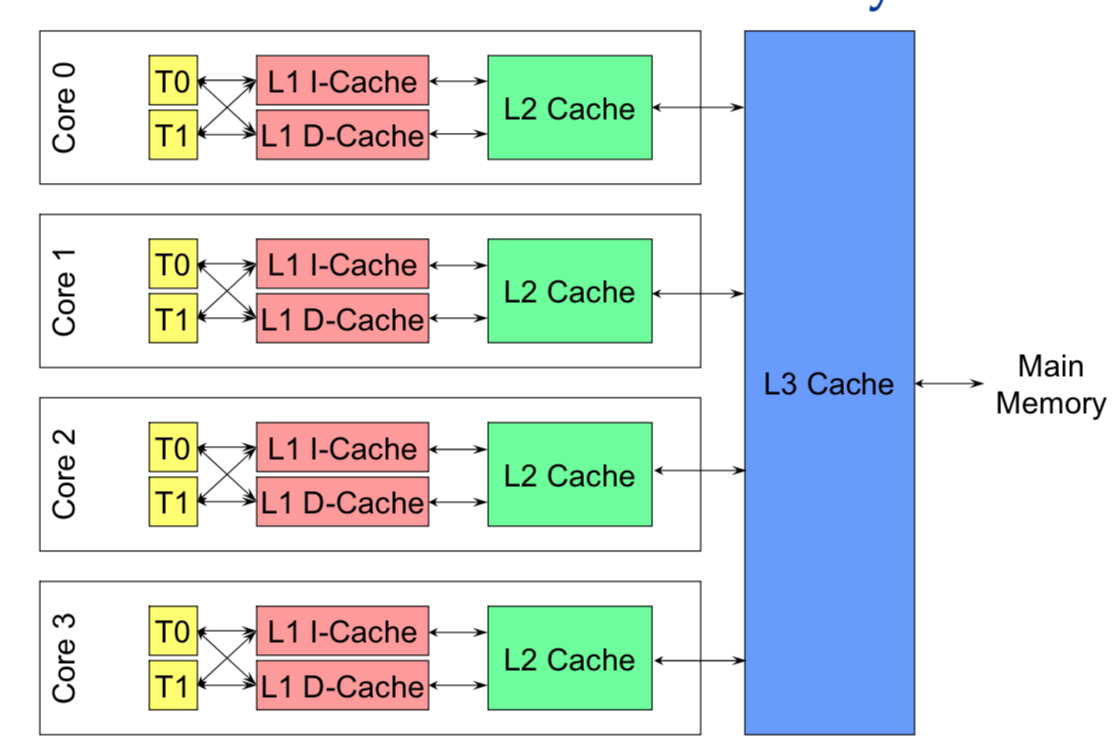
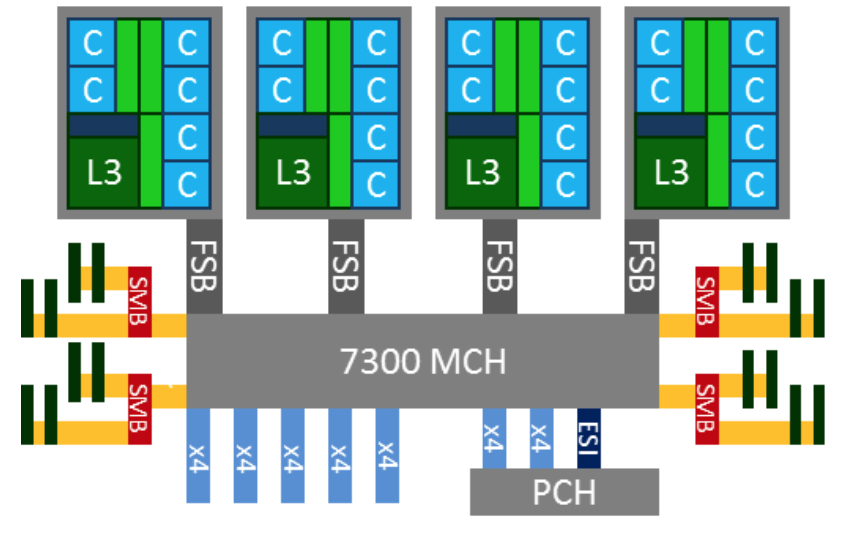
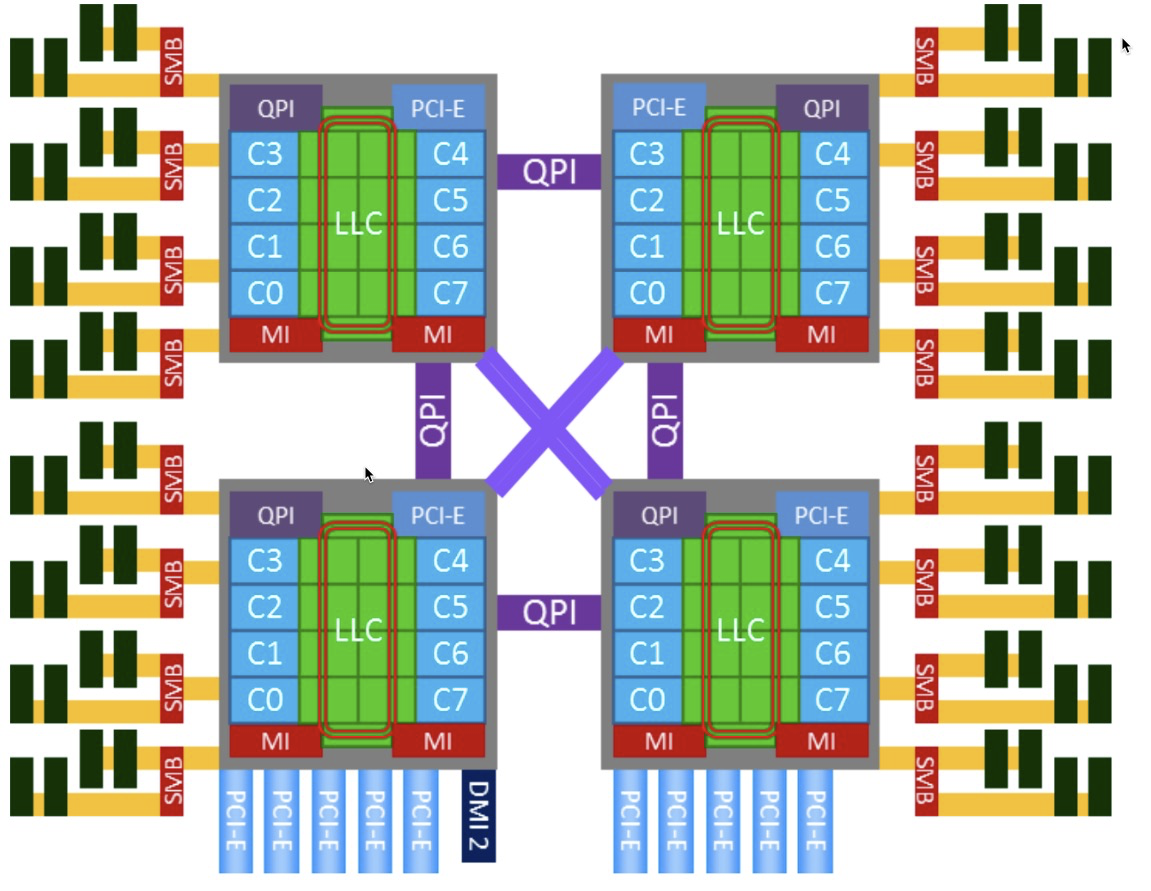
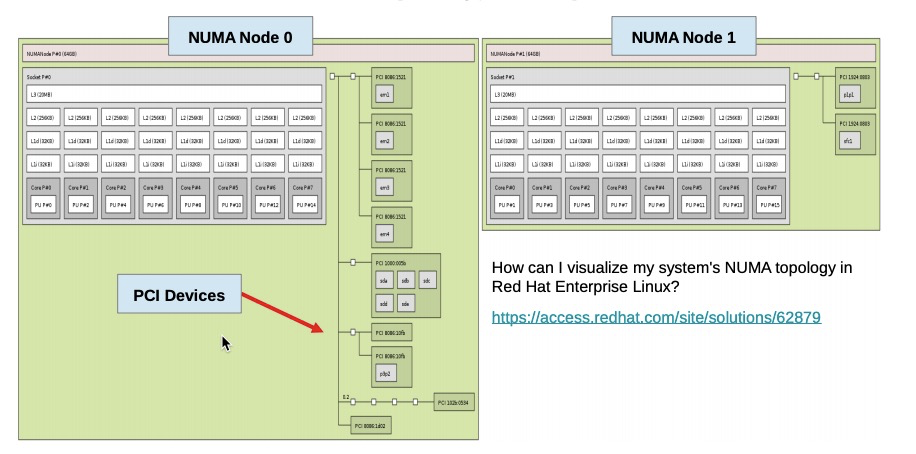
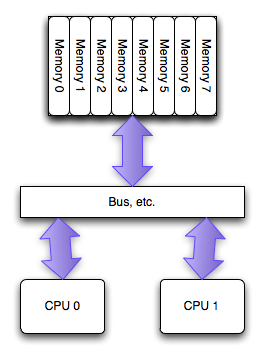
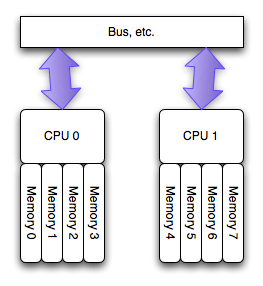
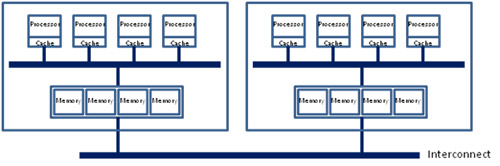
Modern multiprocessor systems mix these basic architectures as seen in the following diagram:
In this complex hierarchical scheme, processors are grouped by their physical location on one or the other multi-core CPU package or “node.” Processors within a node share access to memory modules as per the UMA shared memory architecture. At the same time, they may also access memory from the remote node using a shared interconnect, but with slower performance as per the NUMA shared memory architecture.
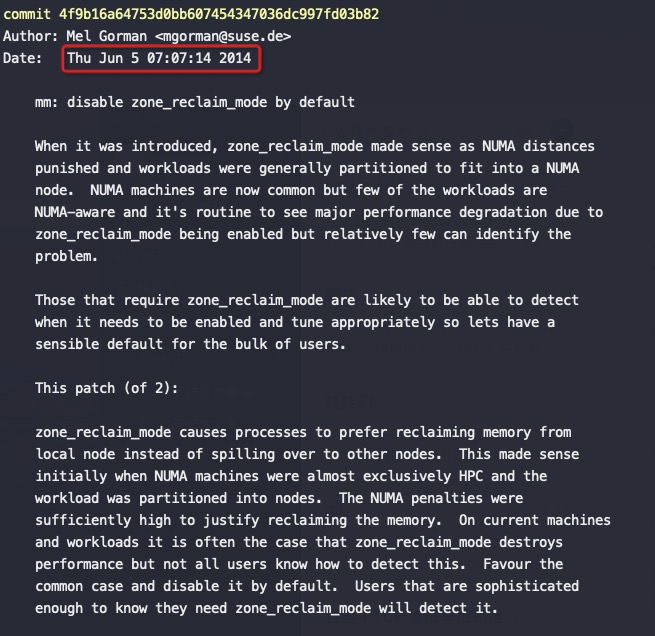
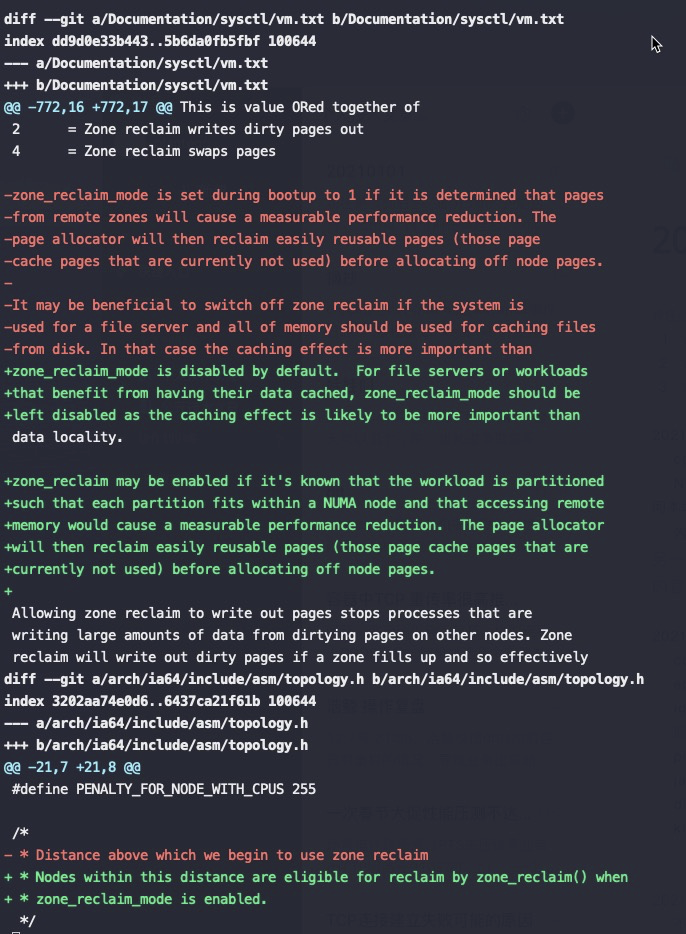
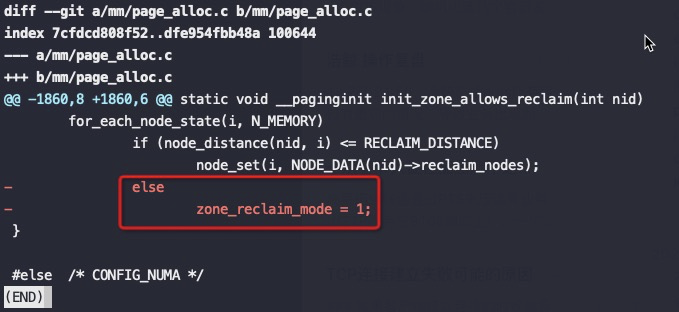
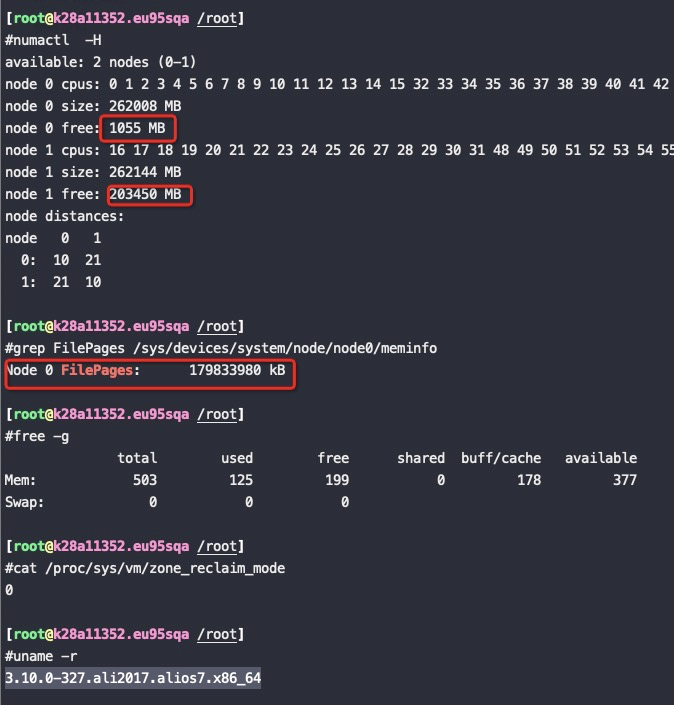
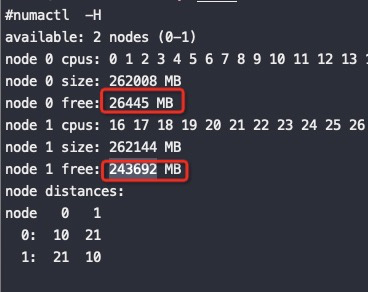
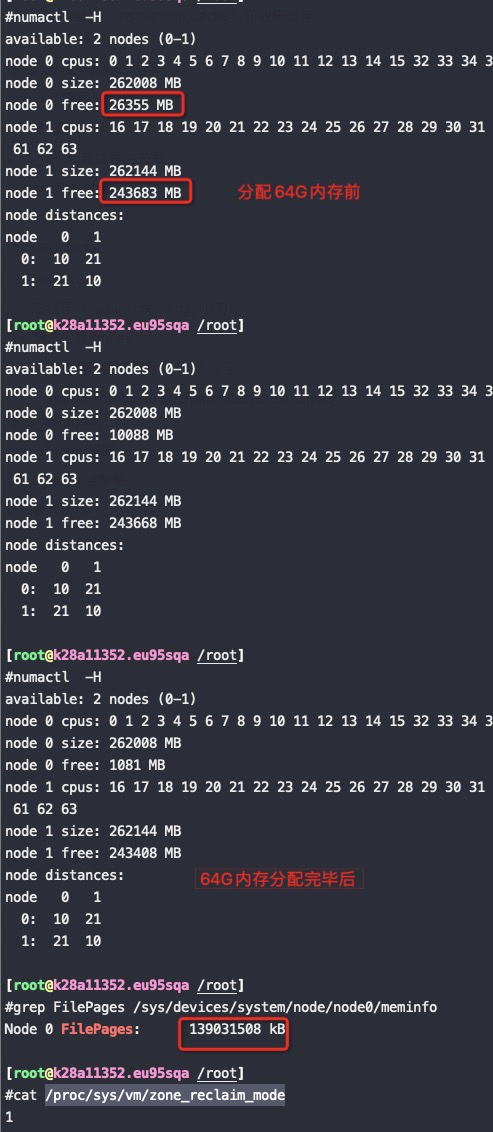
Zone_reclaim_mode allows someone to set more or less aggressive approaches to reclaim memory when a zone runs out of memory. If it is set to zero then no zone reclaim occurs. Allocations will be satisfied from other zones / nodes in the system.
zone_reclaim_mode的四个参数值的意义分别是:
0 = Allocate from all nodes before reclaiming memory 1 = Reclaim memory from local node vs allocating from next node 2 = Zone reclaim writes dirty pages out 4 = Zone reclaim swaps pages
Automatic NUMA balancing improves the performance of applications running on NUMA hardware systems. It is enabled by default on Red Hat Enterprise Linux 7 systems.
An application will generally perform best when the threads of its processes are accessing memory on the same NUMA node as the threads are scheduled. Automatic NUMA balancing moves tasks (which can be threads or processes) closer to the memory they are accessing. It also moves application data to memory closer to the tasks that reference it. This is all done automatically by the kernel when automatic NUMA balancing is active.
#perf stat -e sched:sched_stick_numa,sched:sched_move_numa,sched:sched_swap_numa,migrate:mm_migrate_pages,minor-faults -p 7191 Performance counter stats for process id '7191':
0 sched:sched_stick_numa (100.00%) 1 sched:sched_move_numa (100.00%) 0 sched:sched_swap_numa 0 migrate:mm_migrate_pages 286 minor-faults # perf stat -e sched:sched_stick_numa,sched:sched_move_numa,sched:sched_swap_numa,migrate:mm_migrate_pages,minor-faults -p PID ... 1 sched:sched_stick_numa 3 sched:sched_move_numa 41 sched:sched_swap_numa 5,239 migrate:mm_migrate_pages 50,161 minor-faults #perf stat -e sched:sched_stick_numa,sched:sched_move_numa,sched:sched_swap_numa,migrate:mm_migrate_pages,minor-faults -p 676322 Performance counter stats for process id '676322':
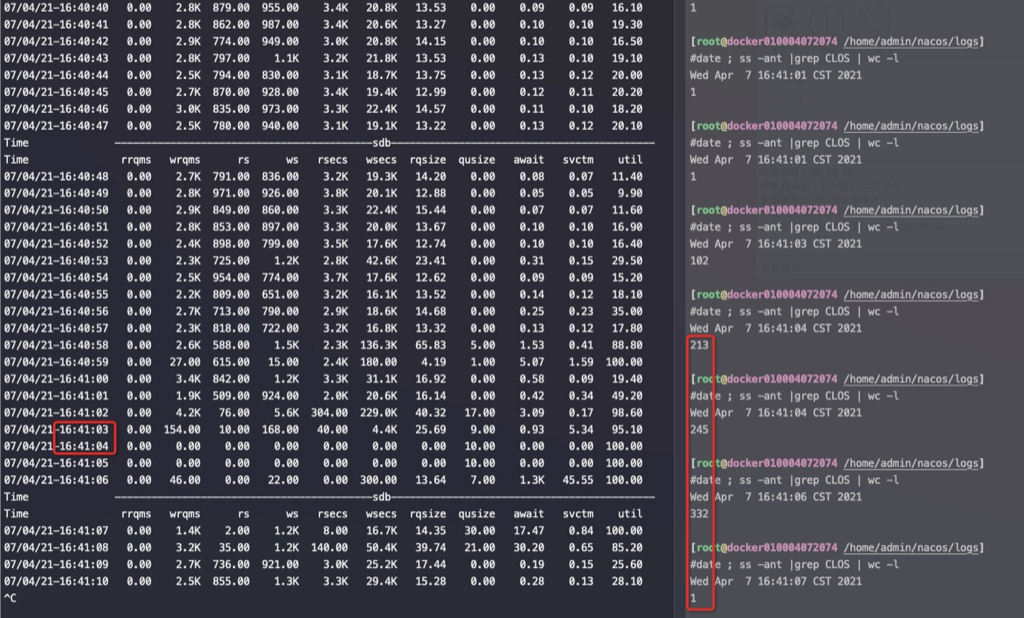
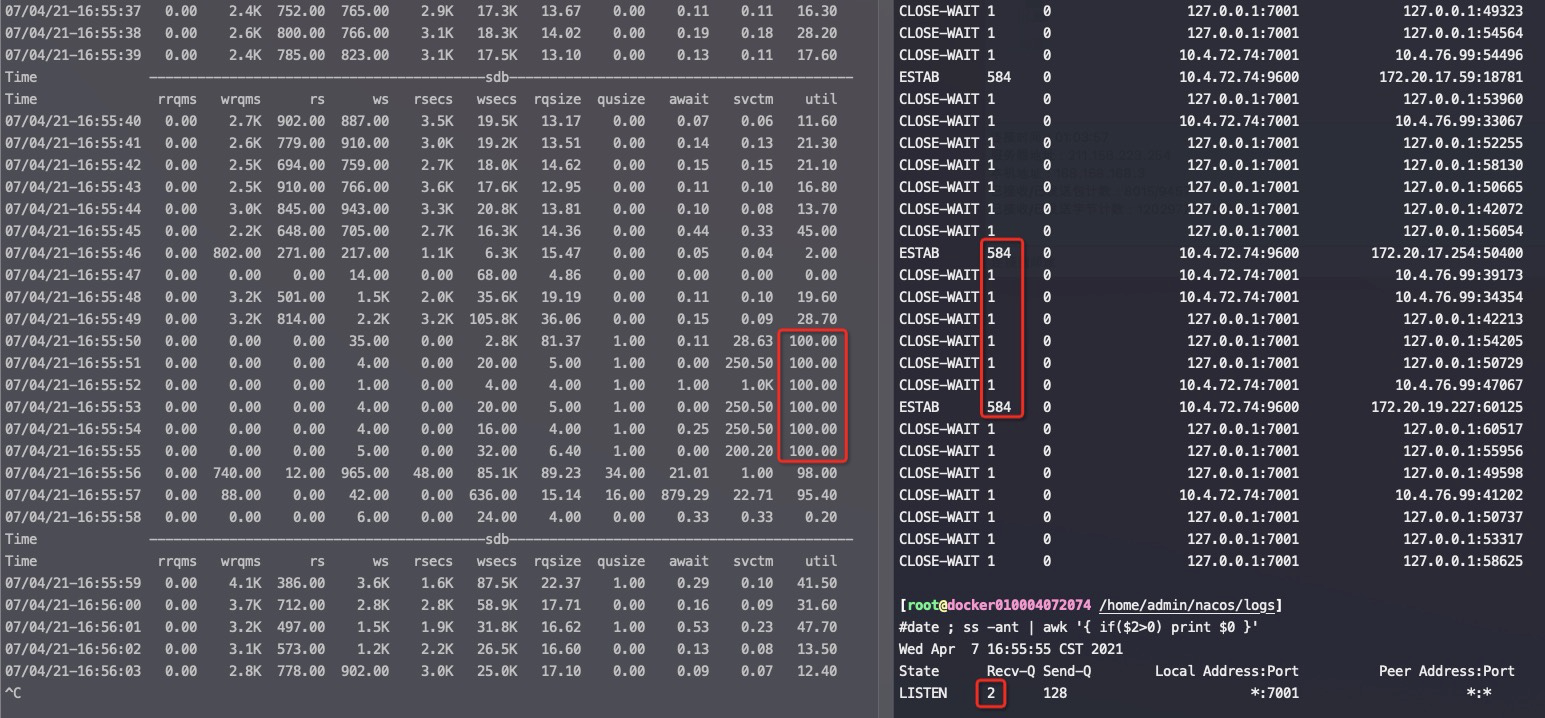
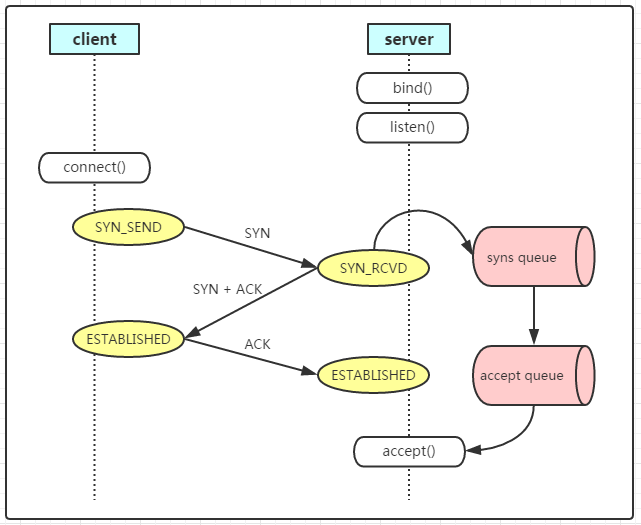
答: 能,这个时候在client和server两边看到的连接状态都是 ESTABLISHED,只是Server上的全连接队列占用加1。连接握手并切换到ESTABLISHED状态都是由OS来负责的,应用不参与,ESTABLISHED后应用才能accept,进而收发数据。也就是能放入到全连接队列里面的连接肯定都是 ESTABLISHED 状态的了
接着上面的问题,如果新连接继续连接进而全连接队列满了呢?
答:那就连不上了,server端的OS因为全连接队列满了直接扔掉第一个syn握手包,这个时候连接在client端是SYN_SENT,Server端没有这个连接,这是因为syn到server端就直接被OS drop 了。
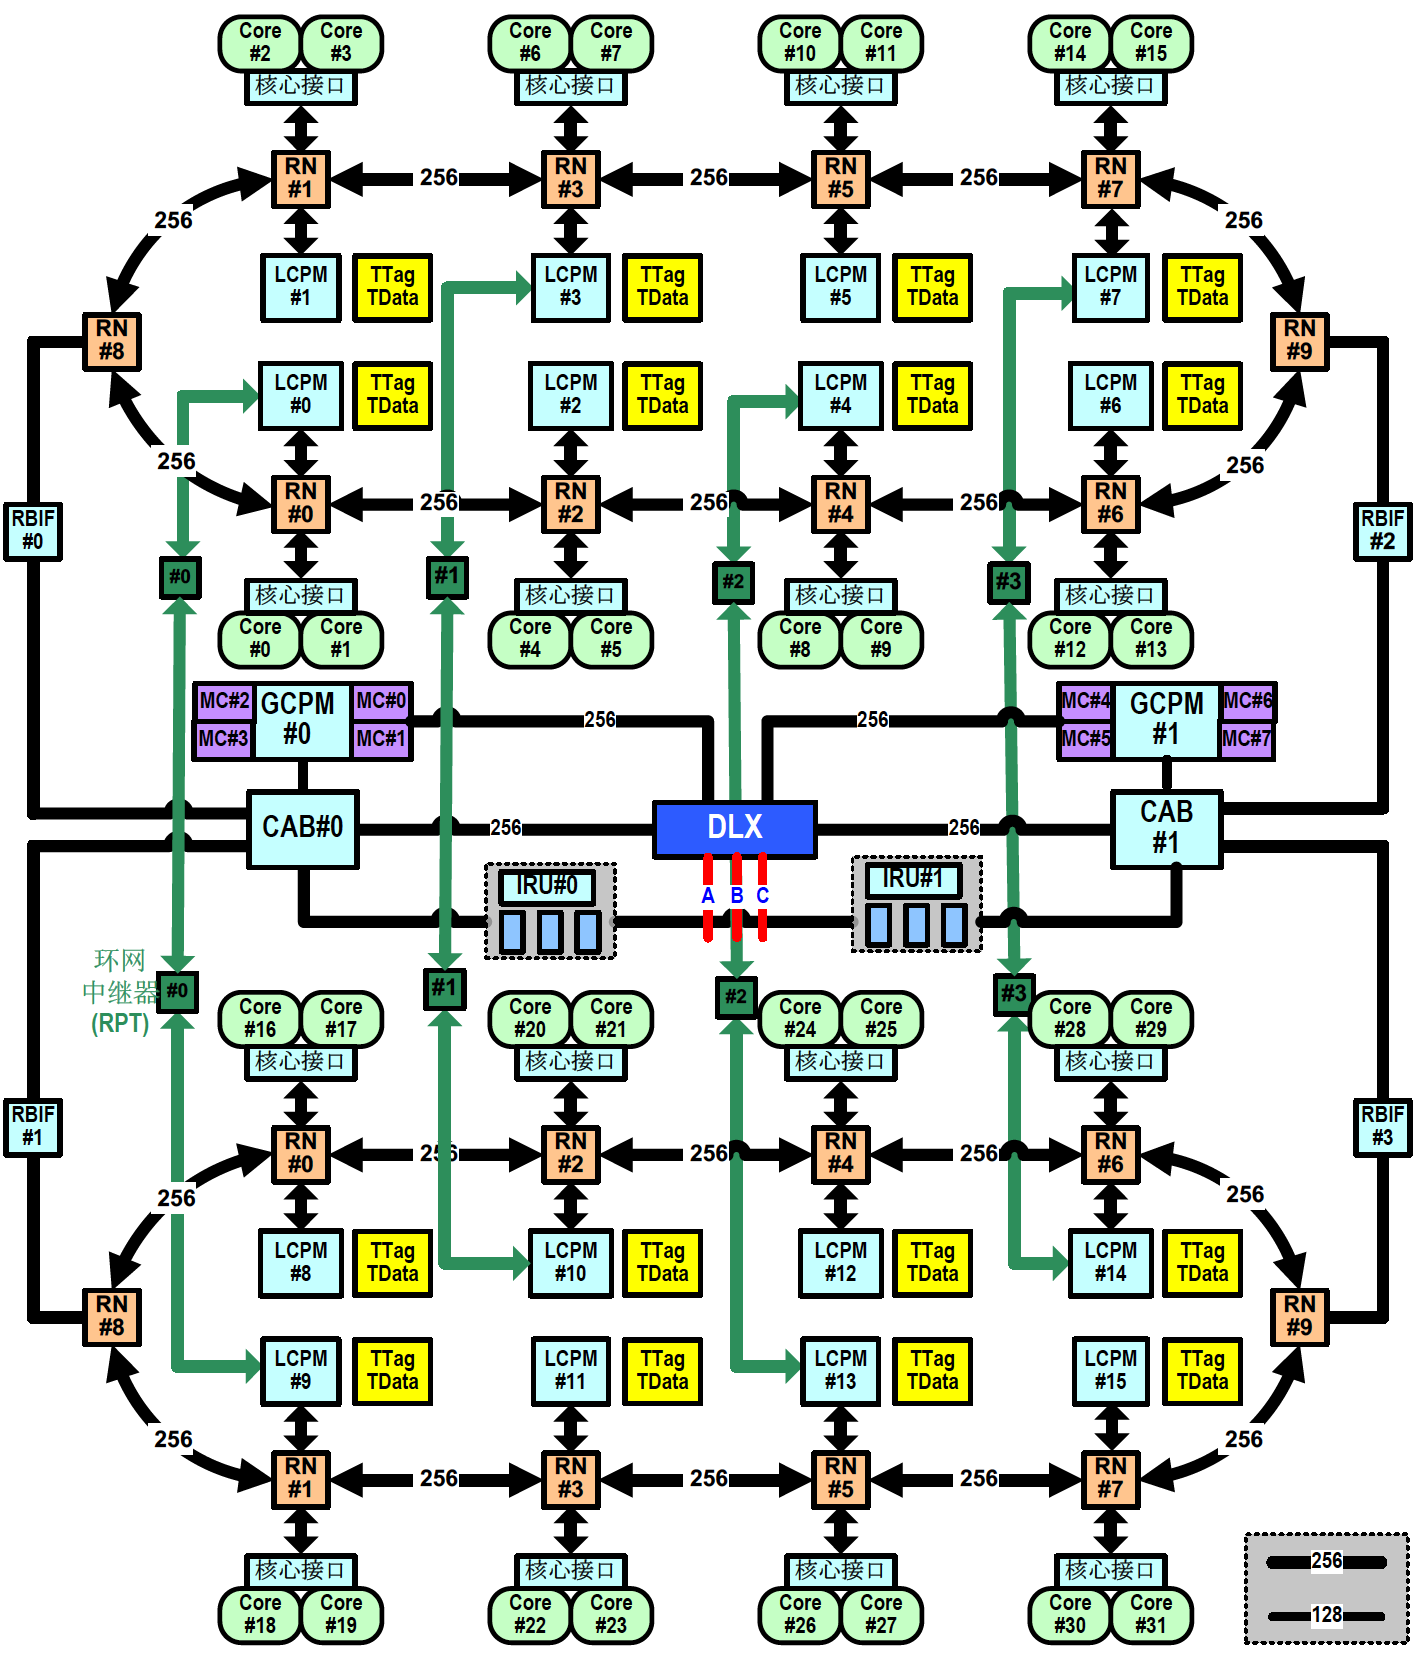
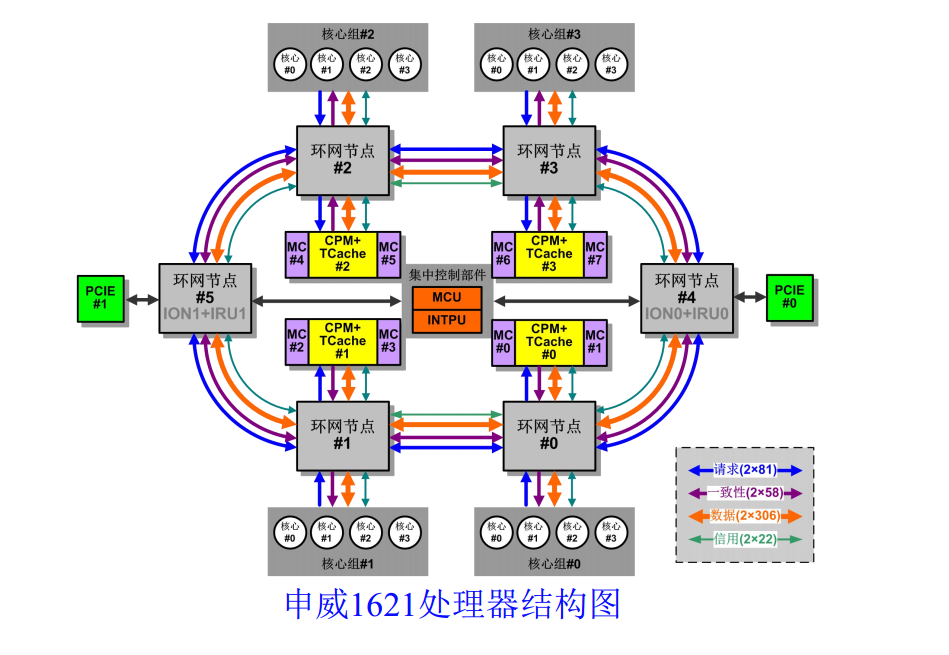 申威1621采用对称多核结构和SoC技术,单芯片集成了16个64位RISC结构的申威处理器核心,目标设计主频为2GHz。芯片还集成八路DDR3存储控制器和双路PCI-E3.0标准I/O接口。