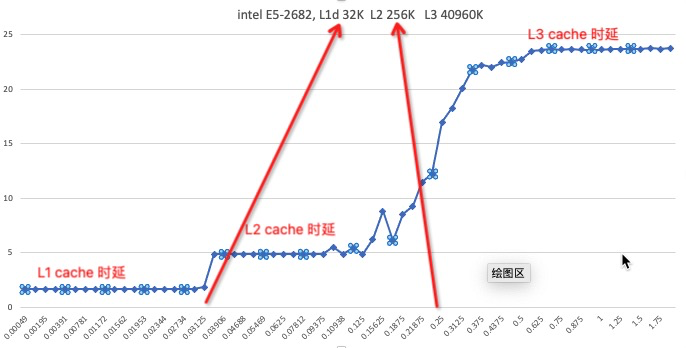
Cache Line 是 CPU 和主存之间数据传输的最小单位。当一行 Cache Line 被从内存拷贝到 Cache 里,Cache 里会为这个 Cache Line 创建一个条目。这个 Cache 条目里既包含了拷贝的内存数据,即 Cache Line,又包含了这行数据在内存里的位置等元数据信息。
处理器都实现了 Cache 一致性 (Cache Coherence)协议。如历史上 x86 曾实现了 MESI 协议,以及 MESIF 协议。
假设两个处理器 A 和 B, 都在各自本地 Cache Line 里有同一个变量的拷贝时,此时该 Cache Line 处于 Shared 状态。当处理器 A 在本地修改了变量,除去把本地变量所属的 Cache Line 置为 Modified 状态以外,还必须在另一个处理器 B 读同一个变量前,对该变量所在的 B 处理器本地 Cache Line 发起 Invaidate 操作,标记 B 处理器的那条 Cache Line 为 Invalidate 状态。随后,若处理器 B 在对变量做读写操作时,如果遇到这个标记为 Invalidate 的状态的 Cache Line,即会引发 Cache Miss,从而将内存中最新的数据拷贝到 Cache Line 里,然后处理器 B 再对此 Cache Line 对变量做读写操作。
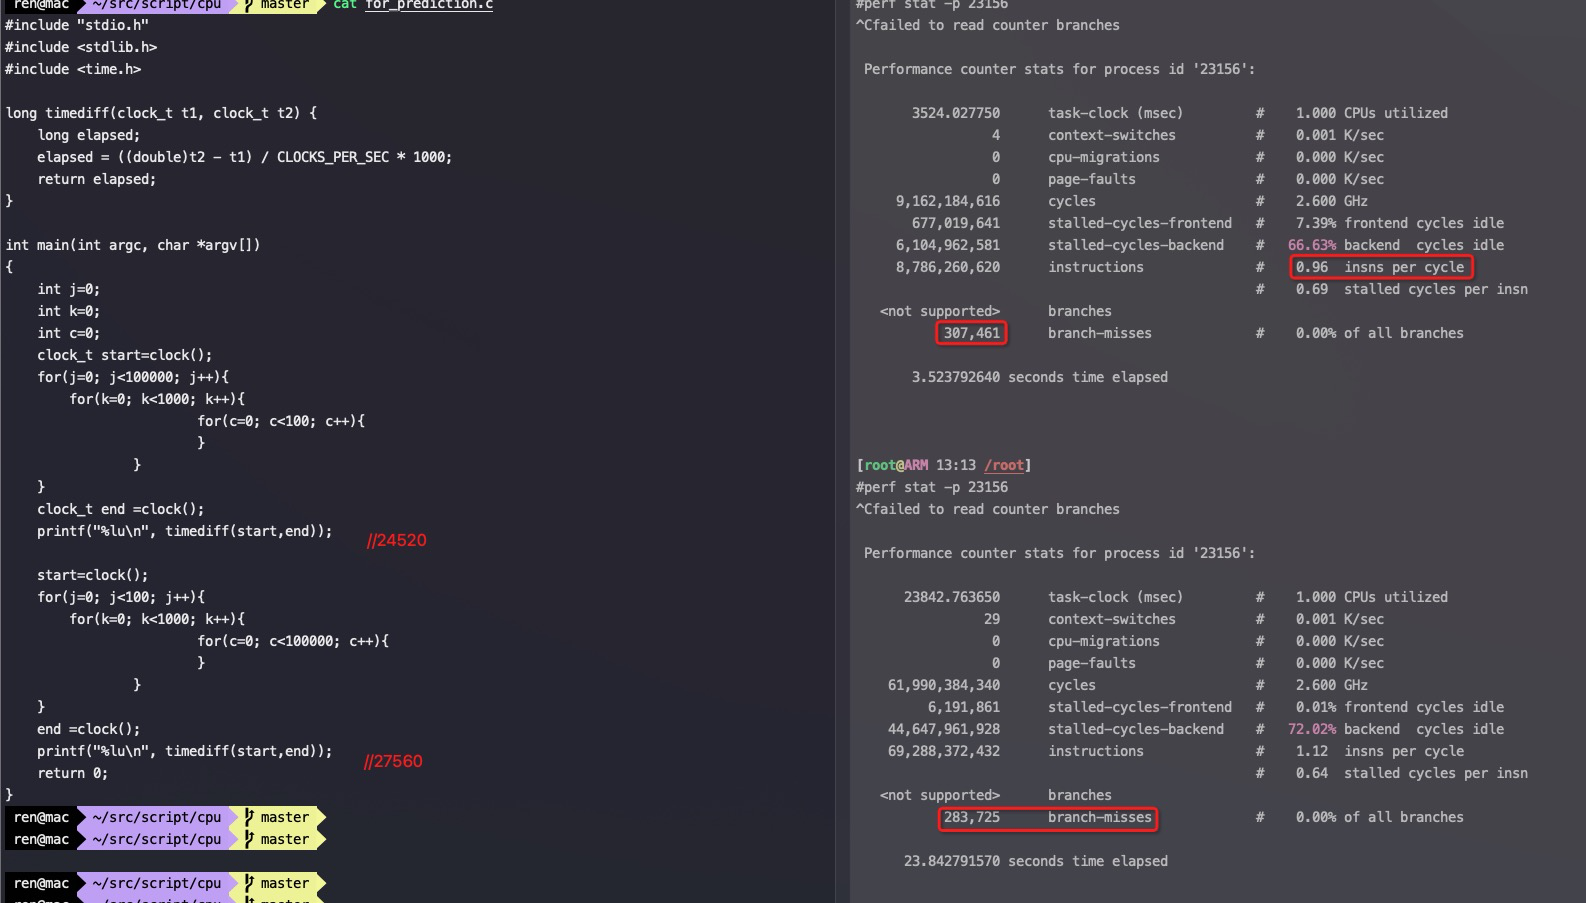
long timediff(clock_t t1, clock_t t2) { long elapsed; elapsed = ((double)t2 - t1) / CLOCKS_PER_SEC * 1000; return elapsed; }
int main(int argc, char *argv[]) { long length=64*1024*1024; int* arr=malloc(64*1024*1024 * sizeof(int)); long i=0; long j=0; for (i = 0; i < length; i++) arr[i] = i;
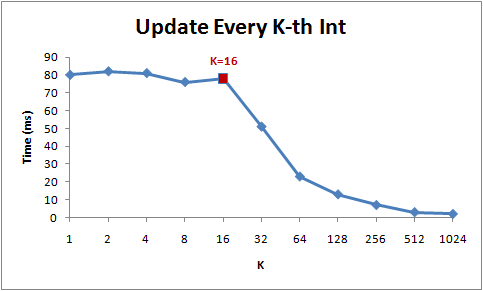
clock_t start=clock(); // 循环1 for(j=0; j<10; j++){ for (i = 0; i < length; i++) arr[i] *= 3; //每取一次arr[i], 通过cache_line顺便把后面15个arr[i]都取过来了 } clock_t end =clock(); printf("%lu\n", timediff(start,end));
start=clock(); // 循环2 for(j=0; j<10; j++){ for (i = 0; i < length; i += 16) arr[i] *= 3; } end =clock(); printf("%lu\n", timediff(start,end)); }
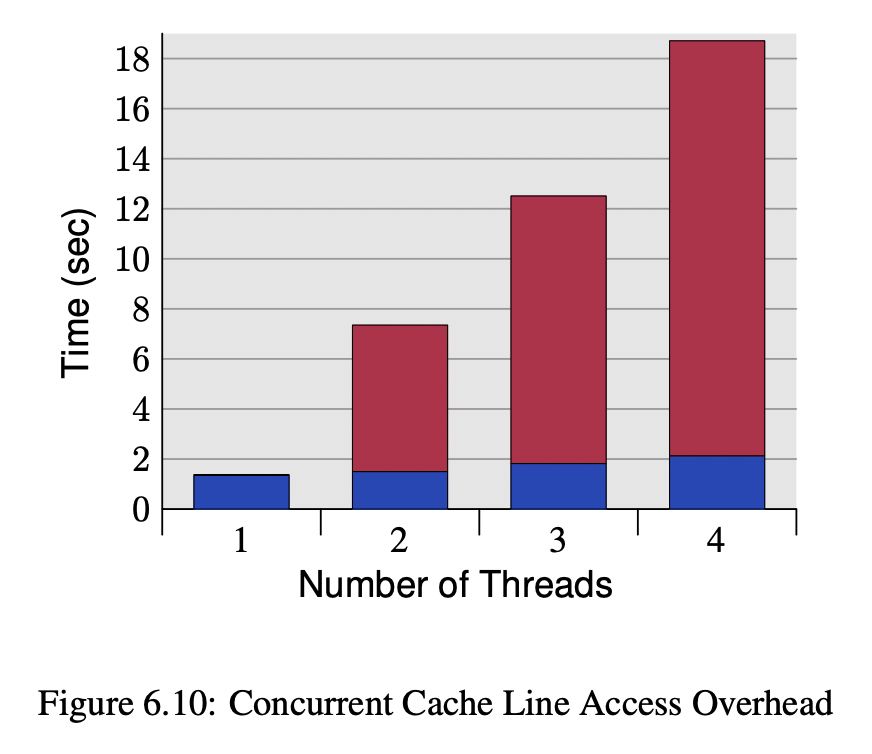
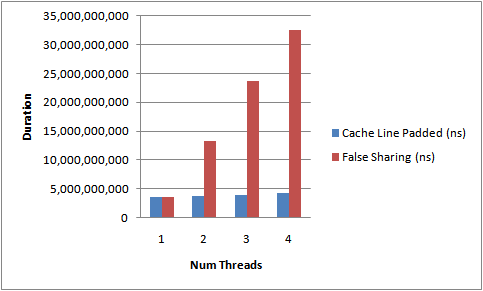
We will illustrate the cost of locks with a simple demonstration. The focus of this experiment is to call a function which increments a 64-bit counter in a loop 500 million times. This can be executed by a single thread on a 2.4Ghz Intel Westmere EP in just 300ms if written in Java. The language is unimportant to this experiment and results will be similar across all languages with the same basic primitives.
Once a lock is introduced to provide mutual exclusion, even when the lock is as yet un-contended, the cost goes up significantly. The cost increases again, by orders of magnitude, when two or more threads begin to contend. The results of this simple experiment are shown in the table below:
public class LockBenchmark{ public static void runIncrement() { long counter = 0; long max = 50000000000L; long start = System.currentTimeMillis(); while (counter < max) { counter++; } long end = System.currentTimeMillis(); System.out.println("Time spent is " + (end-start) + "ms without lock"); }
public static void runIncrementWithLock() { Lock lock = new ReentrantLock(); long counter = 0; long max = 500000000L; long start = System.currentTimeMillis(); while (counter < max) { if (lock.tryLock()){ counter++; lock.unlock(); } } long end = System.currentTimeMillis(); System.out.println("Time spent is " + (end-start) + "ms with lock"); }
public class LockBenchmark{ public static void runIncrement() { long counter = 0; long max = 500000000L; double sum =100.0; long start = System.currentTimeMillis(); while (counter < max) { counter++; sum=3.251; for(int i=0; i<10; ++i){ sum += sum*3.75/3; } } long end = System.currentTimeMillis(); System.out.println("Time spent is " + (end-start) + "ms without lock:"+sum); }
public static void runIncrementWithLock() { Lock lock = new ReentrantLock(); long counter = 0; double sum=100.0; long max = 500000000L; long start = System.currentTimeMillis(); while (counter < max) { if (lock.tryLock()){ counter++; sum=3.253; for(int i=0; i<10; ++i){ sum += sum*3.75/3; } lock.unlock(); } } long end = System.currentTimeMillis(); System.out.println("Time spent is " + (end-start) + "ms with lock:"+sum); }
#java test.LockBenchmark //如上代码循环次数都是5亿次, intel cpu Time spent is 11884ms without lock:10810.40962948895 start runIncrementWithLock. Time spent is 22662ms with lock:10817.060142949109
#perf stat -p `jps | grep LockBenchmark | awk '{ print $1 }'` ^C Performance counter stats for process id '117862':
#java test.LockBenchmark //鲲鹏920 Time spent is 37037ms without lock:10810.40962948895 start runIncrementWithLock. Time spent is 37045ms with lock:10817.060142949109 //极低的概率这里能跑出来15秒,应该是偷鸡优化了
#perf stat -p `jps | grep LockBenchmark | awk '{ print $1 }'` ^Cfailed to read counter branches
Performance counter stats for process id '104166':
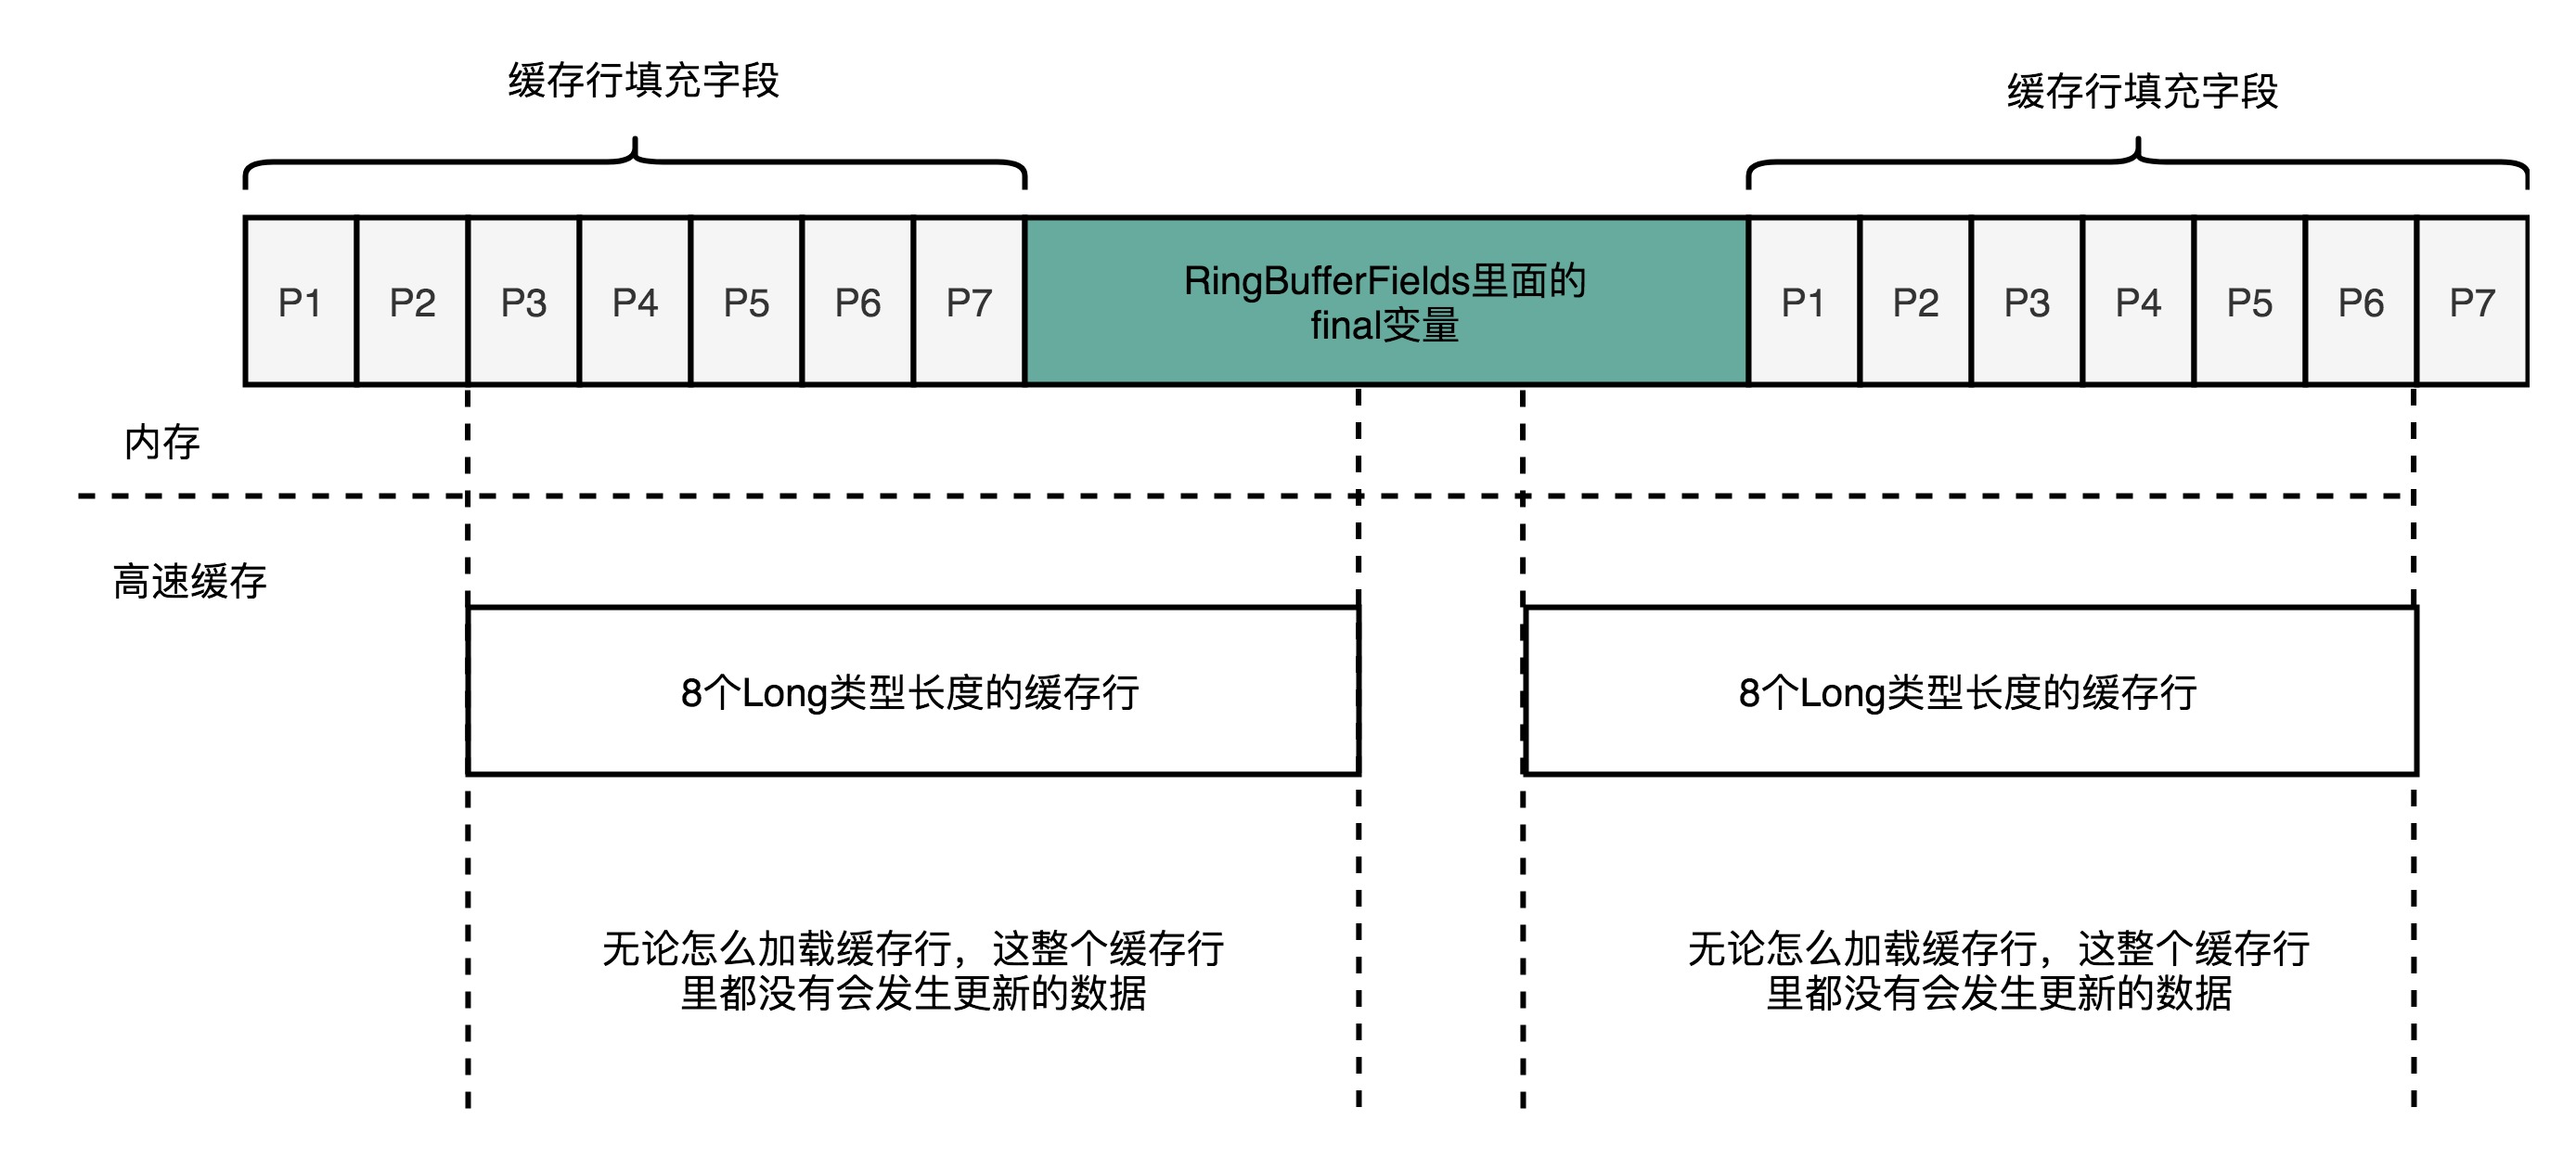
abstract class RingBufferPad
{
    protected long p1, p2, p3, p4, p5, p6, p7;
}

abstract class RingBufferFields<E> extends RingBufferPad
{
    ......
    private final long indexMask;
    private final Object[] entries;
    protected final int bufferSize;
    protected final Sequencer sequencer;
    ......
}

public final class RingBuffer<E> extends RingBufferFields<E> implements Cursored, EventSequencer<E>, EventSink<E>
{
    ......
    protected long p1, p2, p3, p4, p5, p6, p7;
    ......
}
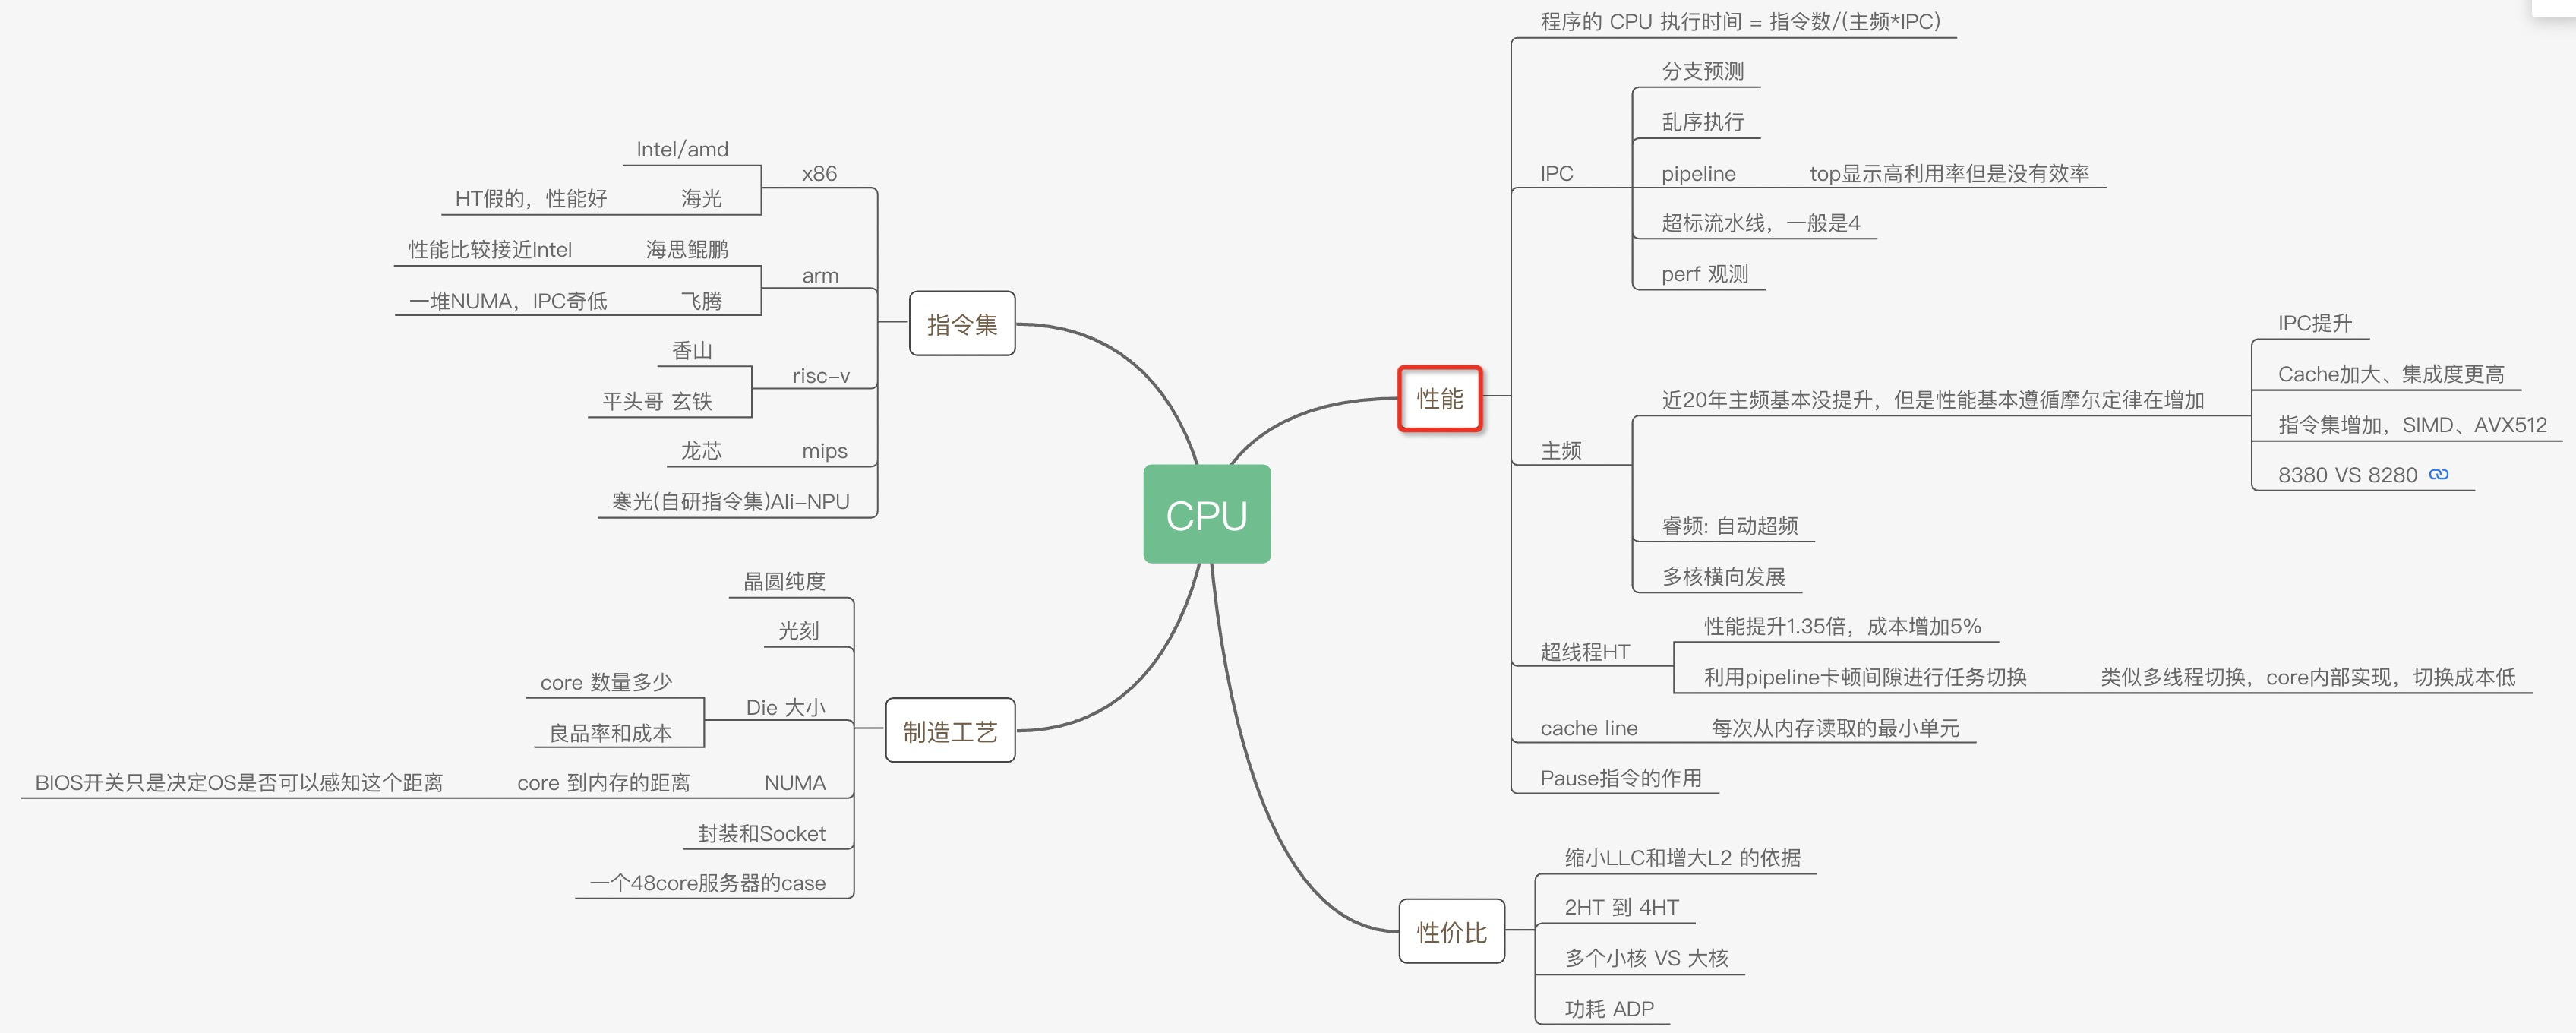
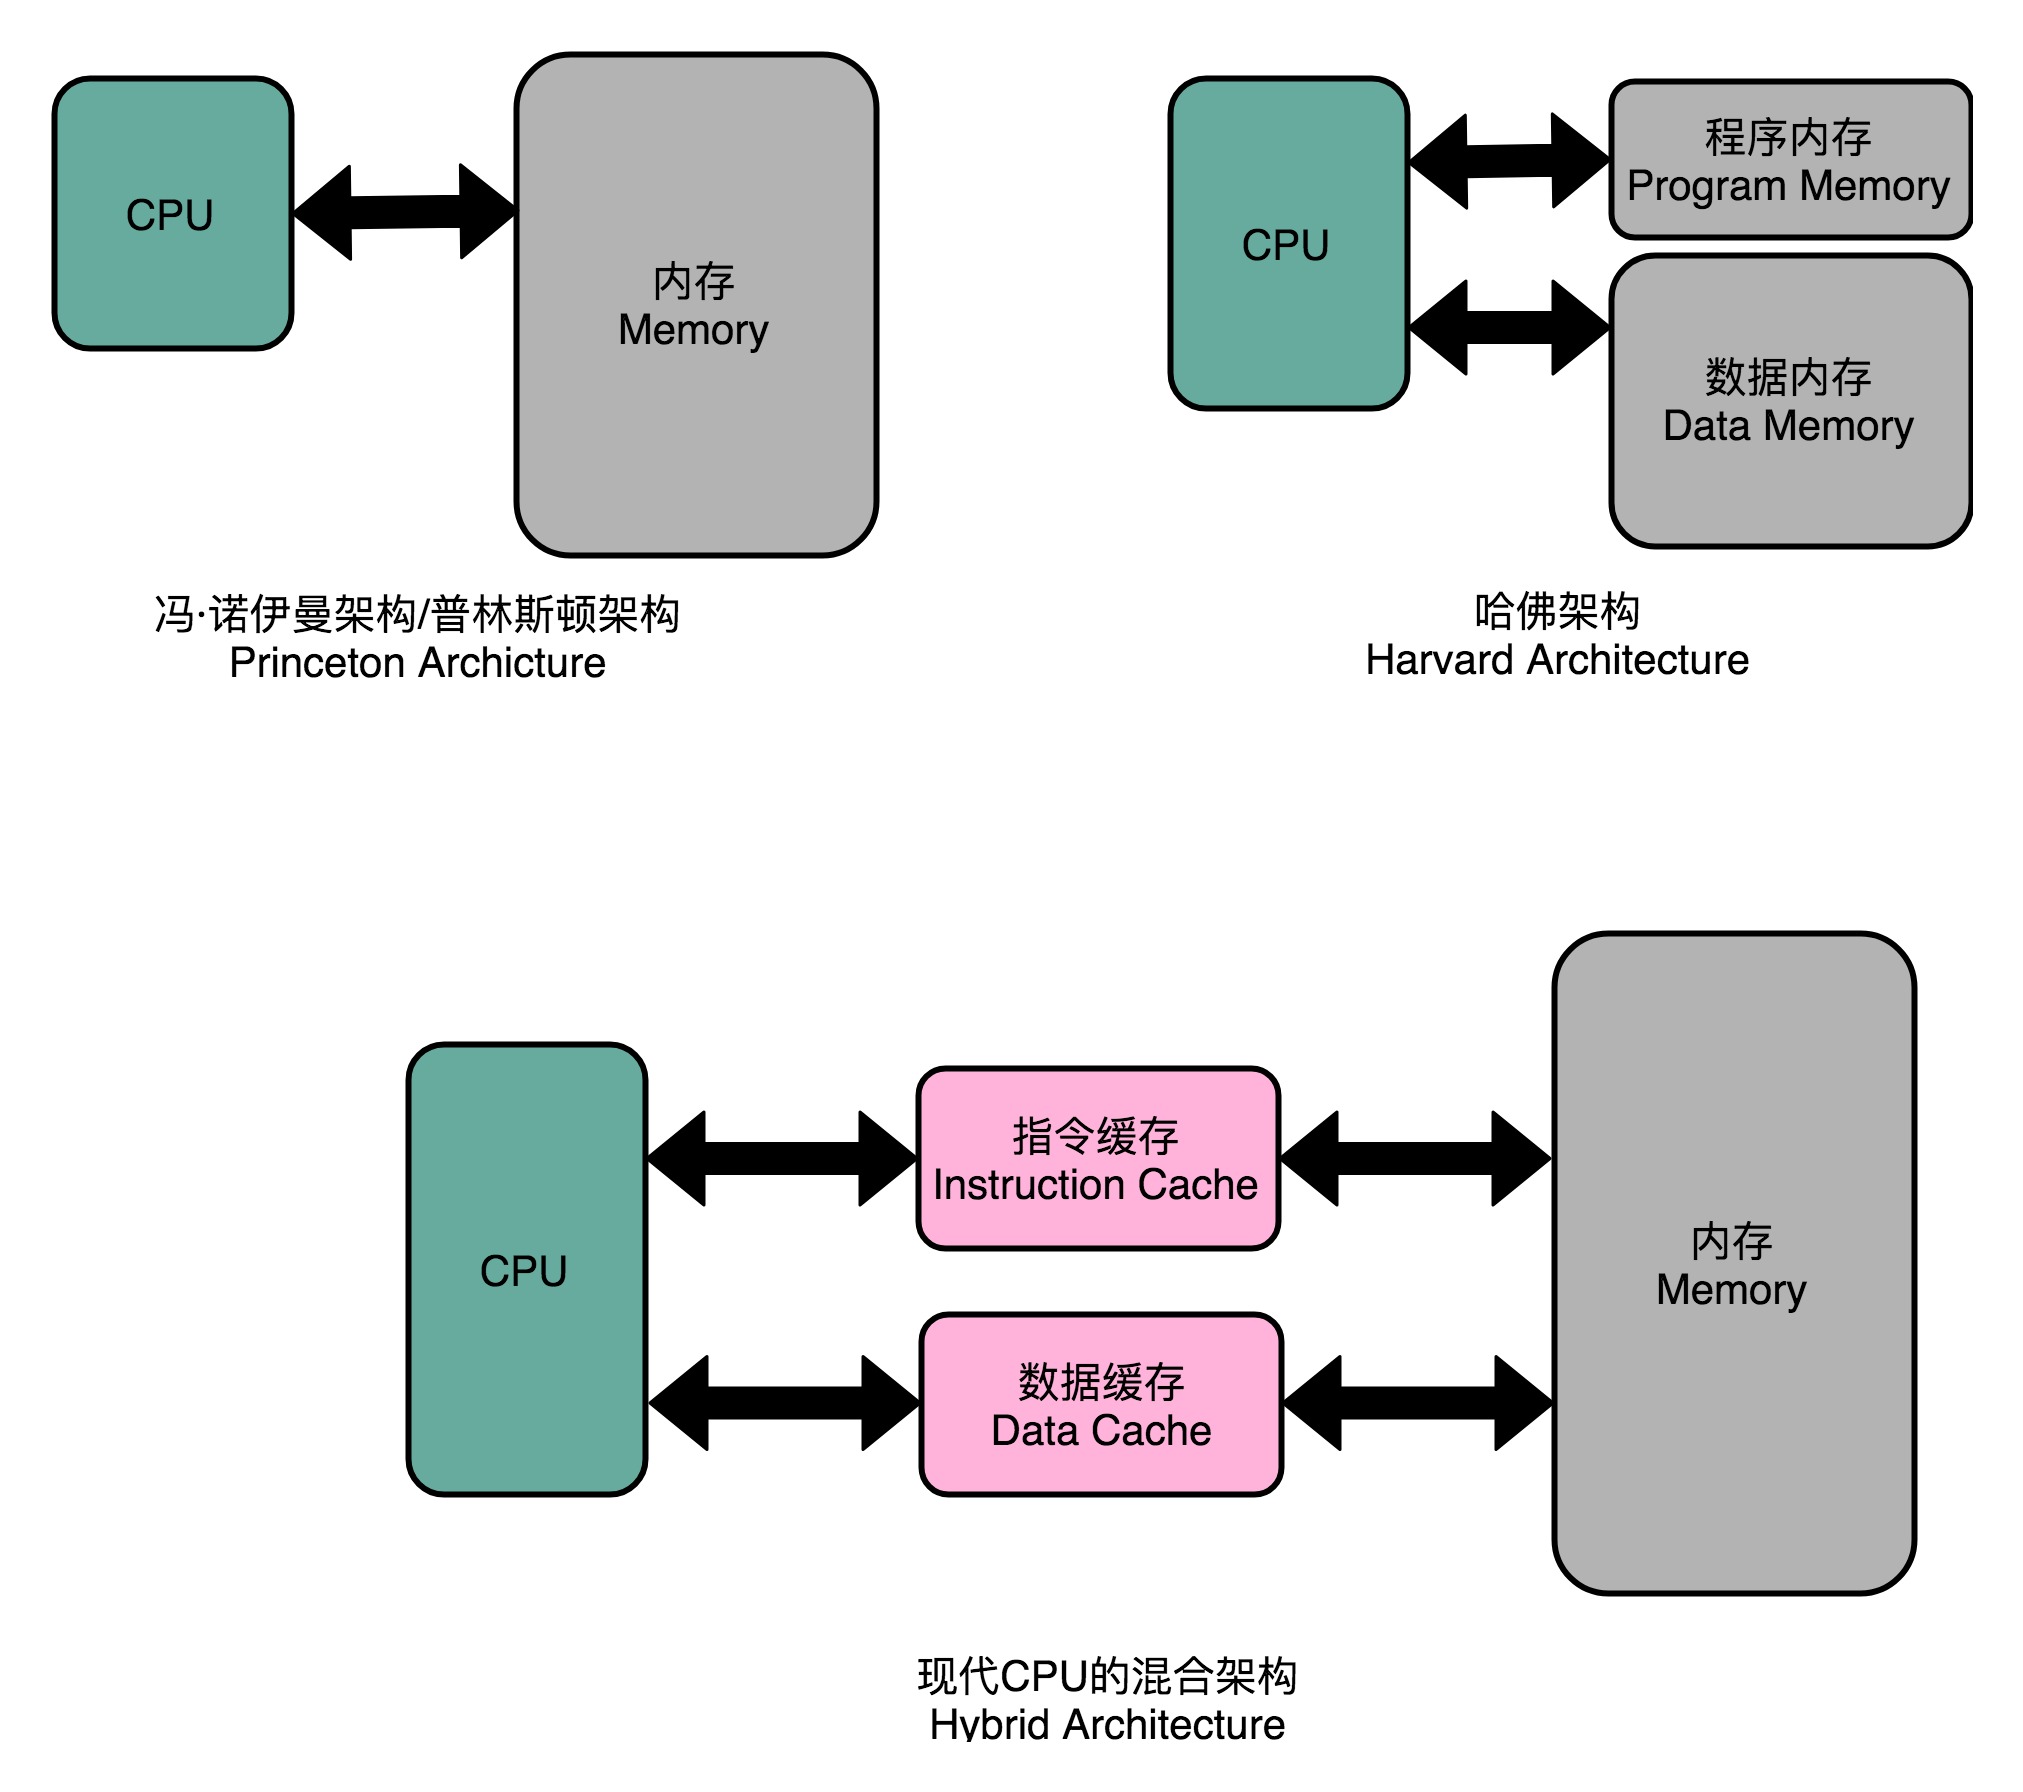
把内存拆成两部分的解决方案,在计算机体系结构里叫作哈佛架构(Harvard Architecture),来自哈佛大学设计Mark I 型计算机时候的设计。我们今天使用的 CPU,仍然是冯·诺依曼体系结构的,并没有把内存拆成程序内存和数据内存这两部分。因为如果那样拆的话,对程序指令和数据需要的内存空间,我们就没有办法根据实际的应用去动态分配了。虽然解决了资源冲突的问题,但是也失去了灵活性。
Two logical cores can work through tasks more efficiently than a traditional single-threaded core. By taking advantage of idle time when the core would formerly be waiting for other tasks to complete, Intel® Hyper-Threading Technology improves CPU throughput (by up to 30% in server applications).
举个例子,如果一个线程运行过程中,必须要等到一些数据加载到缓存中以后才能继续执行,此时 CPU 就可以切换到另一个线程,去执行其他指令,而不用去处于空闲状态,等待当前线程的数据加载完毕。通常,一个传统的处理器在线程之间切换,可能需要几万个时钟周期。而一个具有 HT 超线程技术的处理器只需要 1 个时钟周期。因此就大大减小了线程之间切换的成本,从而最大限度地让处理器满负荷运转。
ARM芯片基本不做超线程,另外请思考为什么有了应用层的多线程切换还需要CPU层面的超线程?
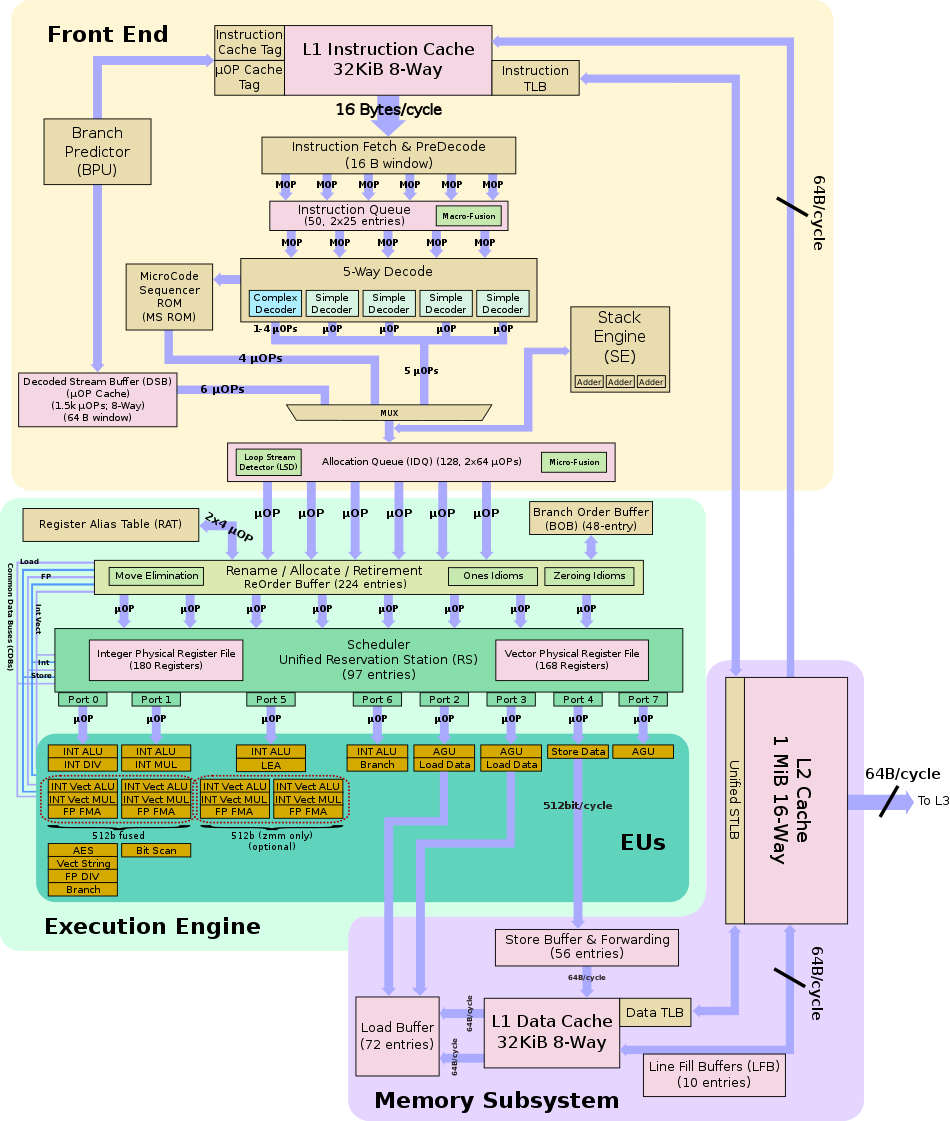
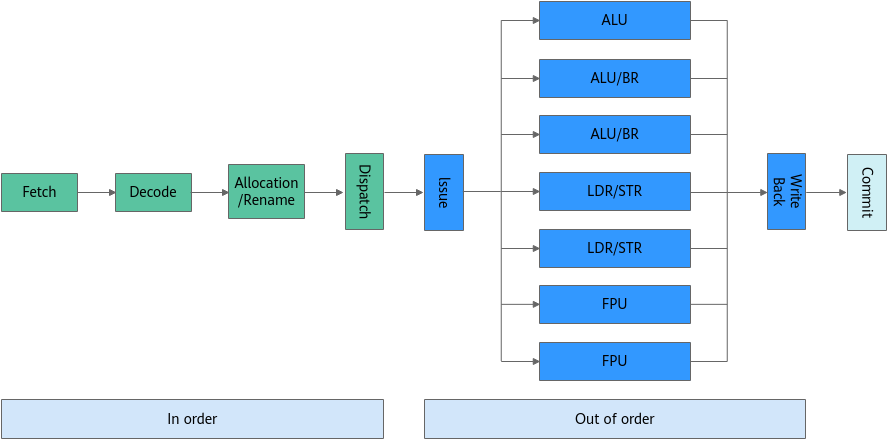
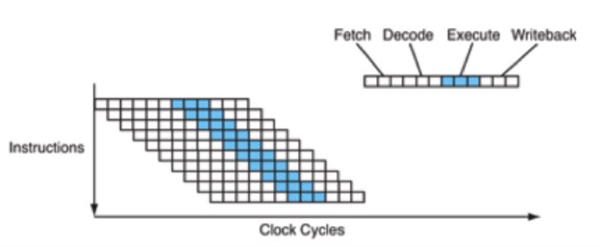
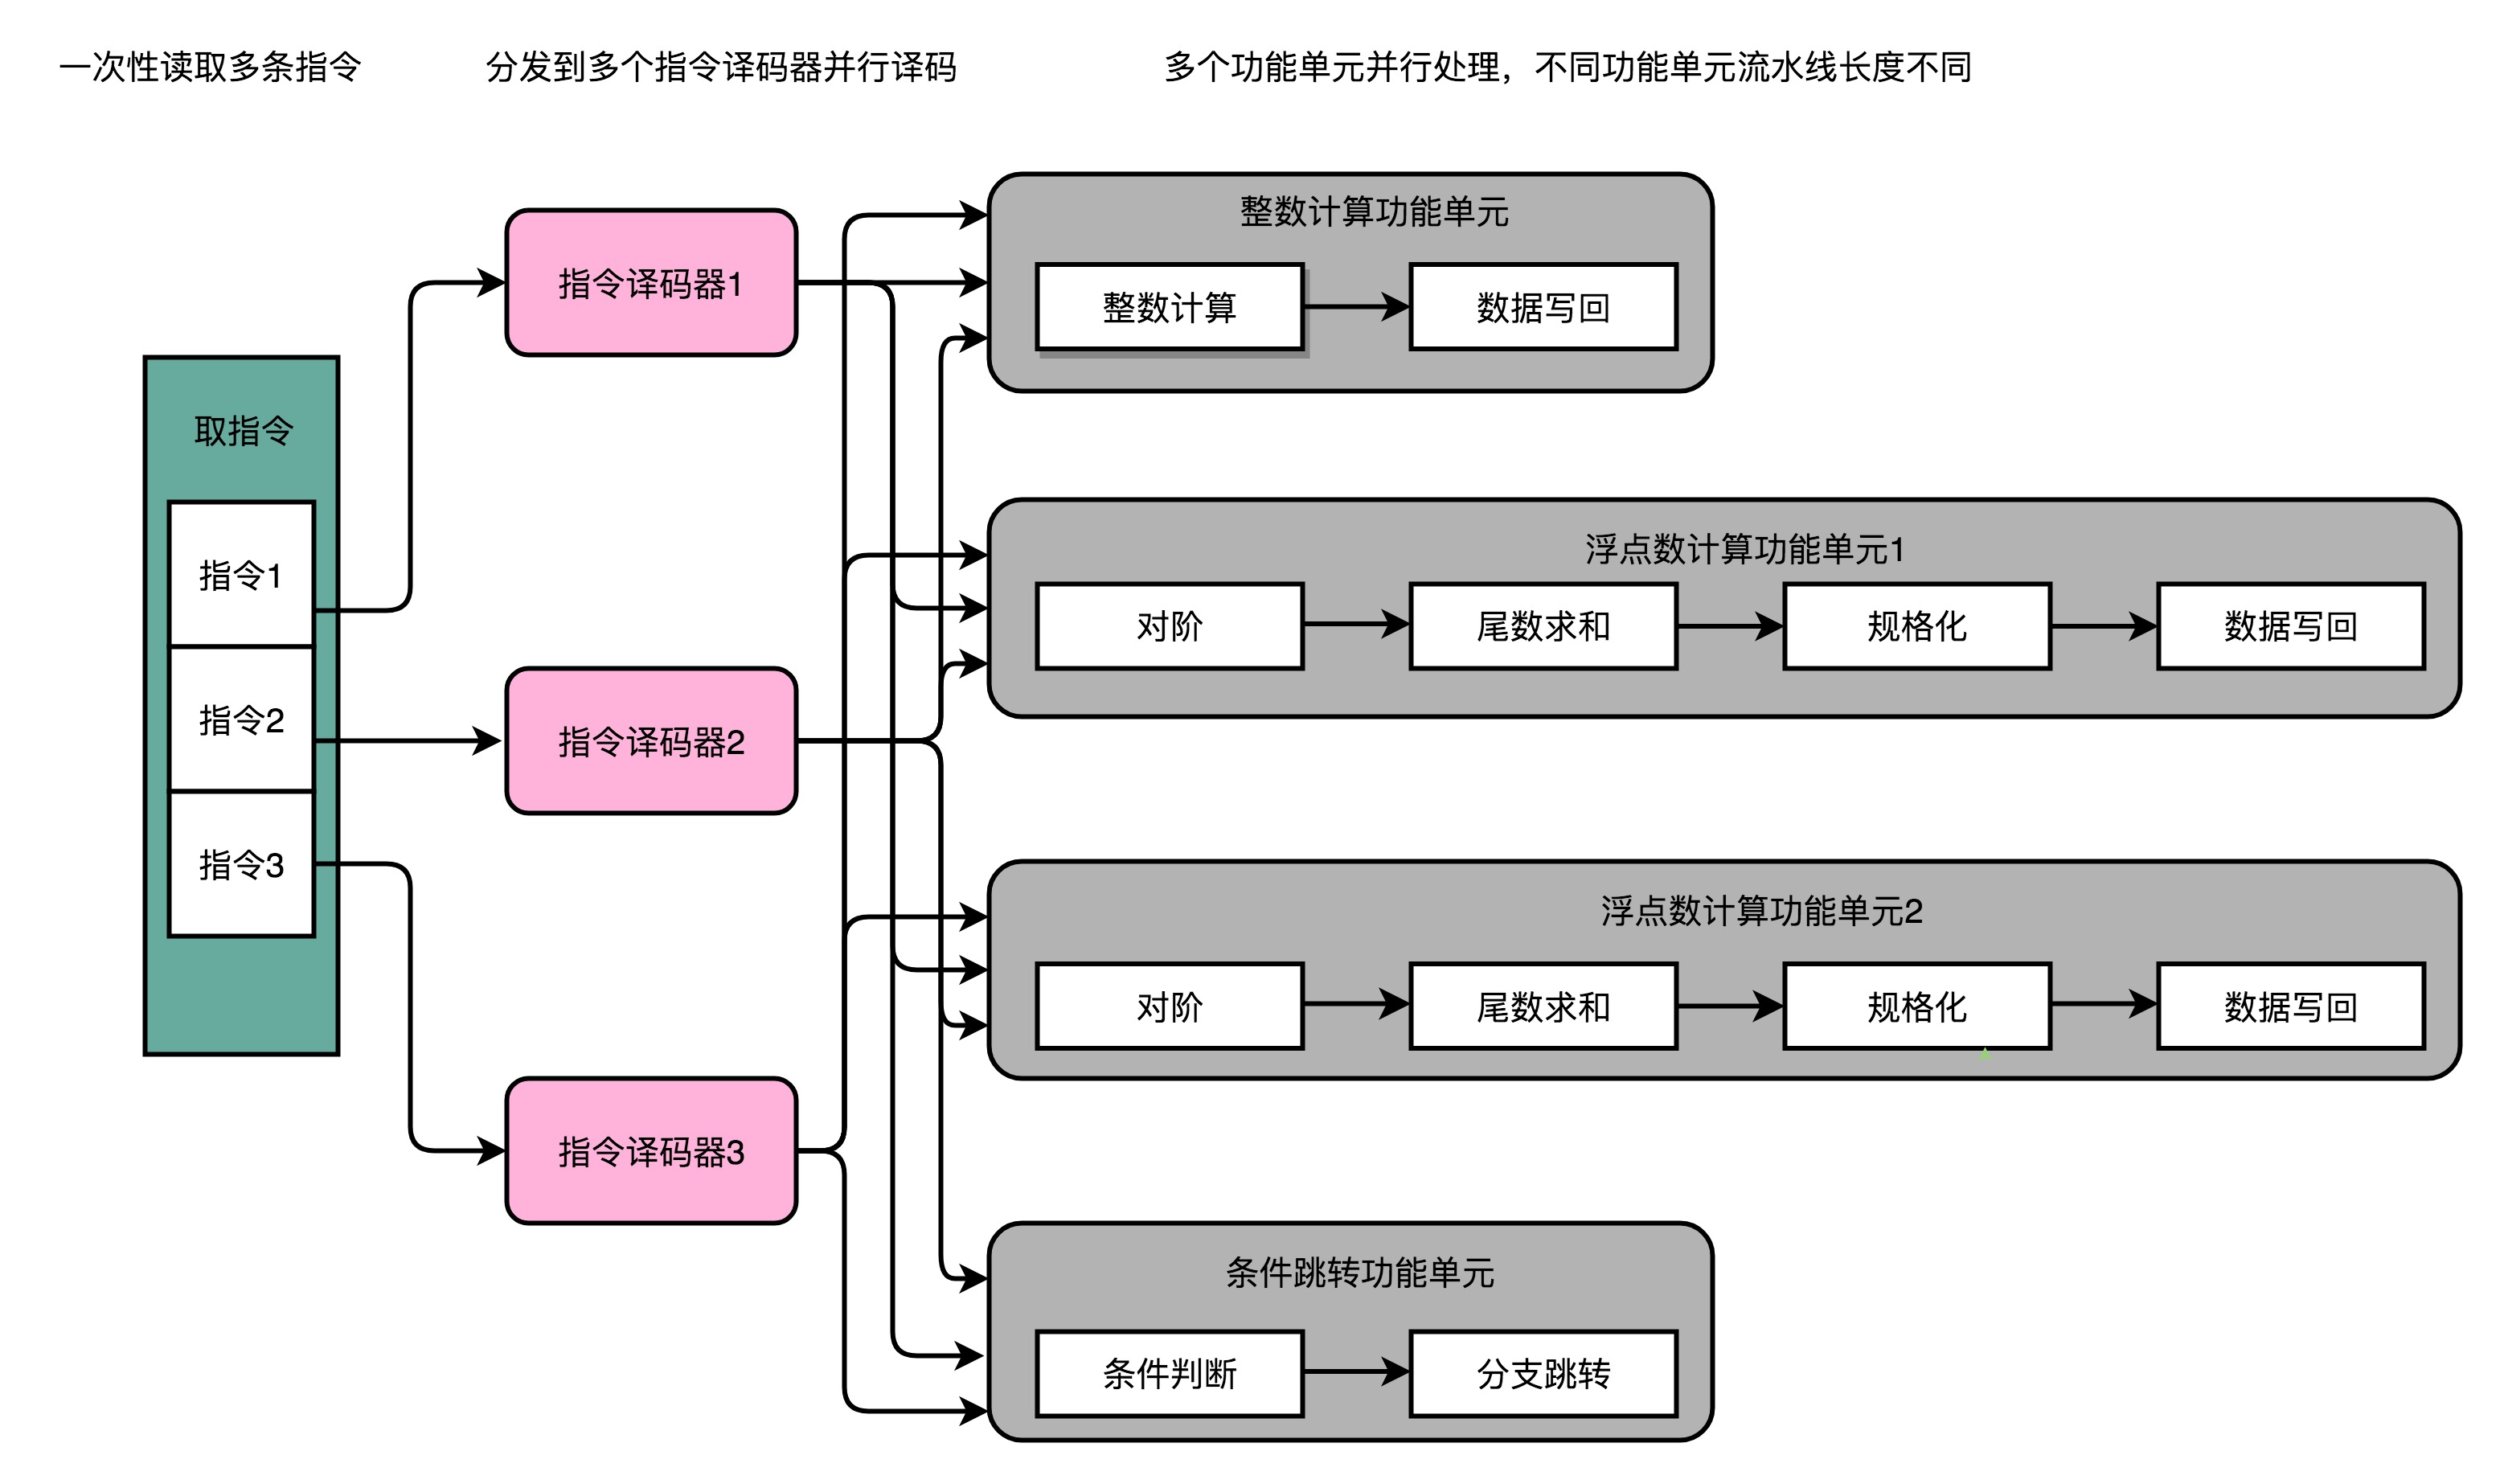
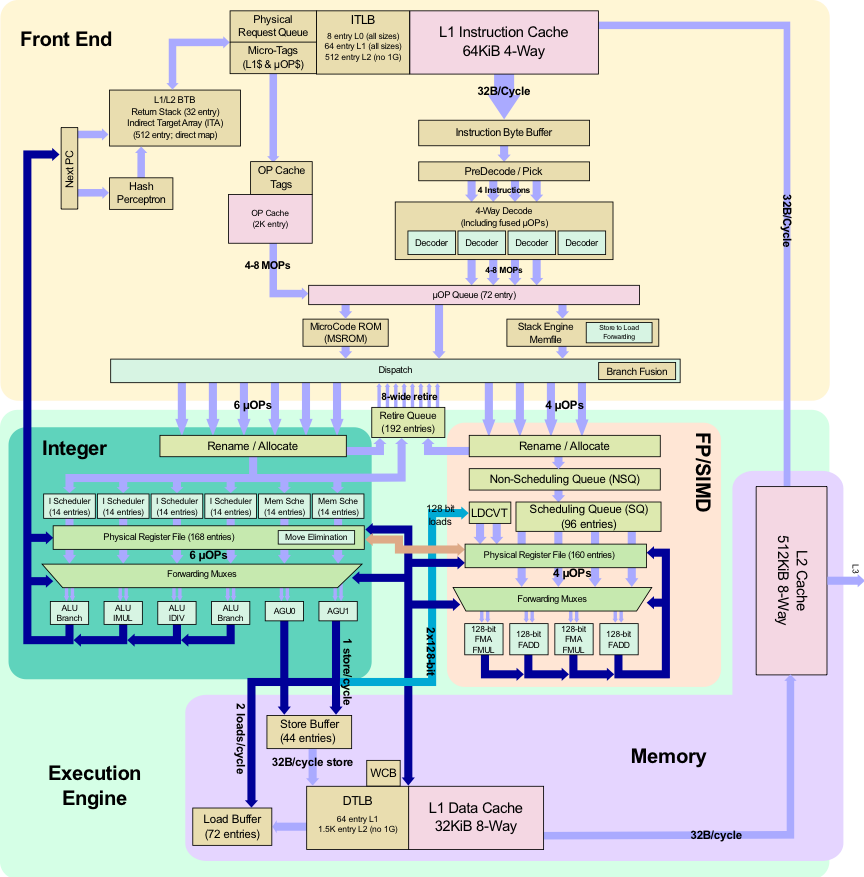
超线程(Hyper-Threading)物理实现: 在CPU内部增加寄存器等硬件设施,但是ALU、译码器等关键单元还是共享。在一个物理 CPU 核心内部,会有双份的 PC 寄存器、指令寄存器乃至条件码寄存器。超线程的目的,是在一个线程 A 的指令,在流水线里停顿的时候,让另外一个线程去执行指令。因为这个时候,CPU 的译码器和 ALU 就空出来了,那么另外一个线程 B,就可以拿来干自己需要的事情。这个线程 B 可没有对于线程 A 里面指令的关联和依赖。
把内存拆成两部分的解决方案,在计算机体系结构里叫作哈佛架构(Harvard Architecture),来自哈佛大学设计Mark I 型计算机时候的设计。我们今天使用的 CPU,仍然是冯·诺依曼体系结构的,并没有把内存拆成程序内存和数据内存这两部分。因为如果那样拆的话,对程序指令和数据需要的内存空间,我们就没有办法根据实际的应用去动态分配了。虽然解决了资源冲突的问题,但是也失去了灵活性。
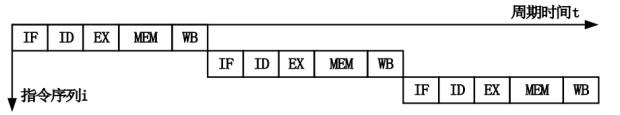
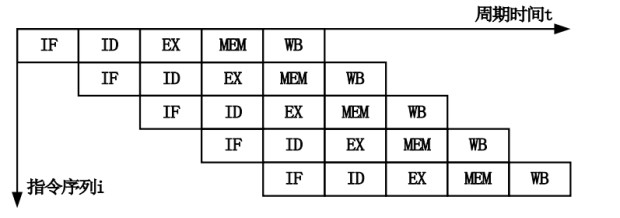
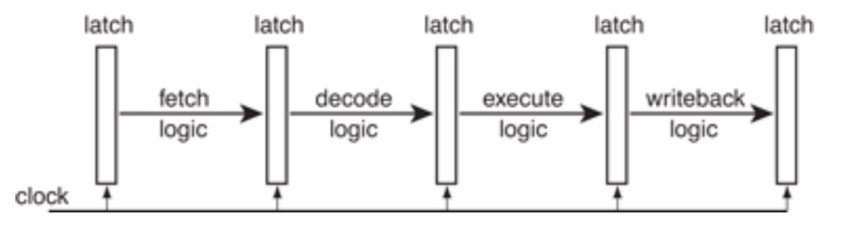
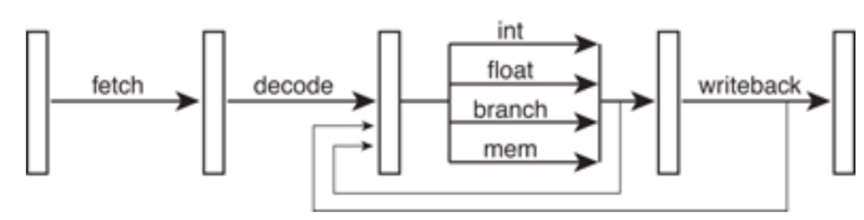
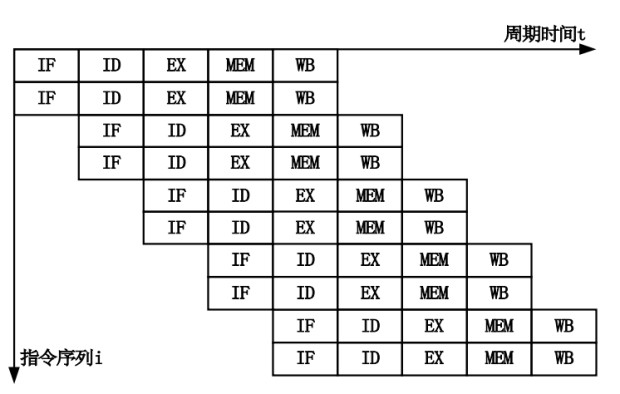
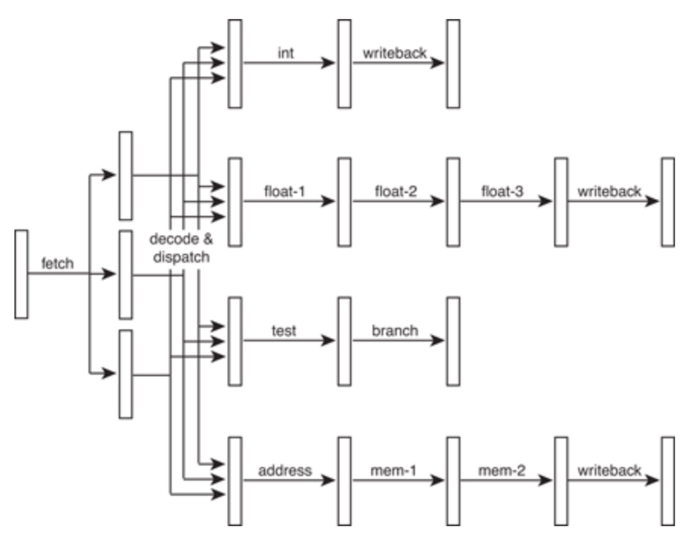
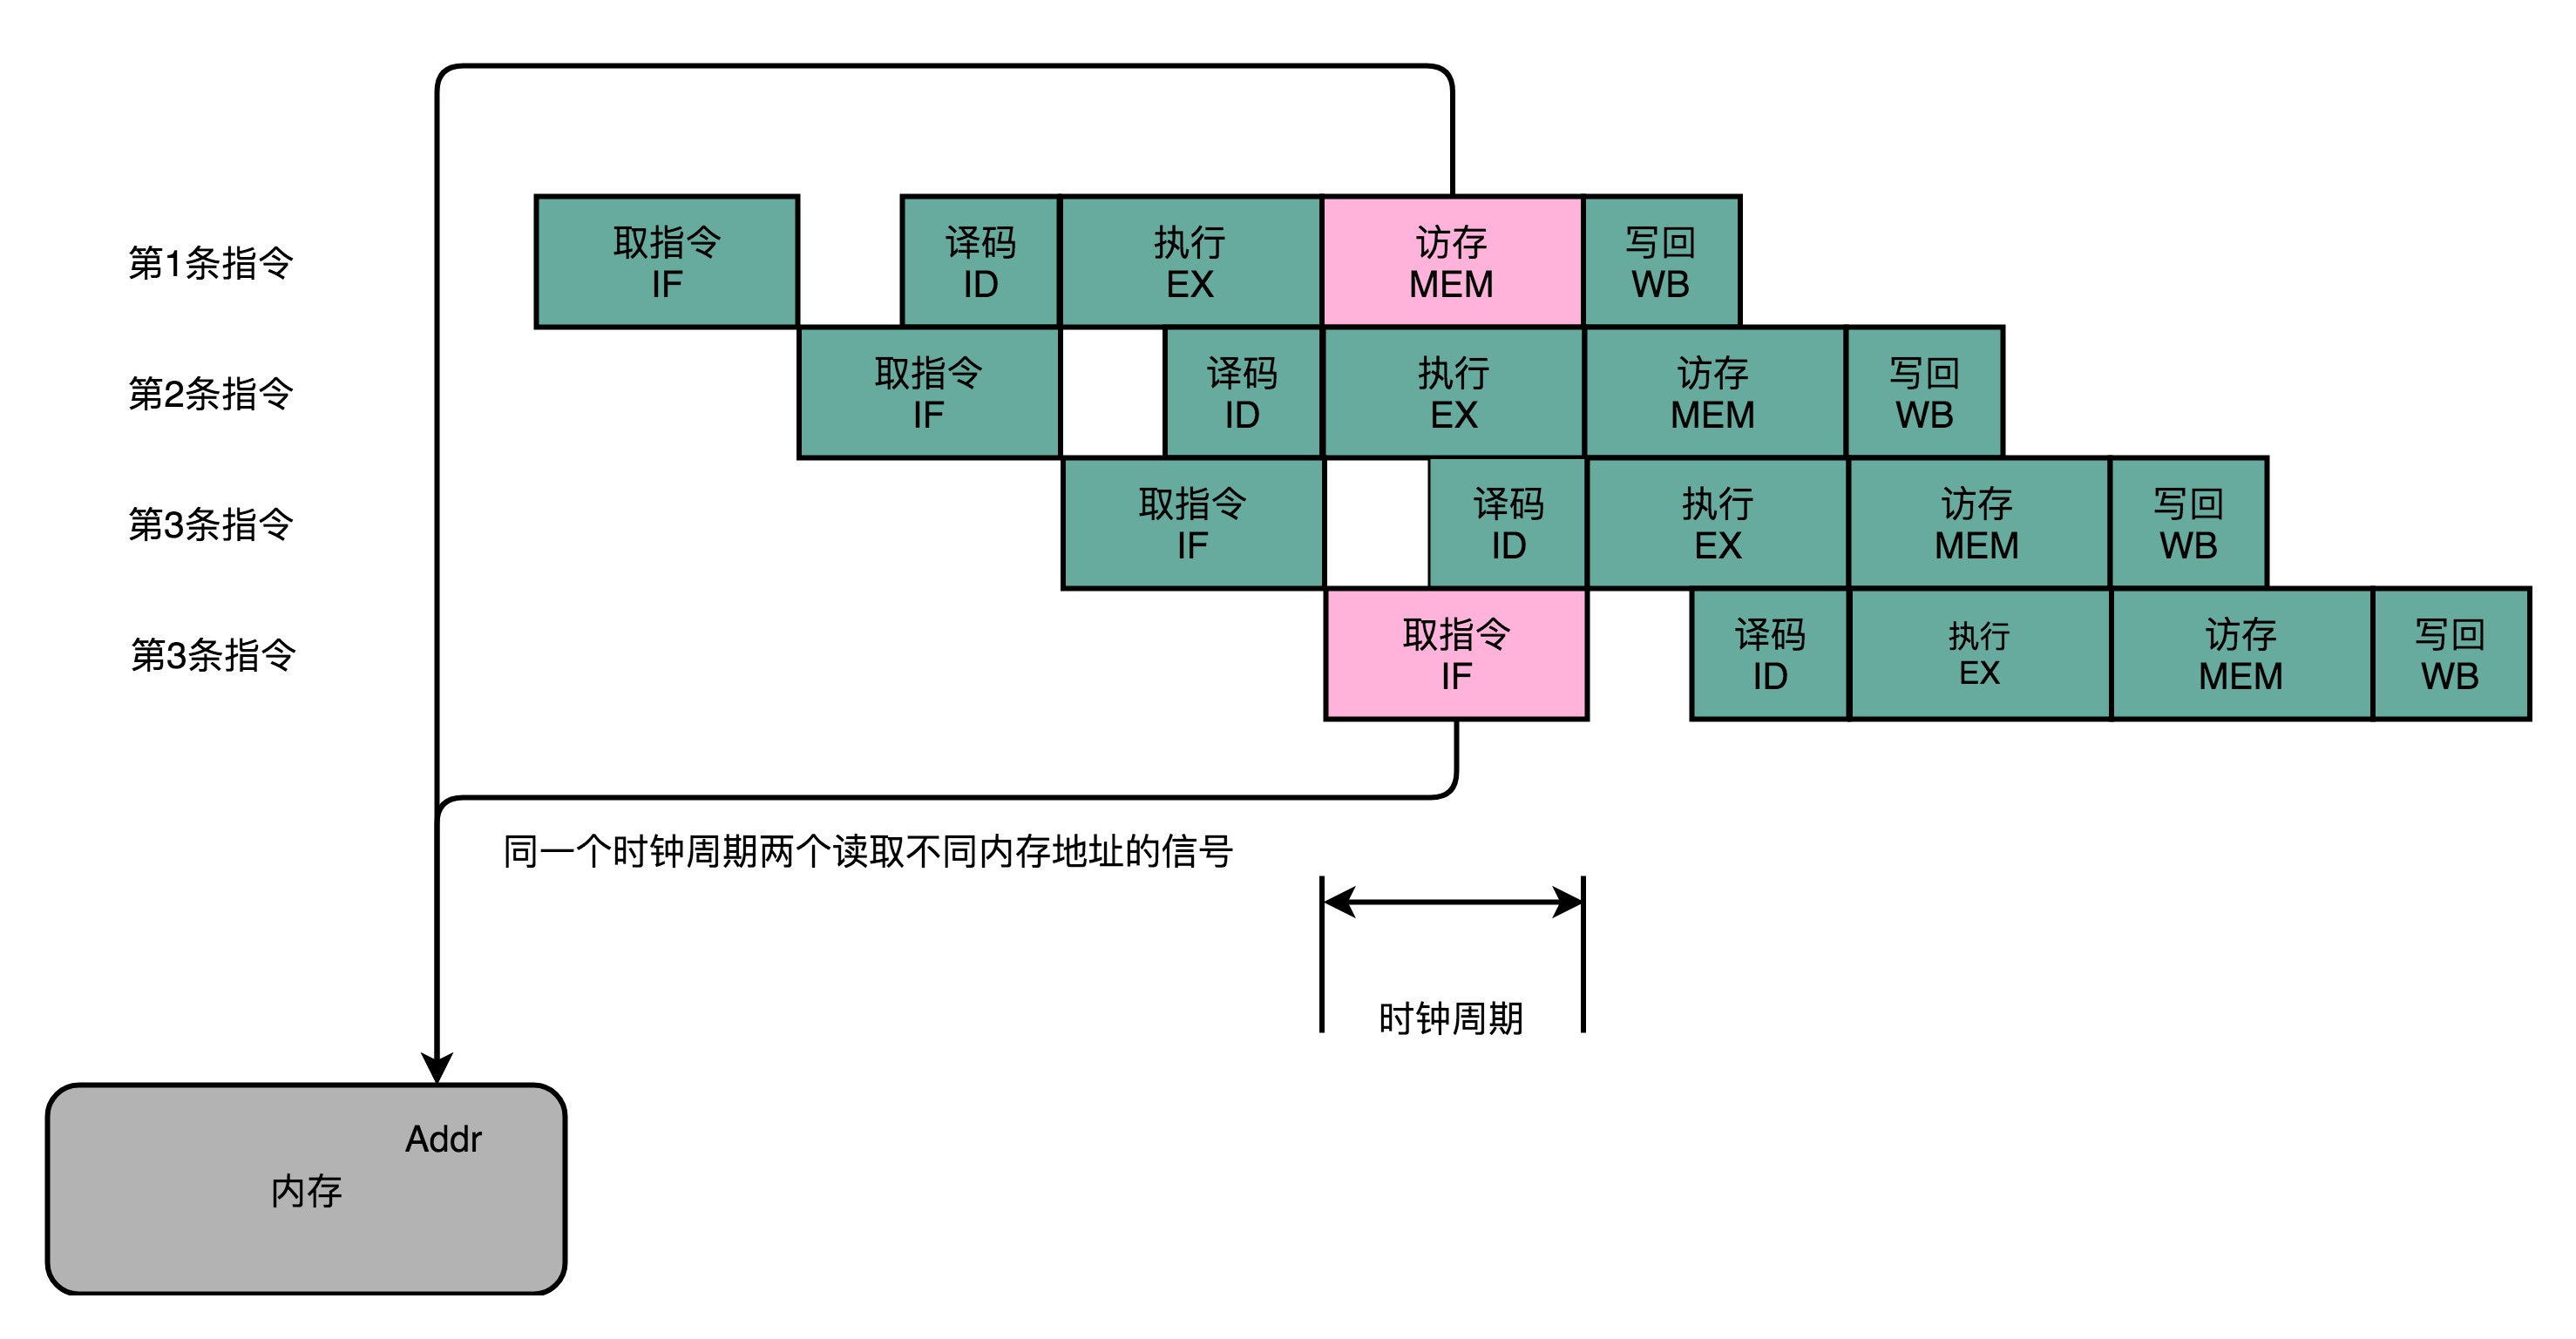
在流水线产生依赖的时候必须pipeline stall,也就是让依赖的指令执行NOP。
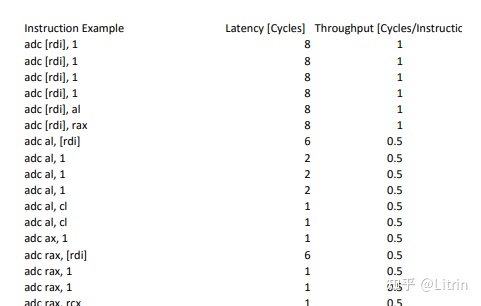
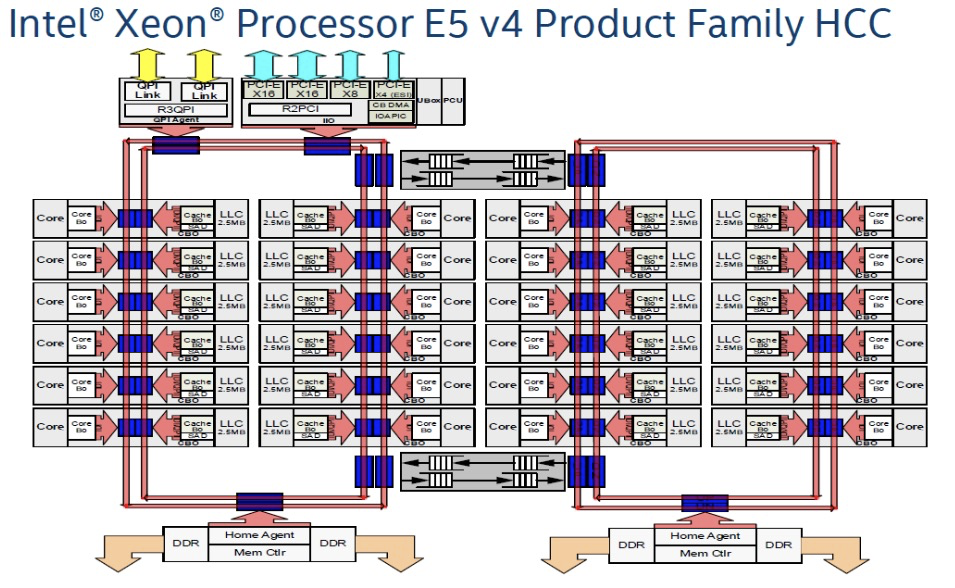
Intel X86每个指令需要的cycle
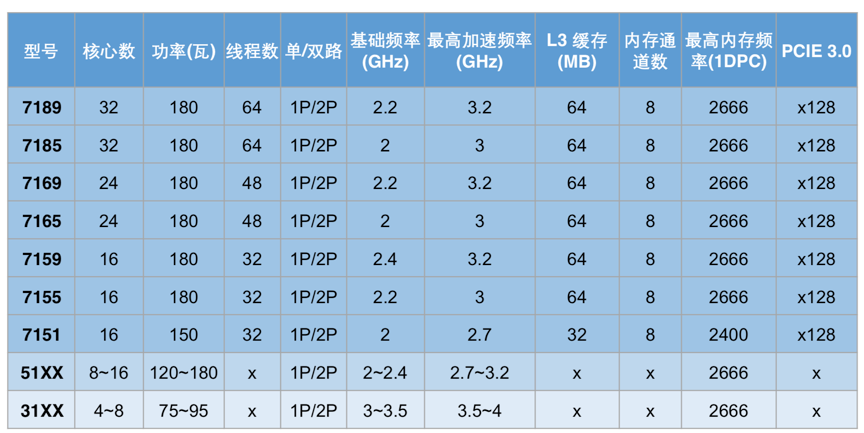
Intel xeon
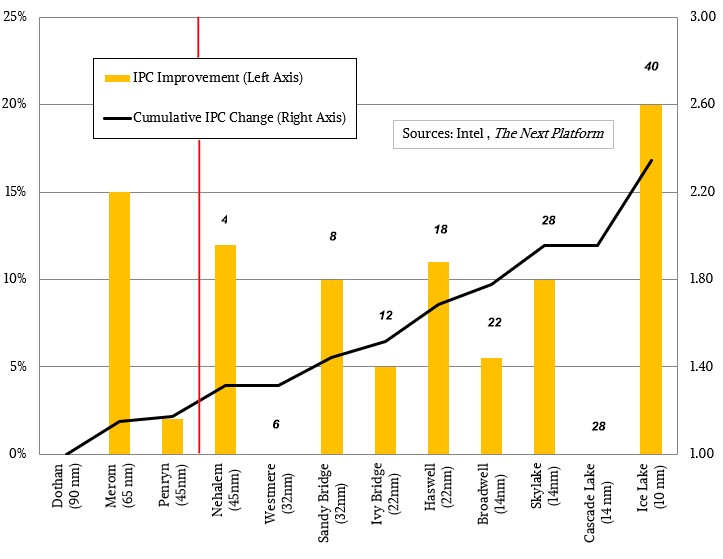
不同架构带来IPC变化:
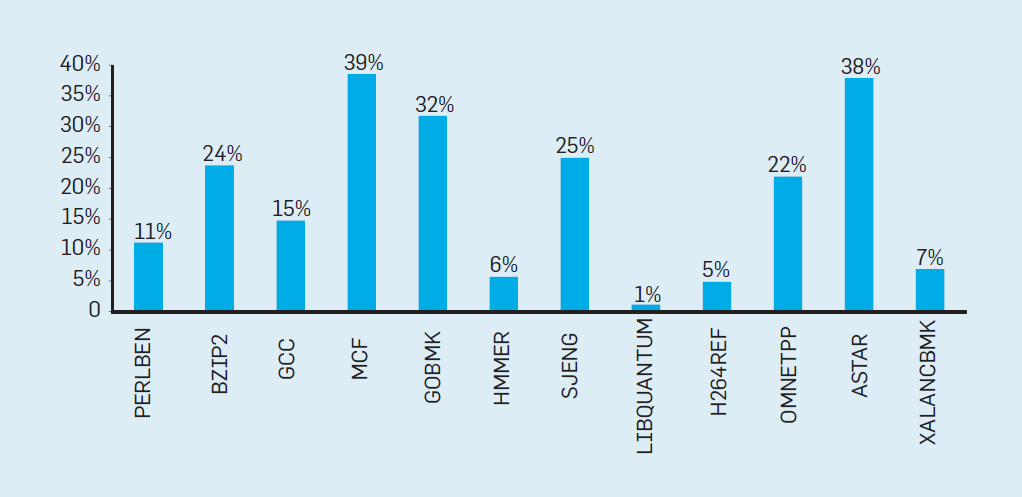
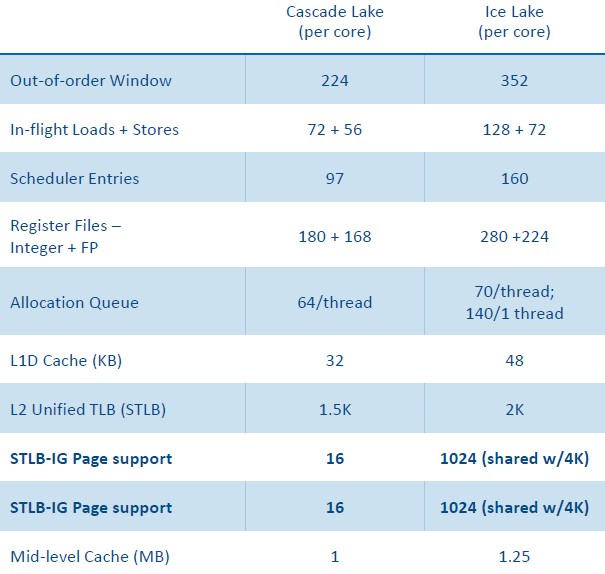
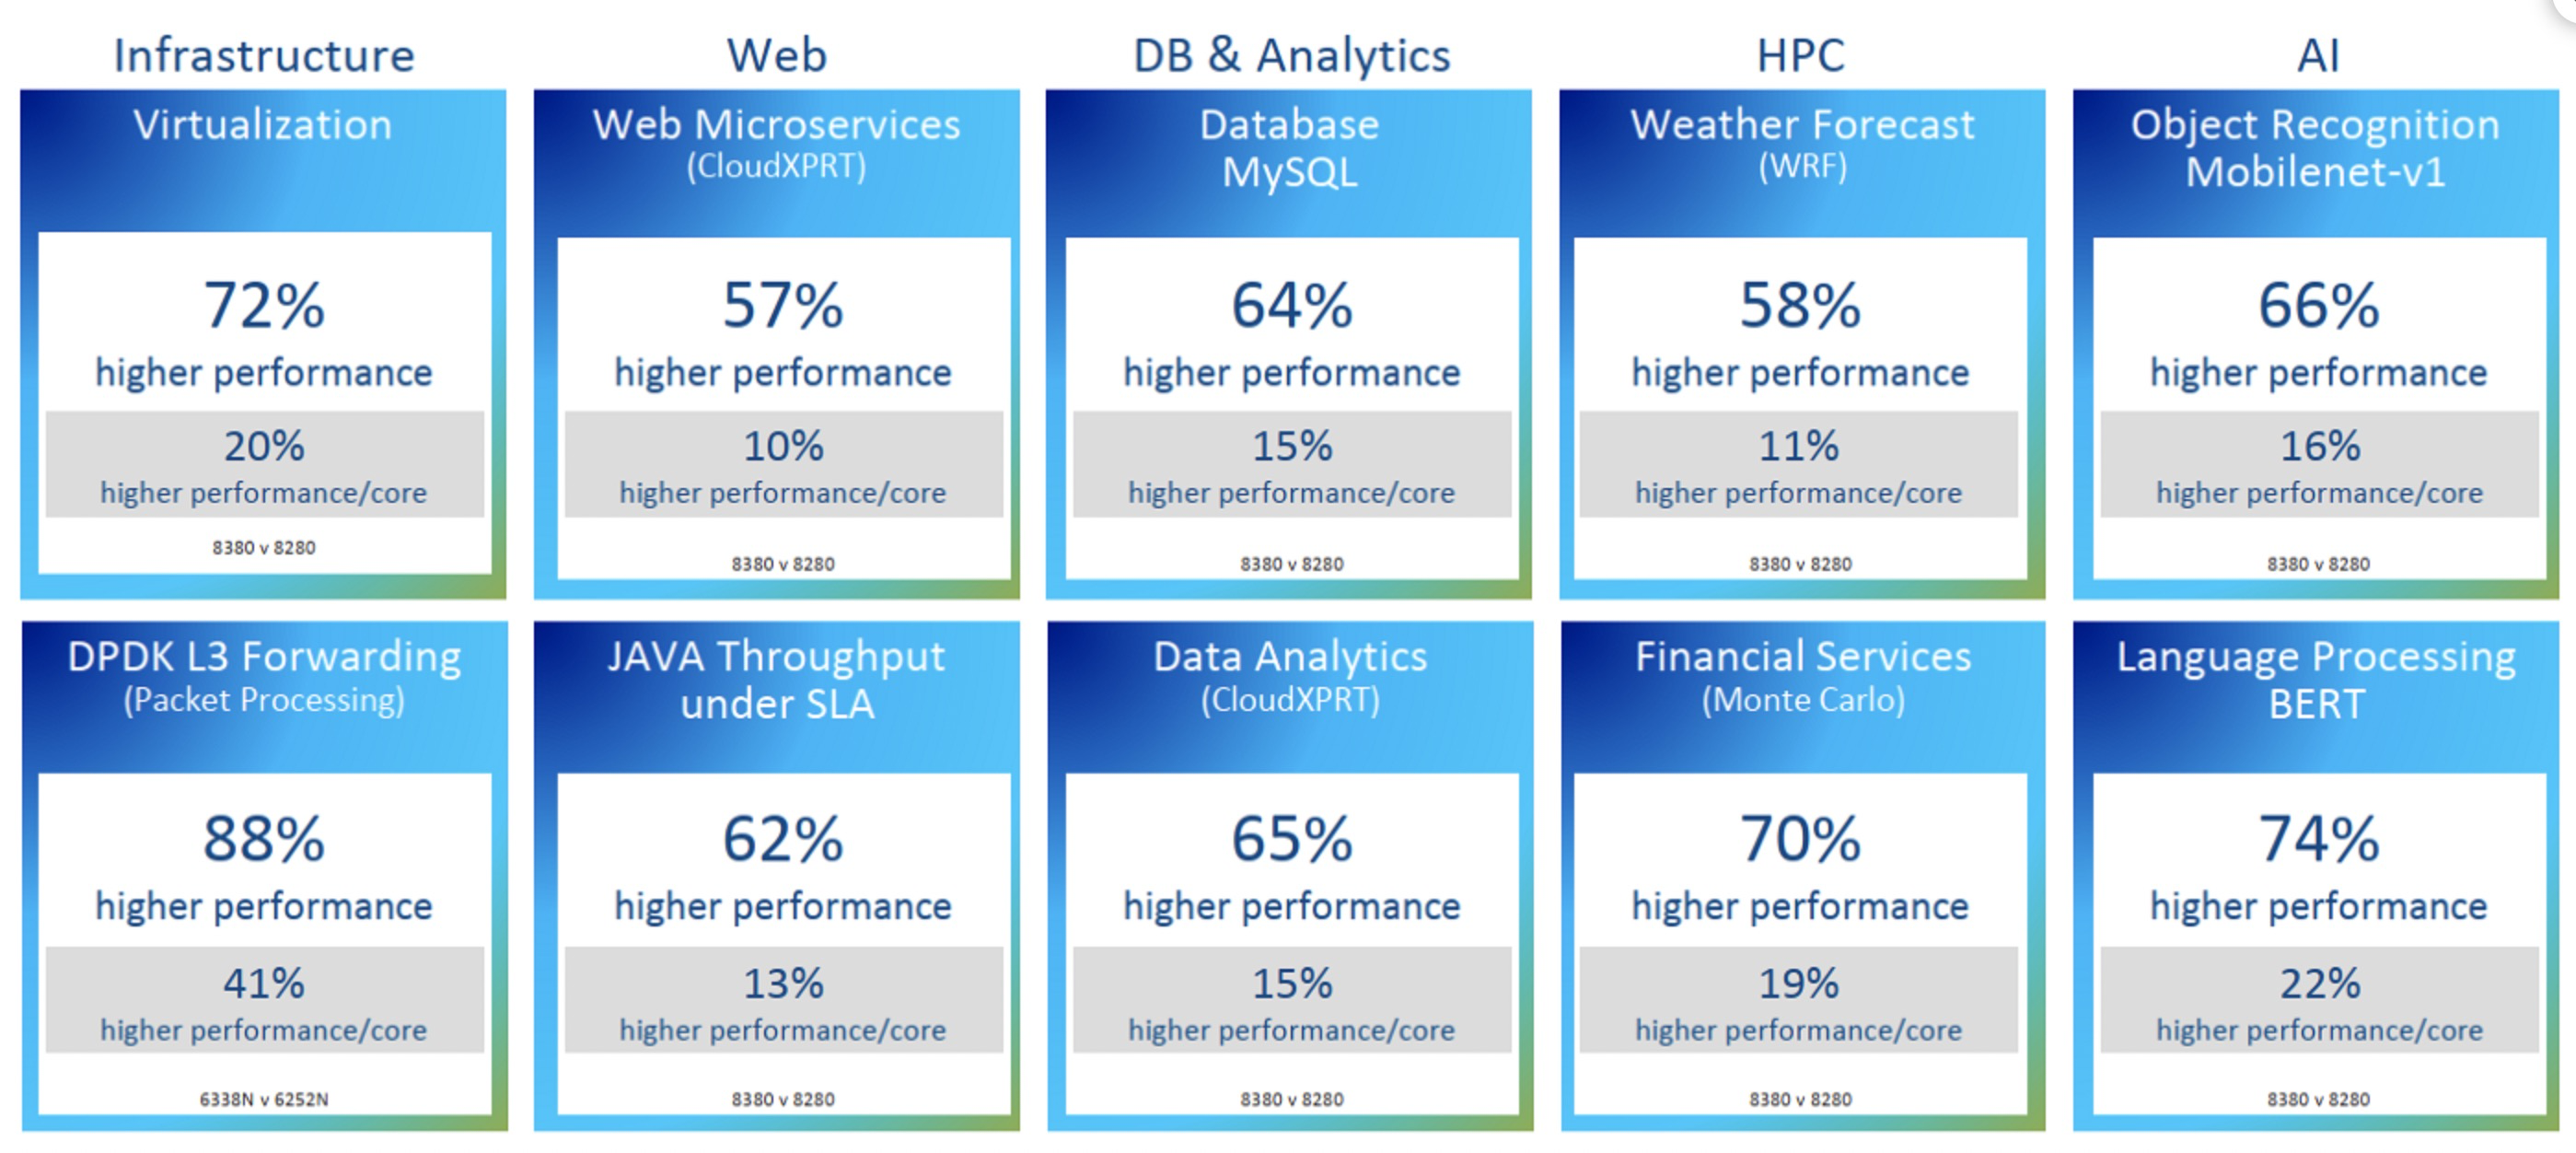
Intel 最新的CPU Ice Lake和其上一代的性能对比数据:
上图最终结果导致了IPC提升了20%,以及整体效率的提升:
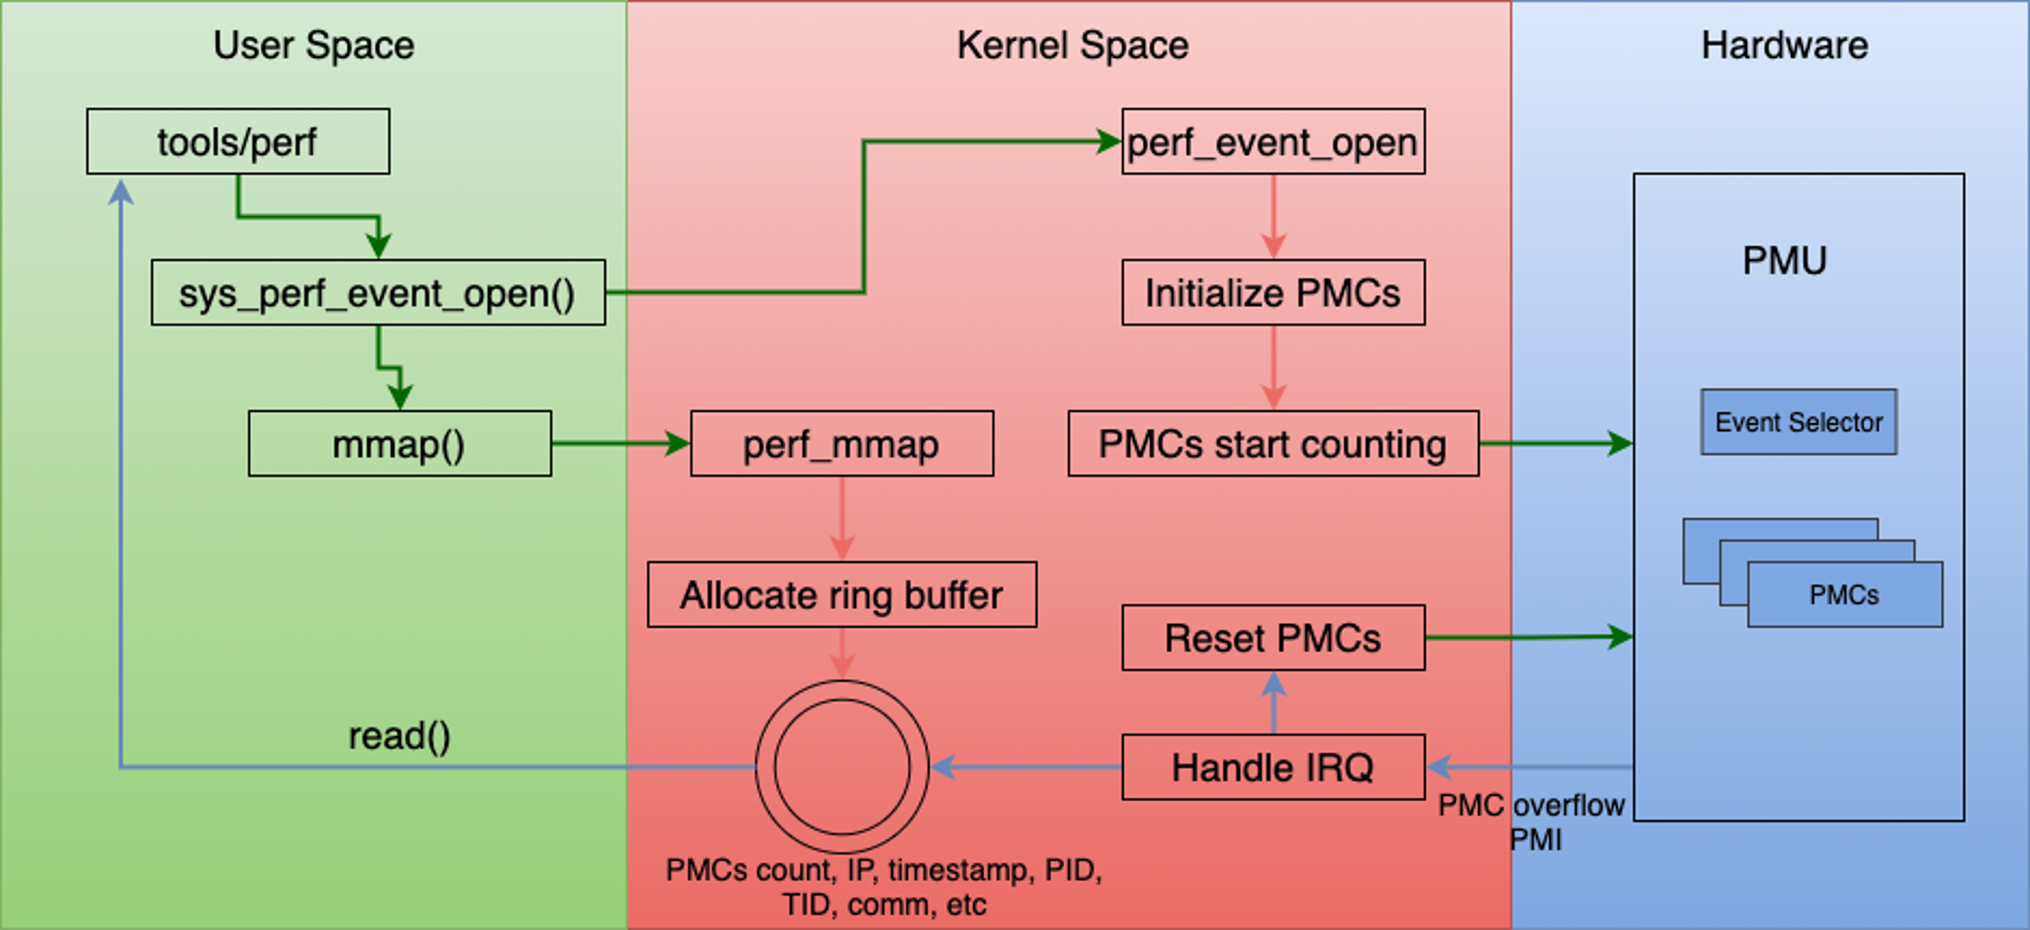
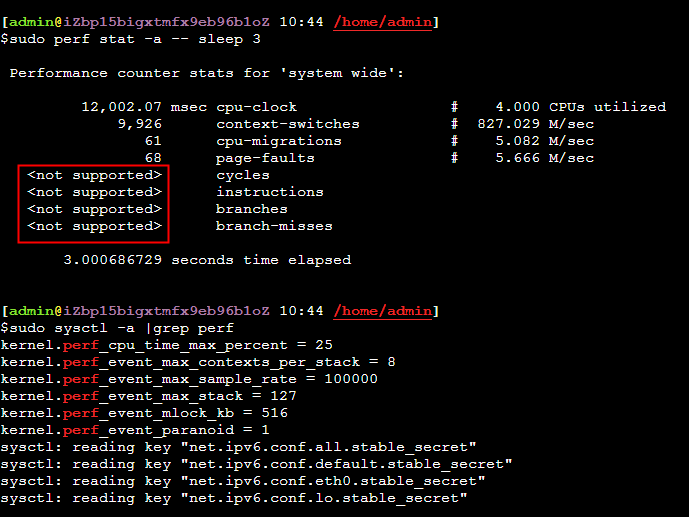
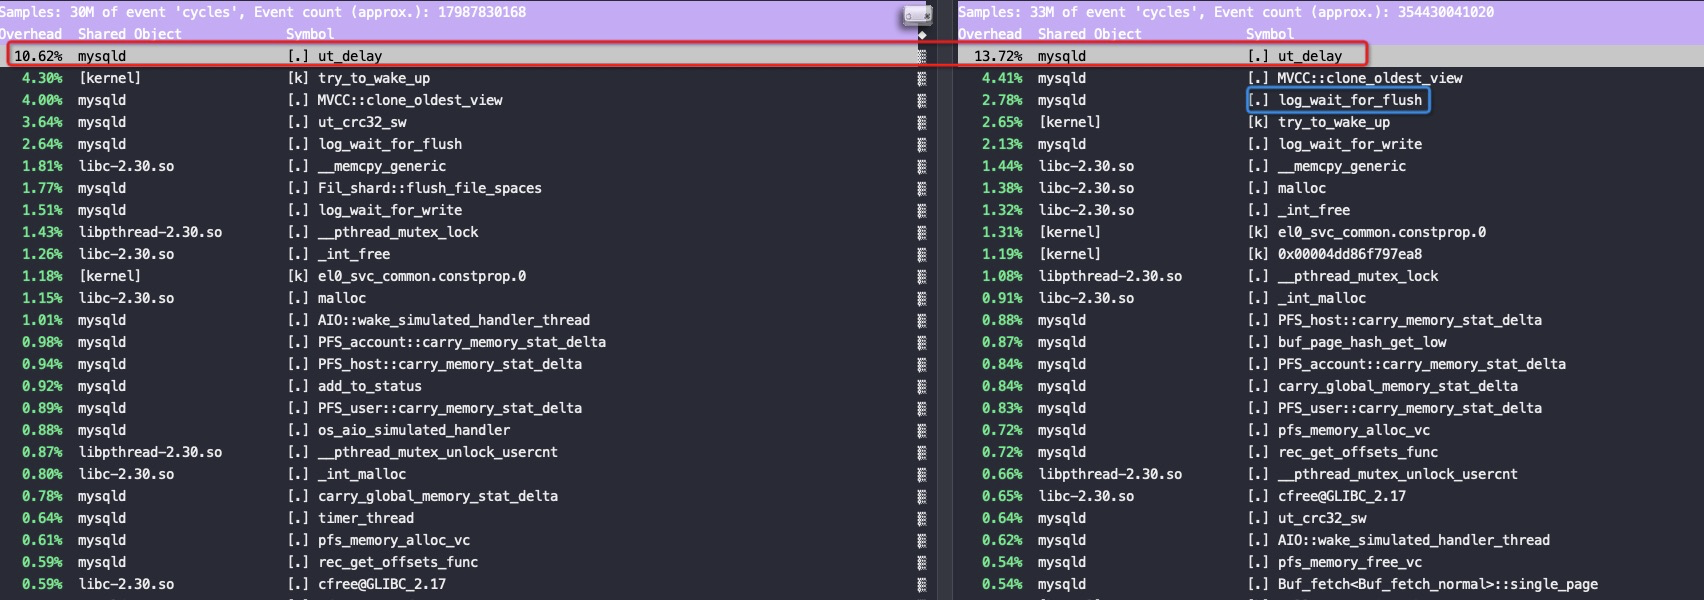
perf 使用
主要是通过采集 PMU(Performance Monitoring Unit – CPU内部提供)数据来做性能监控
Two logical cores can work through tasks more efficiently than a traditional single-threaded core. By taking advantage of idle time when the core would formerly be waiting for other tasks to complete, Intel® Hyper-Threading Technology improves CPU throughput (by up to 30% in server applications).
举个例子,如果一个线程运行过程中,必须要等到一些数据加载到缓存中以后才能继续执行,此时 CPU 就可以切换到另一个线程,去执行其他指令,而不用去处于空闲状态,等待当前线程的数据加载完毕。通常,一个传统的处理器在线程之间切换,可能需要几万个时钟周期。而一个具有 HT 超线程技术的处理器只需要 1 个时钟周期。因此就大大减小了线程之间切换的成本,从而最大限度地让处理器满负荷运转。
ARM芯片基本不做超线程,另外请思考为什么有了应用层的多线程切换还需要CPU层面的超线程?
超线程(Hyper-Threading)物理实现: 在CPU内部增加寄存器等硬件设施,但是ALU、译码器等关键单元还是共享。在一个物理 CPU 核心内部,会有双份的 PC 寄存器、指令寄存器乃至条件码寄存器。超线程的目的,是在一个线程 A 的指令,在流水线里停顿的时候,让另外一个线程去执行指令。因为这个时候,CPU 的译码器和 ALU 就空出来了,那么另外一个线程 B,就可以拿来干自己需要的事情。这个线程 B 可没有对于线程 A 里面指令的关联和依赖。
#dmidecode -t processor # dmidecode 3.0 Getting SMBIOS data from sysfs. SMBIOS 3.2.0 present. # SMBIOS implementations newer than version 3.0 are not # fully supported by this version of dmidecode.
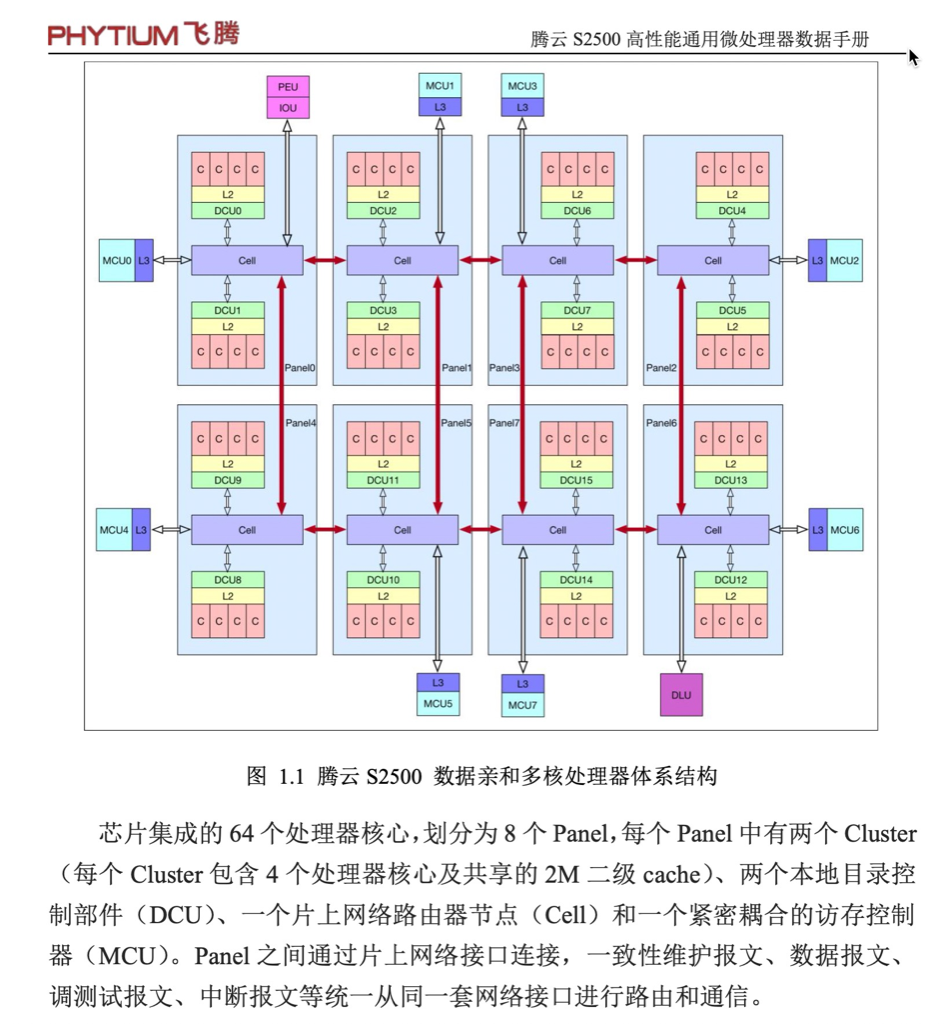
Handle 0x0004, DMI type 4, 48 bytes Processor Information Socket Designation: BGA3576 Type: Central Processor Family: <OUT OF SPEC> Manufacturer: PHYTIUM ID: 00 00 00 00 70 1F 66 22 Version: FT2500 Voltage: 0.8 V External Clock: 50 MHz Max Speed: 2100 MHz Current Speed: 2100 MHz Status: Populated, Enabled Upgrade: Other L1 Cache Handle: 0x0005 L2 Cache Handle: 0x0007 L3 Cache Handle: 0x0008 Serial Number: 1234567 Asset Tag: No Asset Tag Part Number: NULL Core Count: 64 Core Enabled: 64 Thread Count: 64 Characteristics: 64-bit capable Multi-Core Hardware Thread Execute Protection Enhanced Virtualization Power/Performance Control
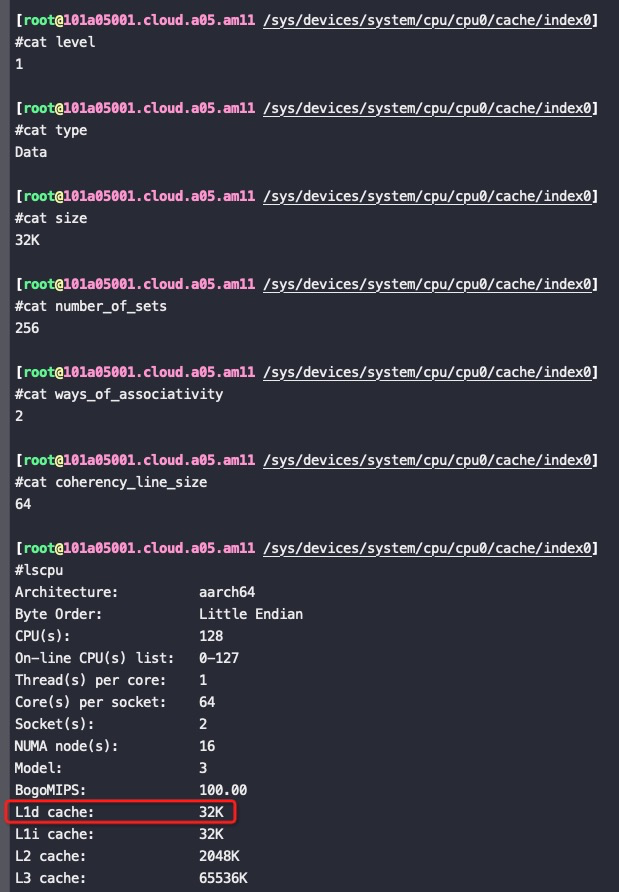
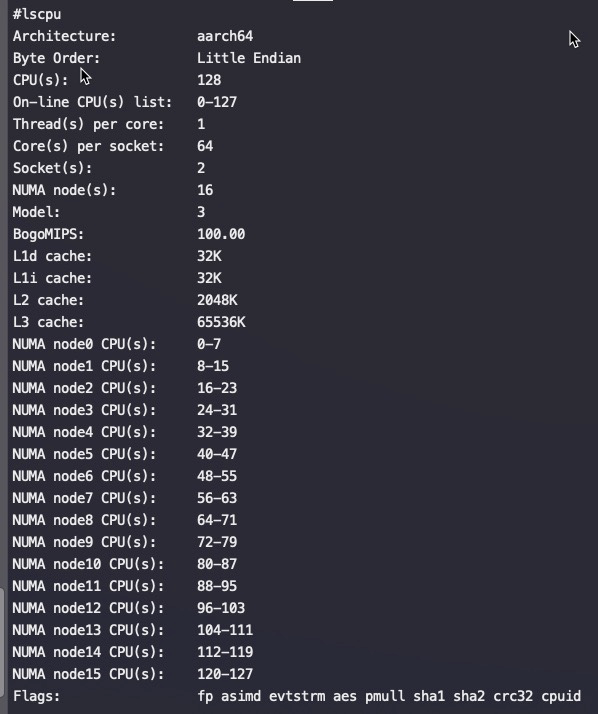
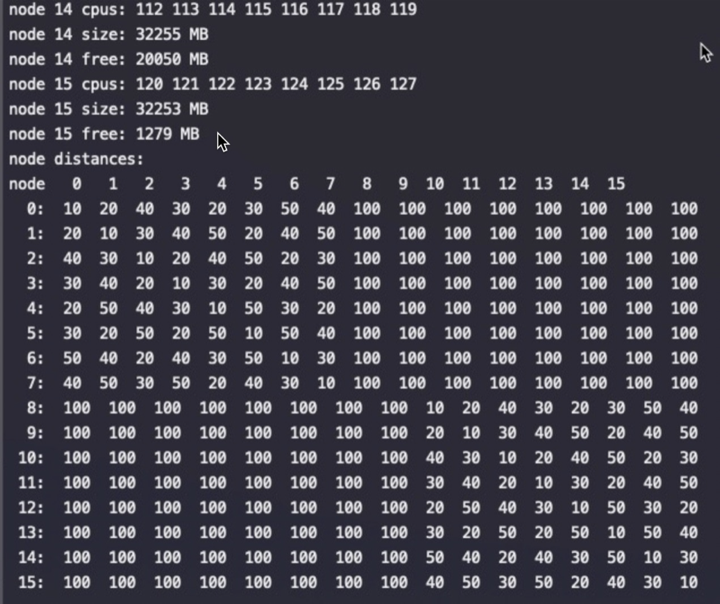
#lscpu
Architecture:          aarch64
Byte Order:            Little Endian
CPU(s):                128
On-line CPU(s) list:   0-127
Thread(s) per core:    1
Core(s) per socket:    64
Socket(s):             2
NUMA node(s):          16
Model:                 3
BogoMIPS:              100.00
L1d cache:             32K
L1i cache:             32K
L2 cache:              2048K
L3 cache:              65536K
NUMA node0 CPU(s):     0-7
NUMA node1 CPU(s):     8-15
NUMA node2 CPU(s):     16-23
NUMA node3 CPU(s):     24-31
NUMA node4 CPU(s):     32-39
NUMA node5 CPU(s):     40-47
NUMA node6 CPU(s):     48-55
NUMA node7 CPU(s):     56-63
NUMA node8 CPU(s):     64-71
NUMA node9 CPU(s):     72-79
NUMA node10 CPU(s):    80-87
NUMA node11 CPU(s):    88-95
NUMA node12 CPU(s):    96-103
NUMA node13 CPU(s):    104-111
NUMA node14 CPU(s):    112-119
NUMA node15 CPU(s):    120-127
Flags:                 fp asimd evtstrm aes pmull sha1 sha2 crc32 cpuid
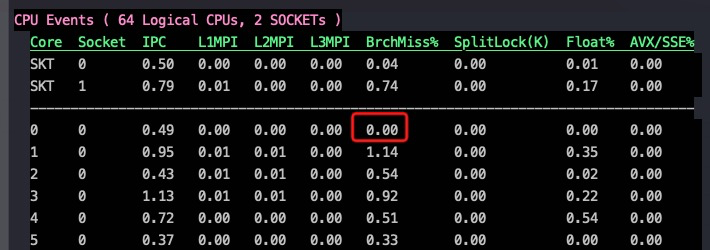
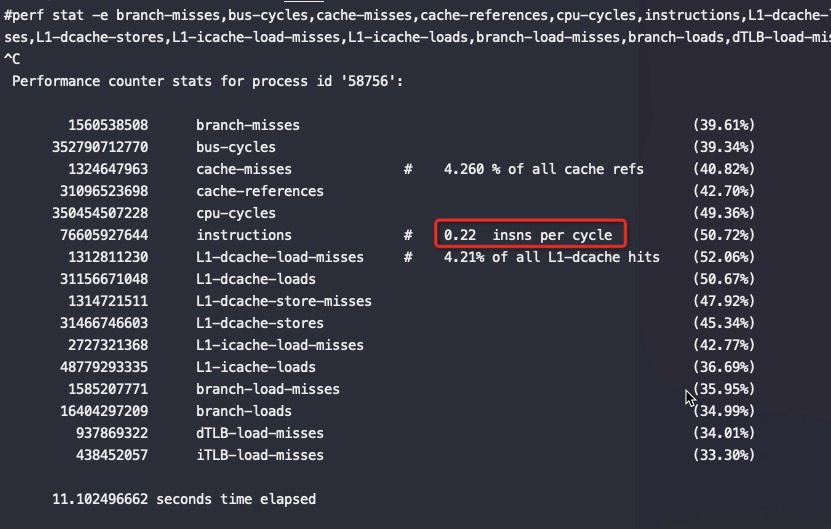
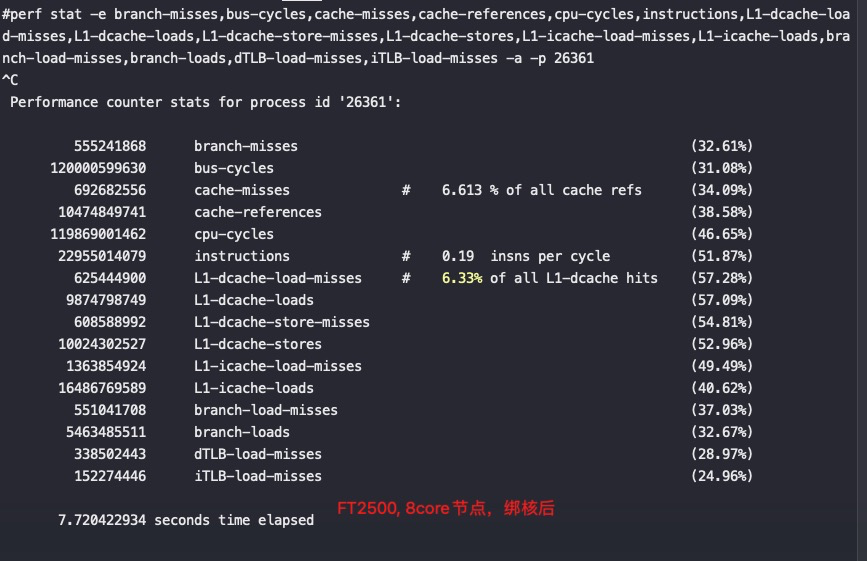
#perf stat -e branch-misses,bus-cycles,cache-misses,cache-references,cpu-cycles,instructions,L1-dcache-load-misses,L1-dcache-loads,L1-dcache-store-misses,L1-dcache-stores,L1-icache-load-misses,L1-icache-loads,branch-load-misses,branch-loads,dTLB-load-misses,iTLB-load-misses -a -p 79694 ^C Performance counter stats for process id '79694':
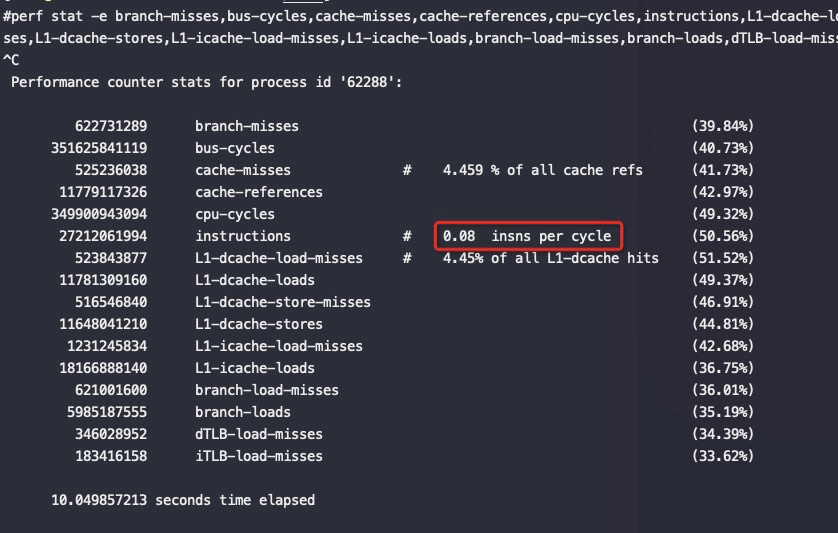
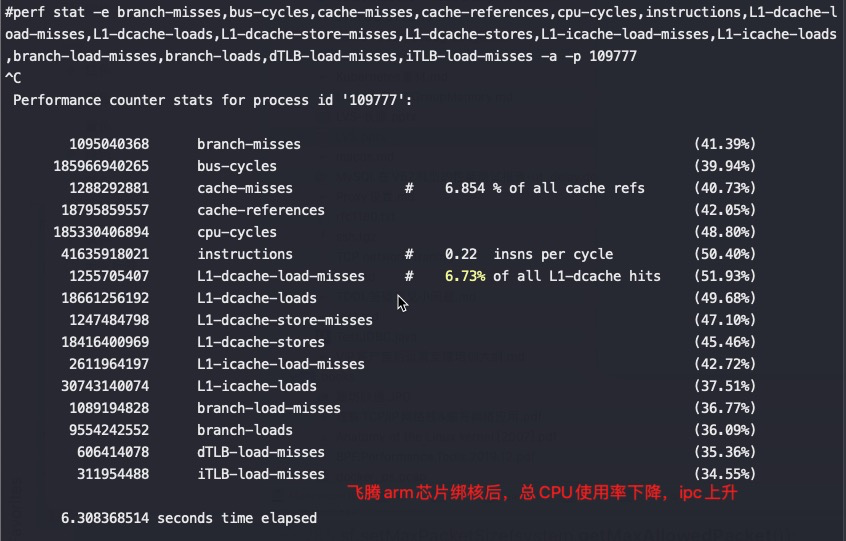
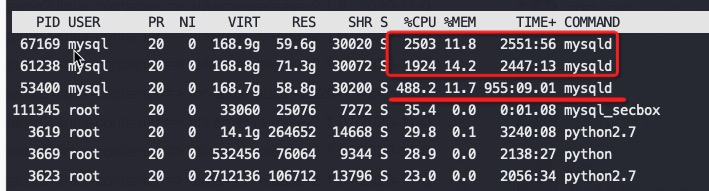
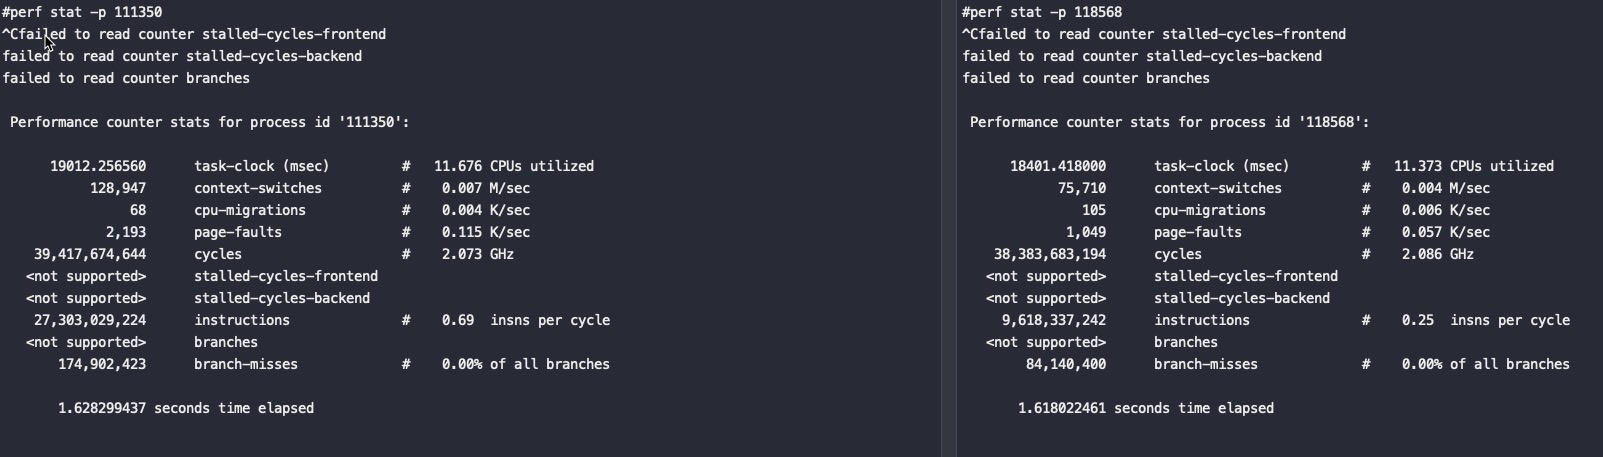
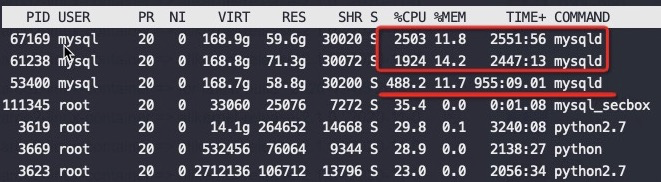
#第二个MySQL IPC只有第三个的30%多点,这就是为什么CPU高这么多,但是QPS差不多 perf stat -e branch-misses,bus-cycles,cache-misses,cache-references,cpu-cycles,instructions,L1-dcache-load-misses,L1-dcache-loads,L1-dcache-store-misses,L1-dcache-stores,L1-icache-load-misses,L1-icache-loads,branch-load-misses,branch-loads,dTLB-load-misses,iTLB-load-misses -a -p 61238 ^C Performance counter stats for process id '61238':
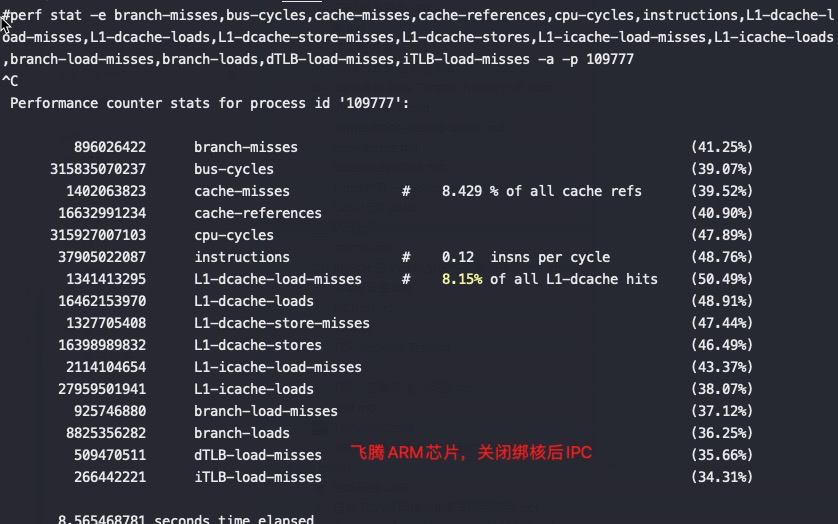
1.163750756 seconds time elapsed #第三个MySQL perf stat -e branch-misses,bus-cycles,cache-misses,cache-references,cpu-cycles,instructions,L1-dcache-load-misses,L1-dcache-loads,L1-dcache-store-misses,L1-dcache-stores,L1-icache-load-misses,L1-icache-loads,branch-load-misses,branch-loads,dTLB-load-misses,iTLB-load-misses -a -p 53400 ^C Performance counter stats for process id '53400':
#第二个 MySQL IPC只有第三个的30%多点,这就是为什么CPU高这么多,但是QPS差不多 perf stat -e branch-misses,bus-cycles,cache-misses,cache-references,cpu-cycles,instructions,L1-dcache-load-misses,L1-dcache-loads,L1-dcache-store-misses,L1-dcache-stores,L1-icache-load-misses,L1-icache-loads,branch-load-misses,branch-loads,dTLB-load-misses,iTLB-load-misses -a -p 61238 ^C Performance counter stats for process id '61238':
#第三个 MySQL perf stat -e branch-misses,bus-cycles,cache-misses,cache-references,cpu-cycles,instructions,L1-dcache-load-misses,L1-dcache-loads,L1-dcache-store-misses,L1-dcache-stores,L1-icache-load-misses,L1-icache-loads,branch-load-misses,branch-loads,dTLB-load-misses,iTLB-load-misses -a -p 53400 ^C Performance counter stats for process id '53400':
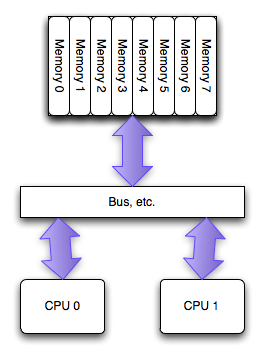
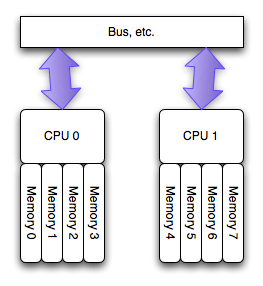
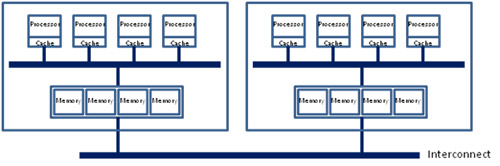
Modern multiprocessor systems mix these basic architectures as seen in the following diagram:
In this complex hierarchical scheme, processors are grouped by their physical location on one or the other multi-core CPU package or “node.” Processors within a node share access to memory modules as per the UMA shared memory architecture. At the same time, they may also access memory from the remote node using a shared interconnect, but with slower performance as per the NUMA shared memory architecture.
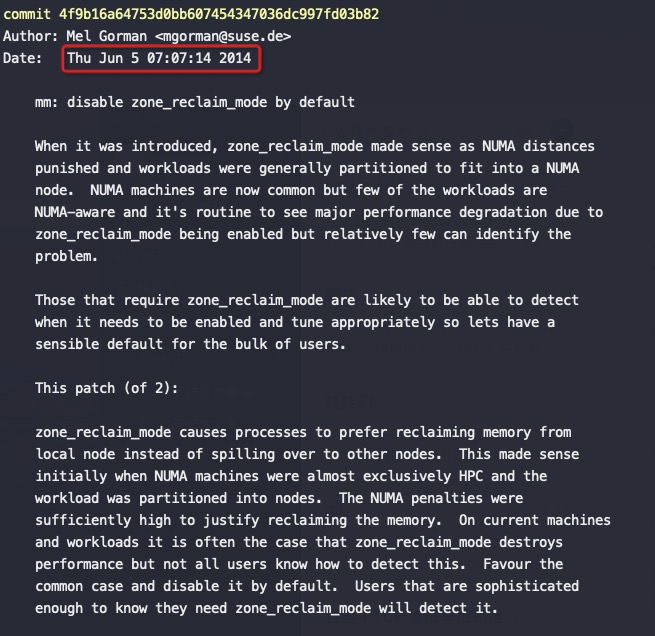
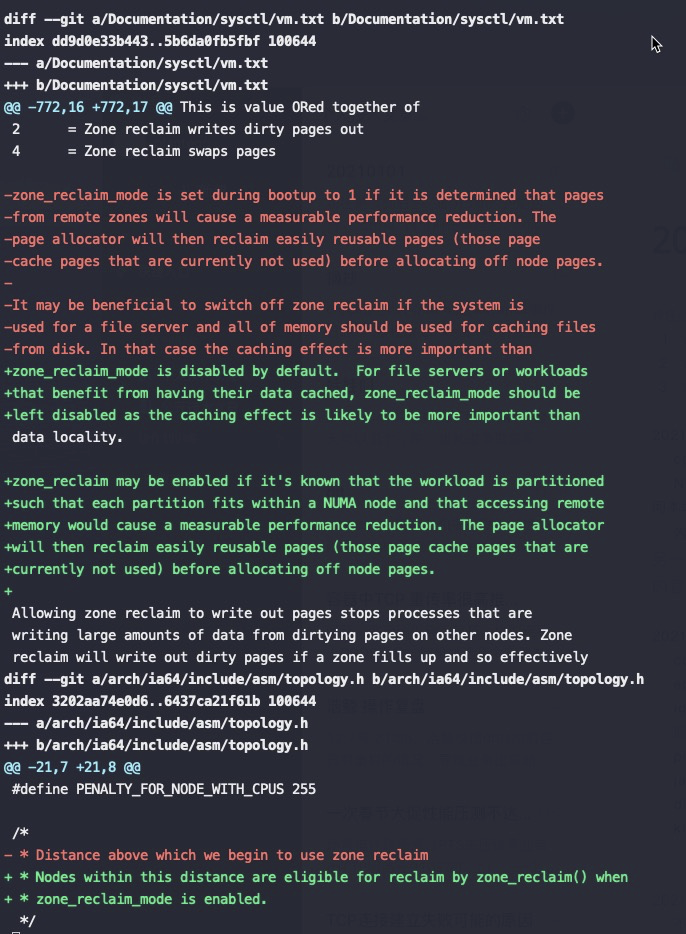
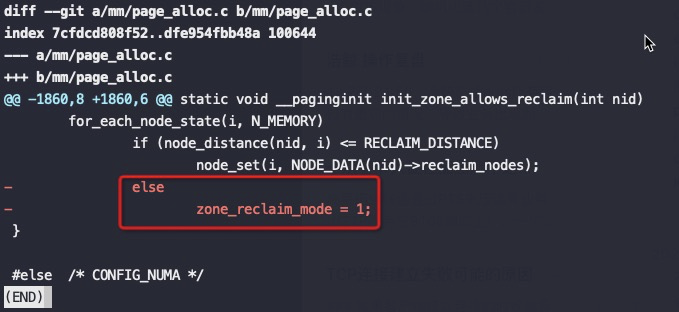
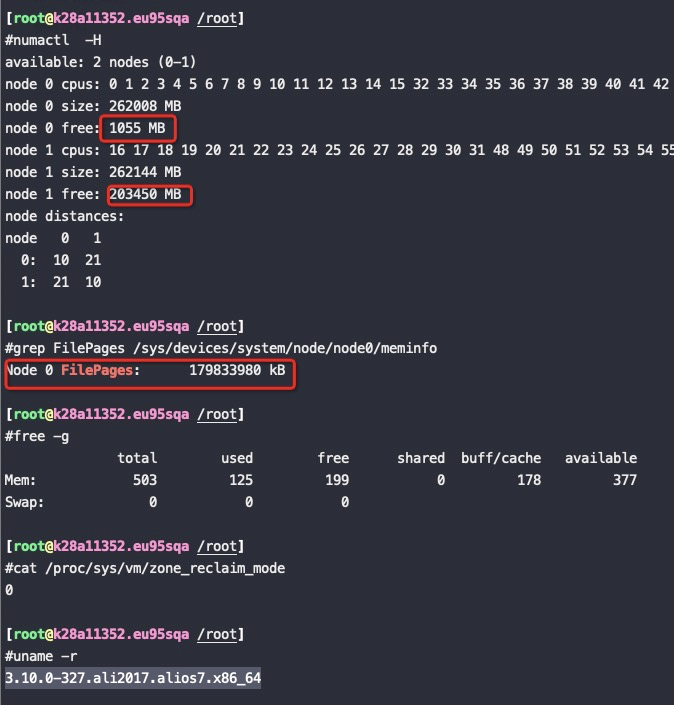
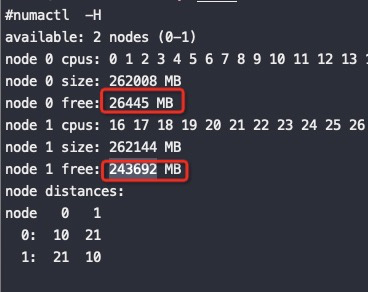
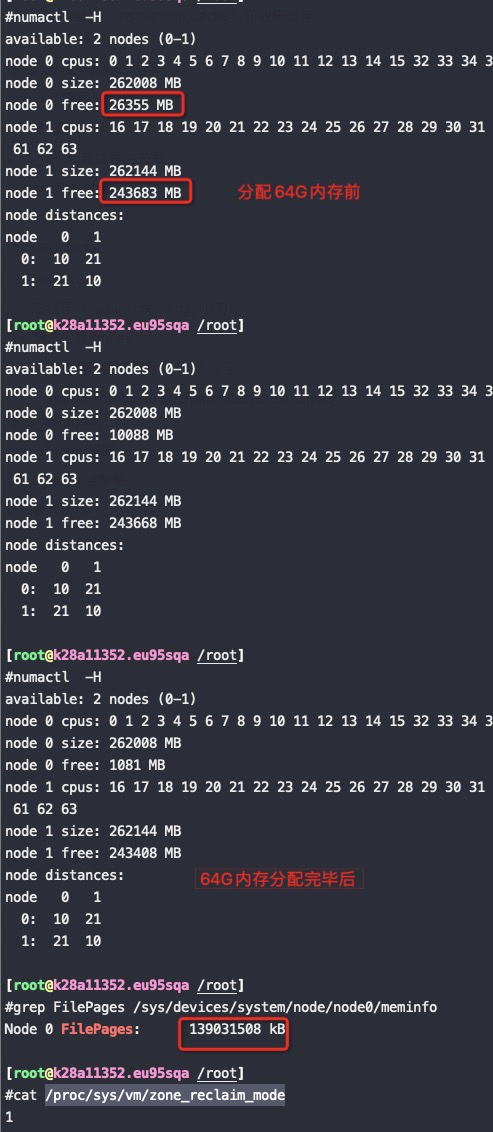
Zone_reclaim_mode allows someone to set more or less aggressive approaches to reclaim memory when a zone runs out of memory. If it is set to zero then no zone reclaim occurs. Allocations will be satisfied from other zones / nodes in the system.
zone_reclaim_mode的四个参数值的意义分别是:
0 = Allocate from all nodes before reclaiming memory 1 = Reclaim memory from local node vs allocating from next node 2 = Zone reclaim writes dirty pages out 4 = Zone reclaim swaps pages
Automatic NUMA balancing improves the performance of applications running on NUMA hardware systems. It is enabled by default on Red Hat Enterprise Linux 7 systems.
An application will generally perform best when the threads of its processes are accessing memory on the same NUMA node as the threads are scheduled. Automatic NUMA balancing moves tasks (which can be threads or processes) closer to the memory they are accessing. It also moves application data to memory closer to the tasks that reference it. This is all done automatically by the kernel when automatic NUMA balancing is active.
#perf stat -e sched:sched_stick_numa,sched:sched_move_numa,sched:sched_swap_numa,migrate:mm_migrate_pages,minor-faults -p 7191 Performance counter stats for process id '7191':
0 sched:sched_stick_numa (100.00%) 1 sched:sched_move_numa (100.00%) 0 sched:sched_swap_numa 0 migrate:mm_migrate_pages 286 minor-faults # perf stat -e sched:sched_stick_numa,sched:sched_move_numa,sched:sched_swap_numa,migrate:mm_migrate_pages,minor-faults -p PID ... 1 sched:sched_stick_numa 3 sched:sched_move_numa 41 sched:sched_swap_numa 5,239 migrate:mm_migrate_pages 50,161 minor-faults #perf stat -e sched:sched_stick_numa,sched:sched_move_numa,sched:sched_swap_numa,migrate:mm_migrate_pages,minor-faults -p 676322 Performance counter stats for process id '676322':
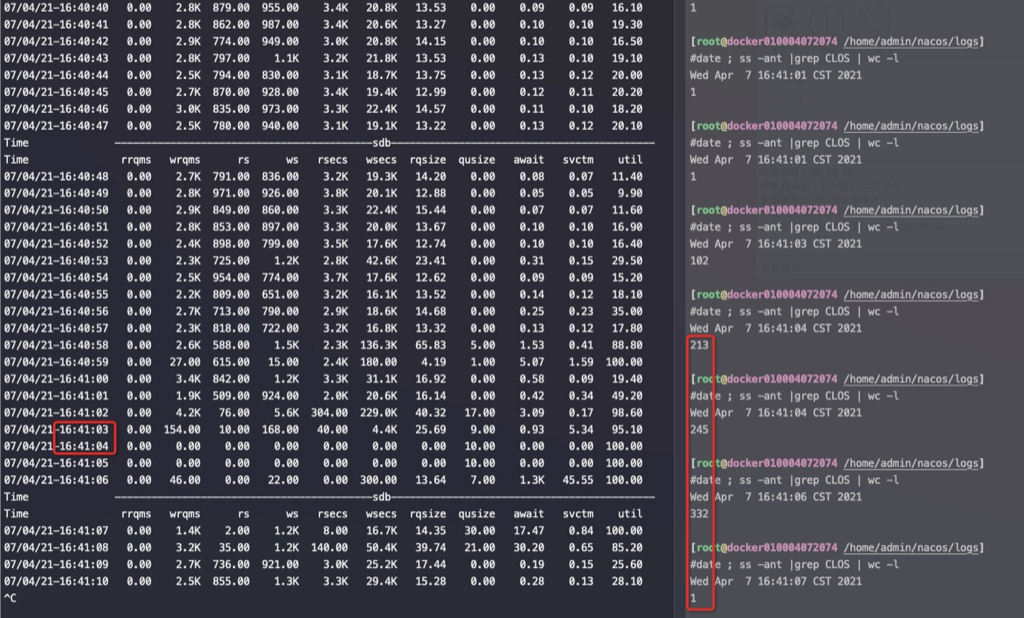
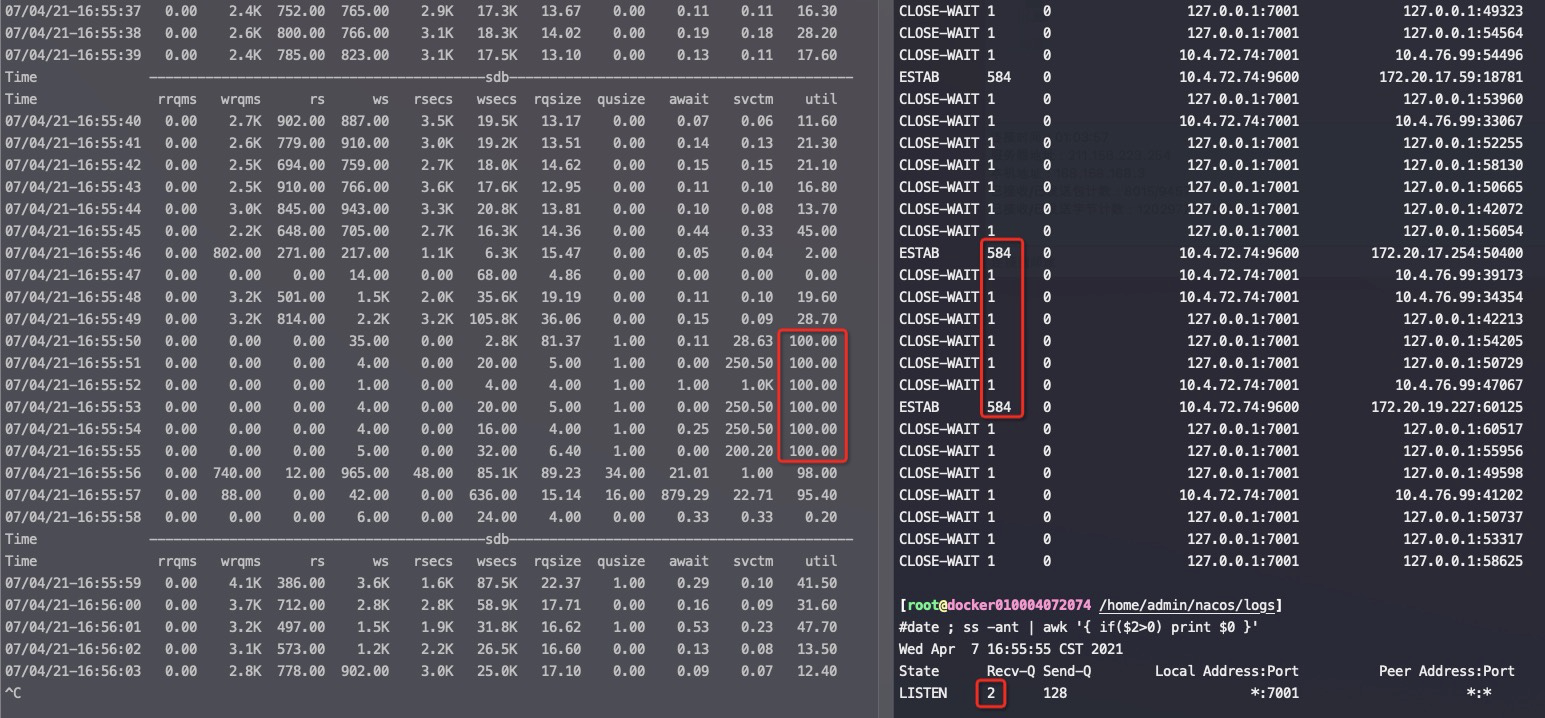
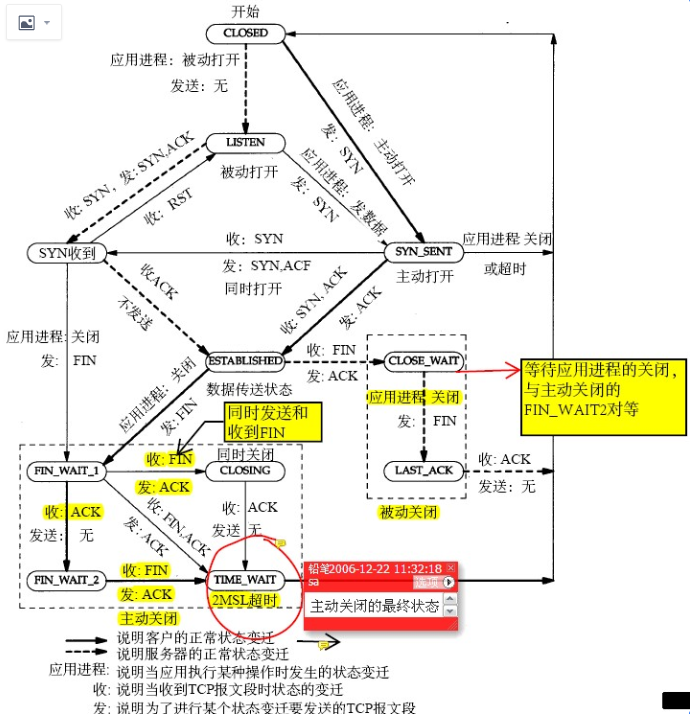
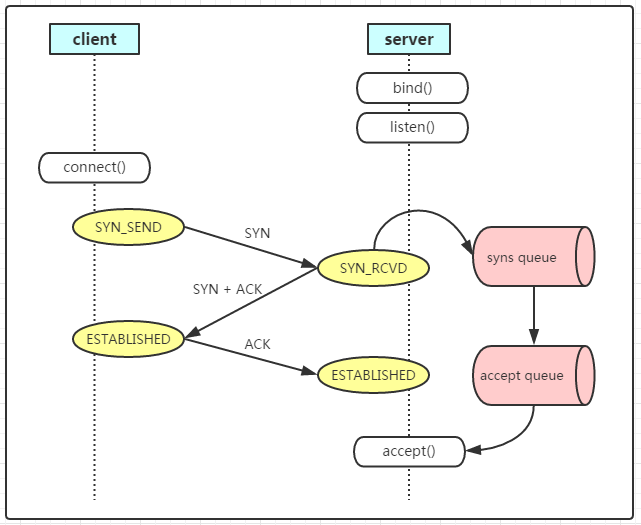
答: 能,这个时候在client和server两边看到的连接状态都是 ESTABLISHED,只是Server上的全连接队列占用加1。连接握手并切换到ESTABLISHED状态都是由OS来负责的,应用不参与,ESTABLISHED后应用才能accept,进而收发数据。也就是能放入到全连接队列里面的连接肯定都是 ESTABLISHED 状态的了
接着上面的问题,如果新连接继续连接进而全连接队列满了呢?
答:那就连不上了,server端的OS因为全连接队列满了直接扔掉第一个syn握手包,这个时候连接在client端是SYN_SENT,Server端没有这个连接,这是因为syn到server端就直接被OS drop 了。
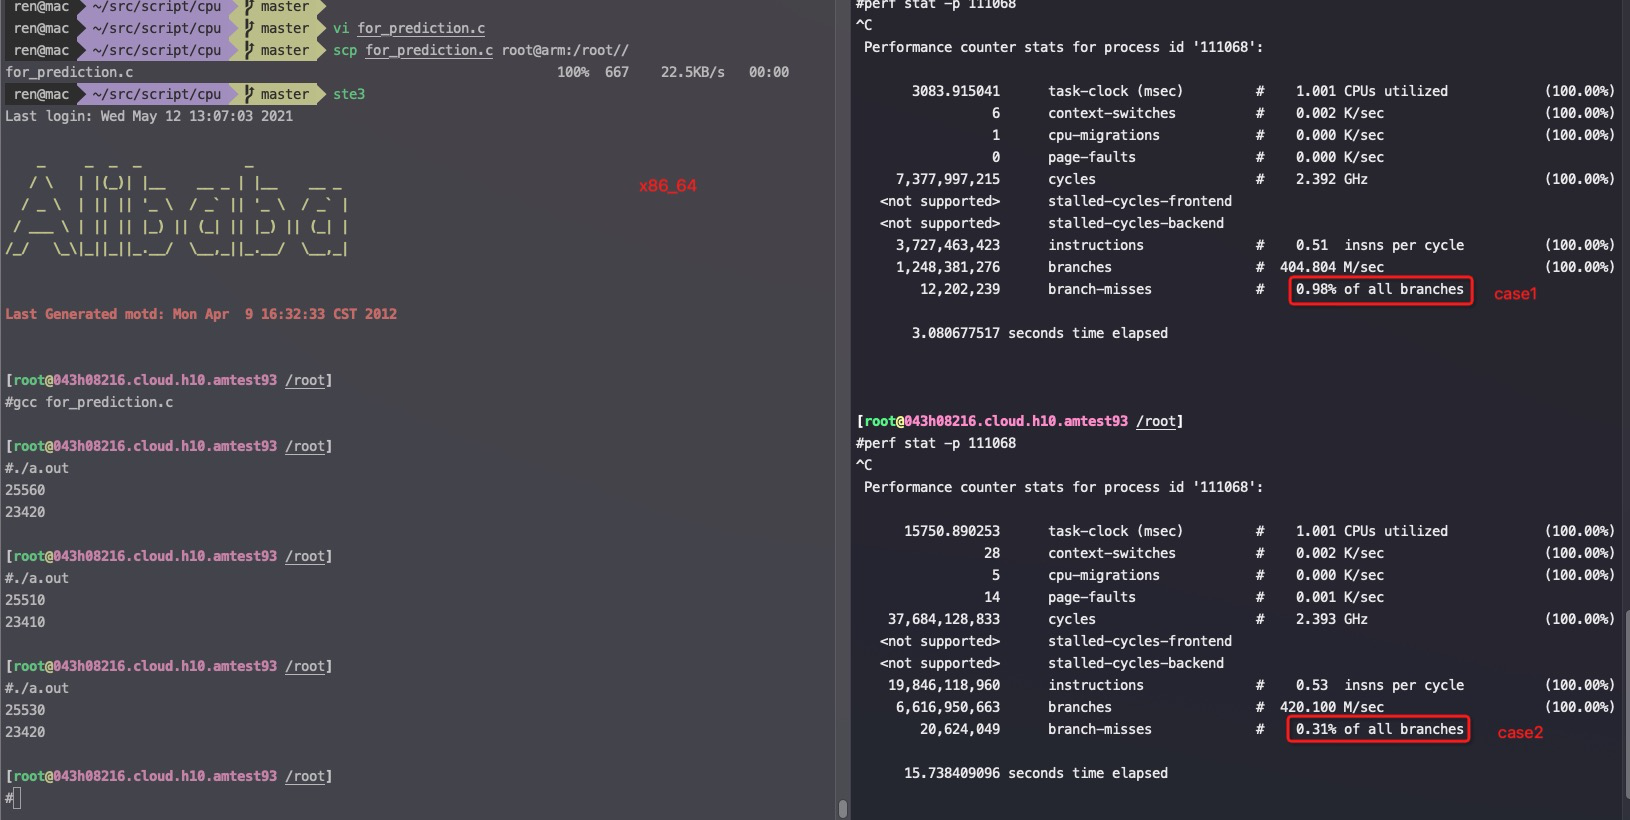
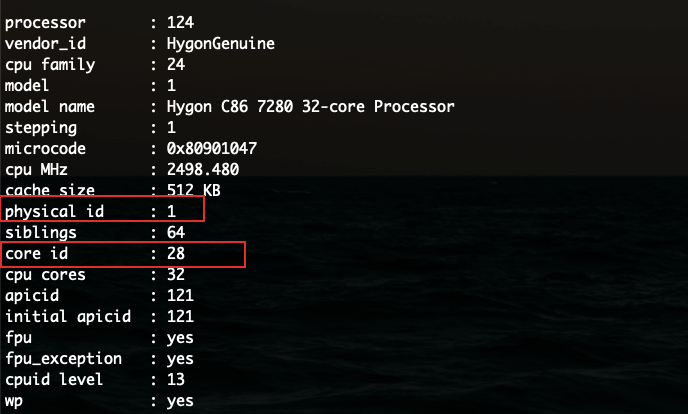
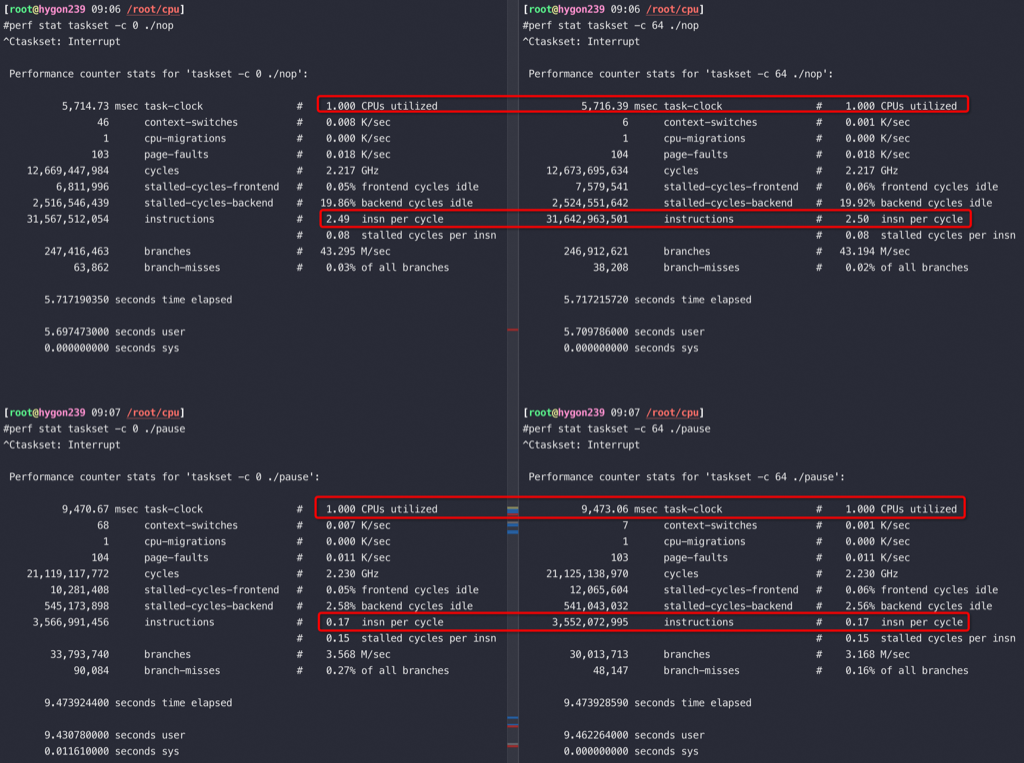
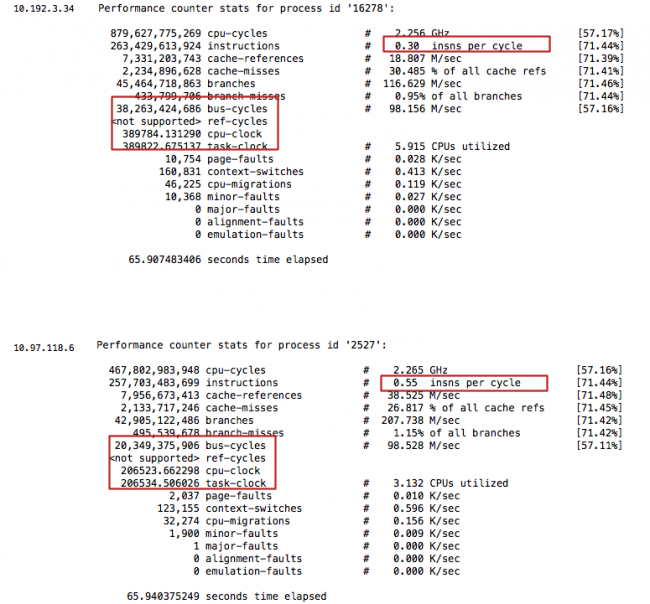
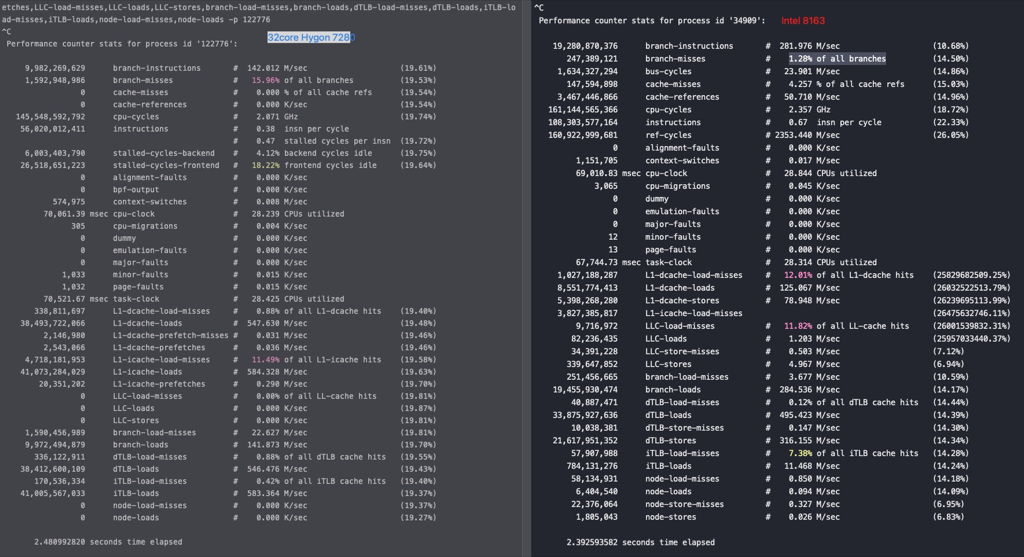
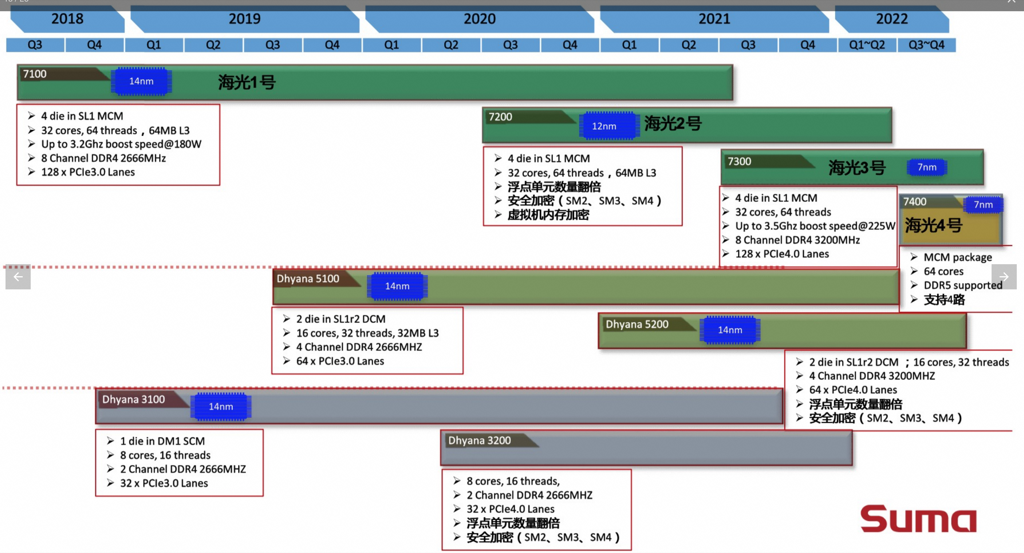
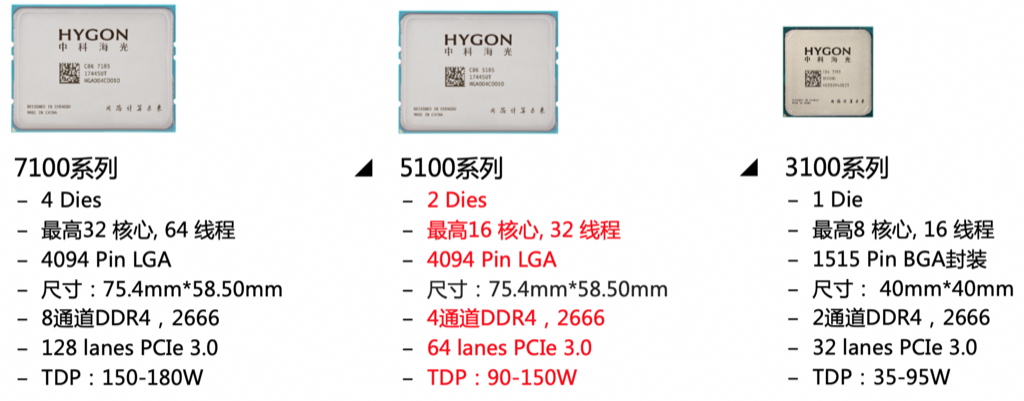
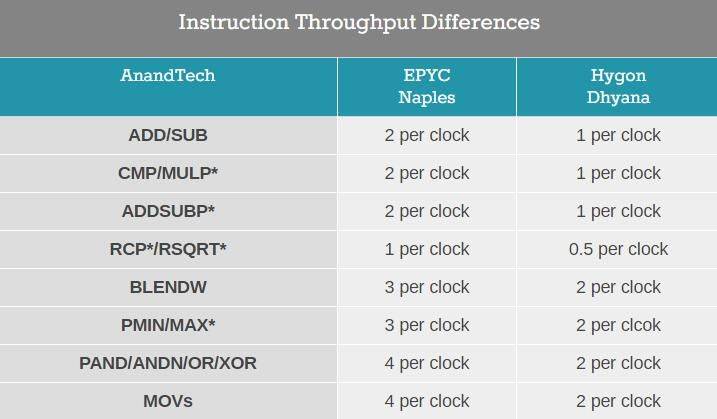
由于在 Zen 1 的基础上进行了大量的修改,海光 CPU 可以不用简单地称之为换壳 AMD 处理器了。但其性能相比同代原版 CPU 略差:整数性能基本相同,浮点性能显著降低——普通指令吞吐量只有基准水平的一半。海光 CPU 的随机数生成机制也被修改,加密引擎已被替换,不再对常见的 AES 指令进行加速,但覆盖了其他面向国内安全性的指令如 SM2、SM3 和 SM4。
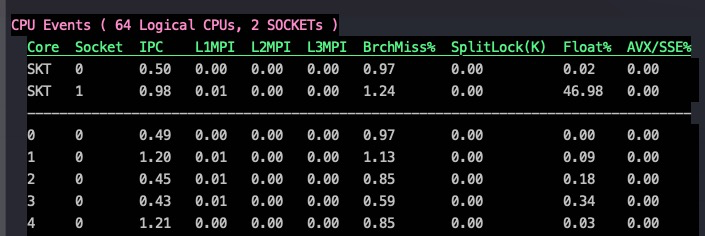
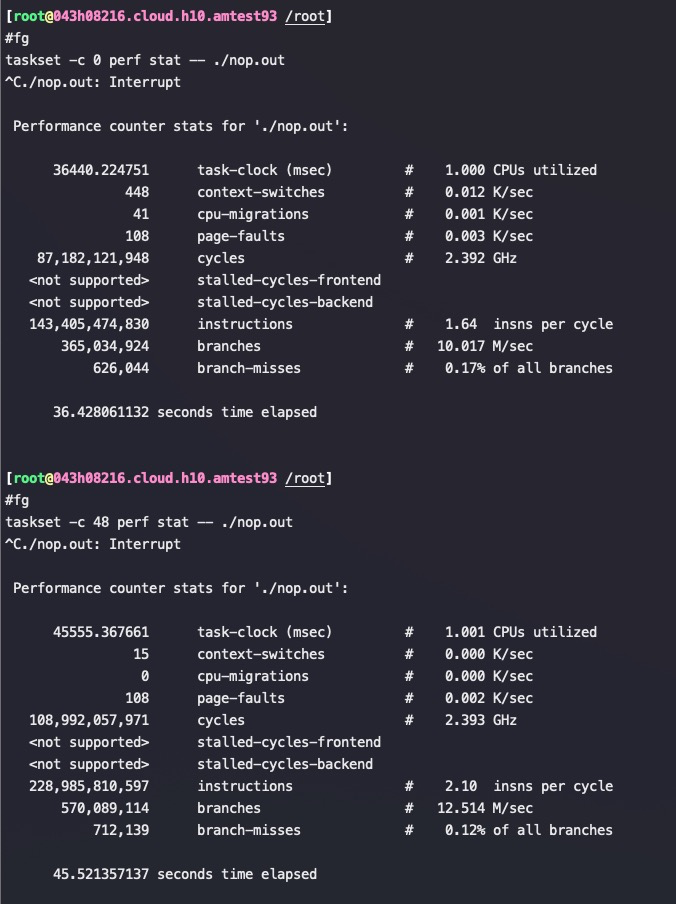
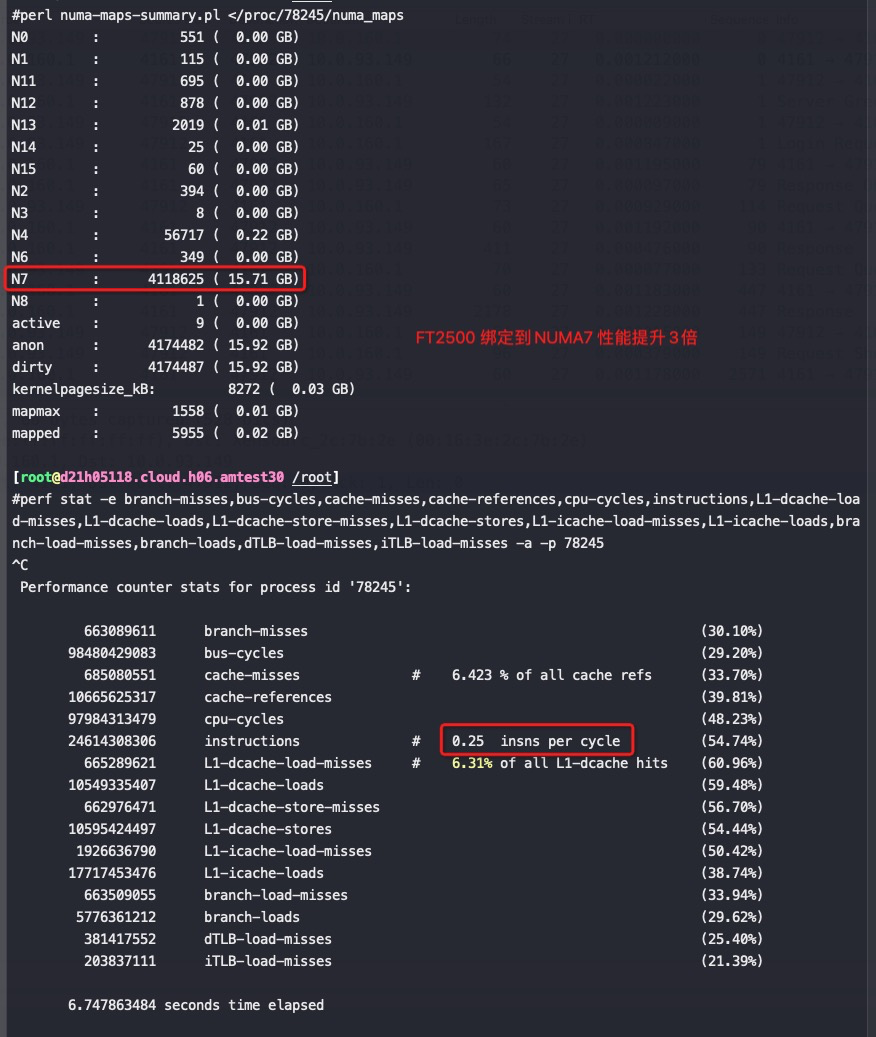
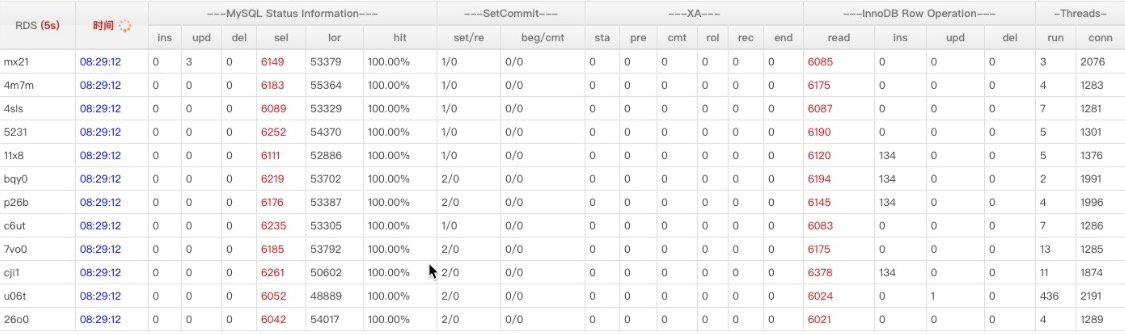
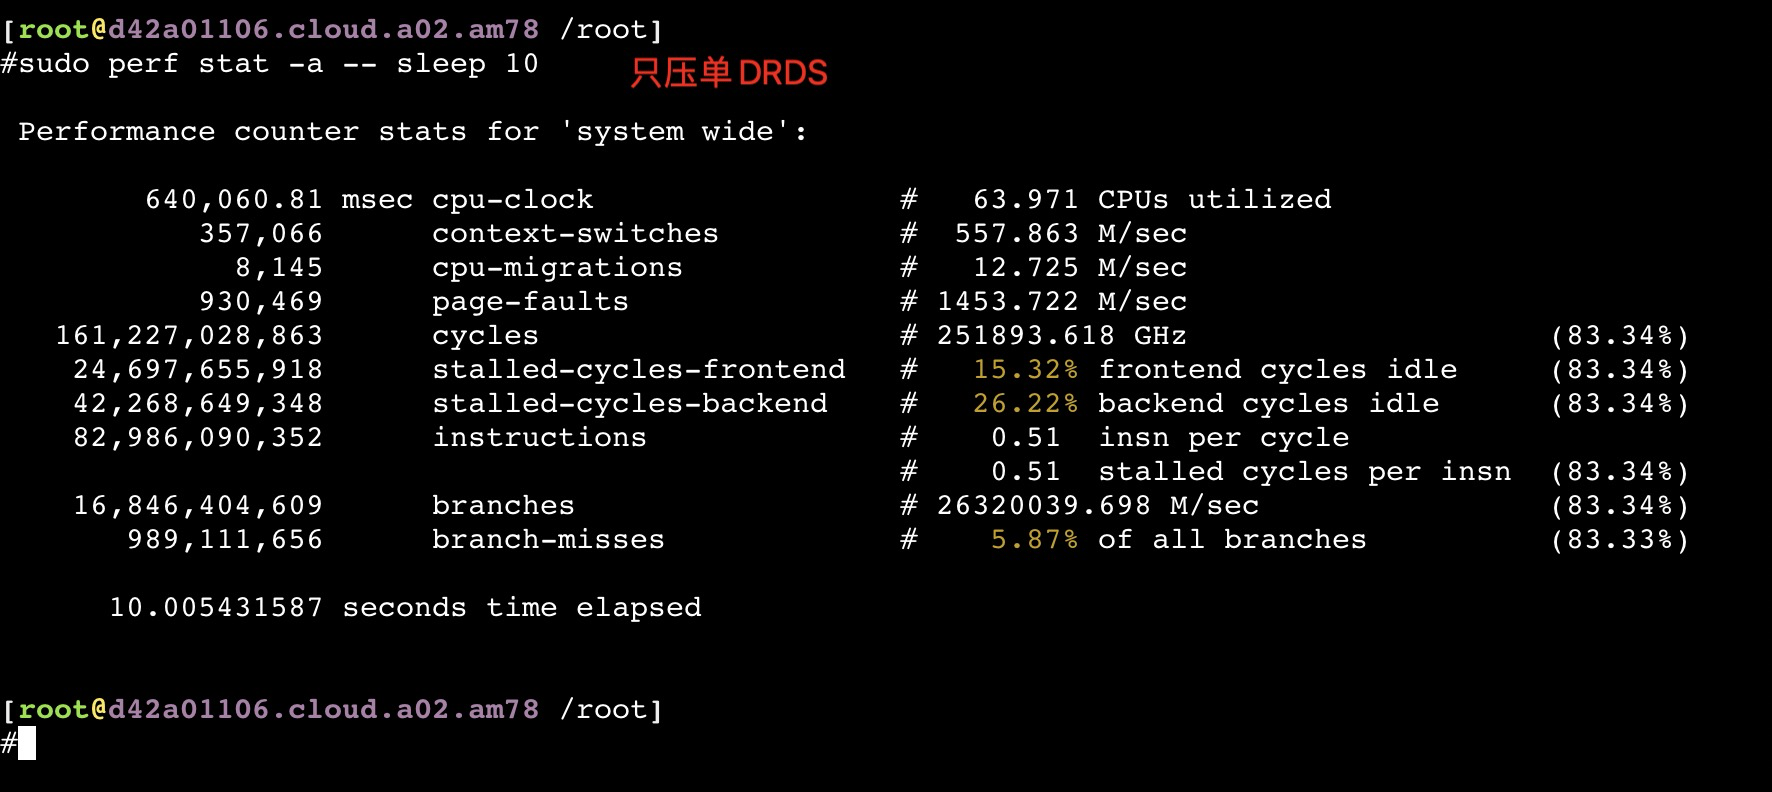
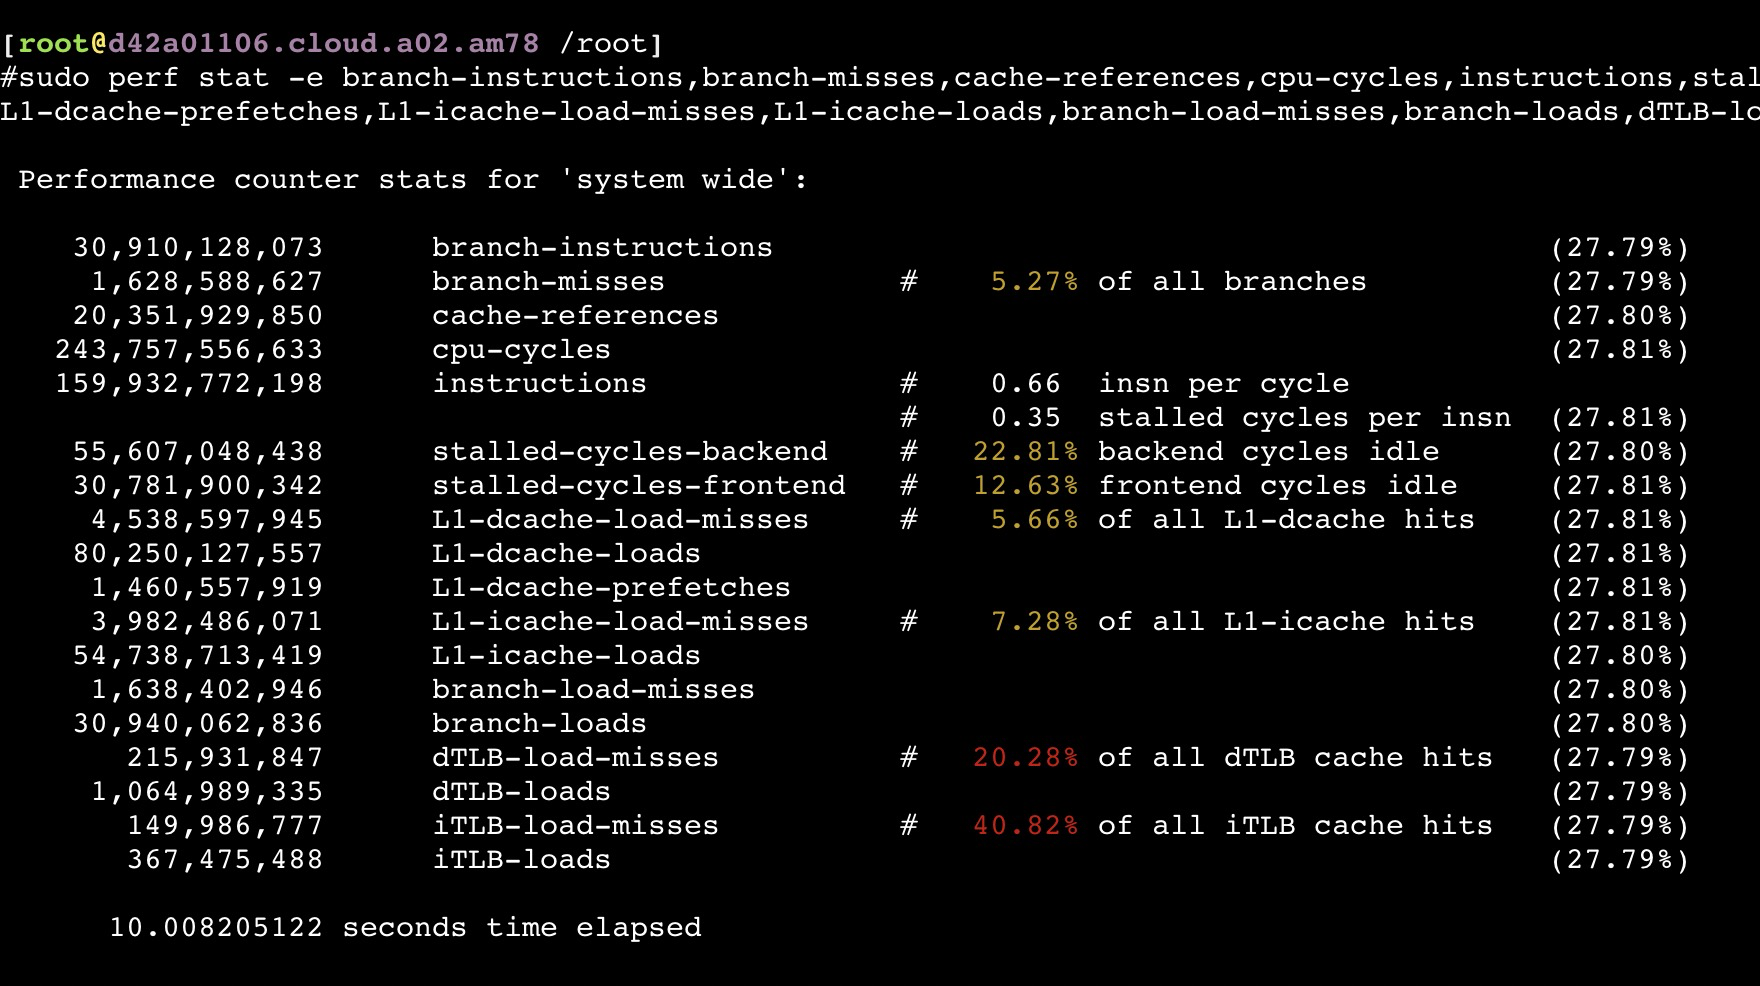
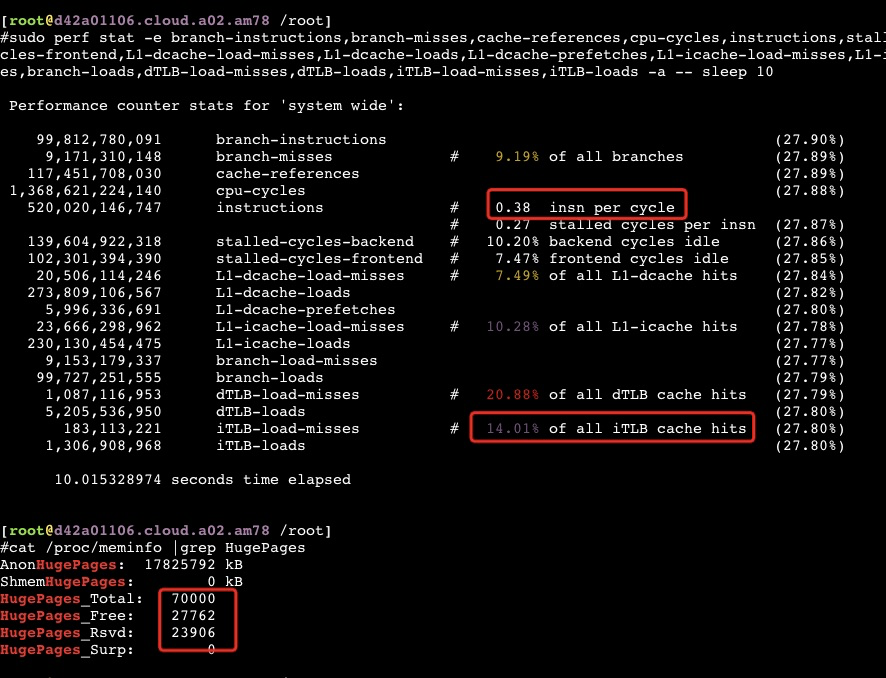
从以上截图,可以看到关键的 insn per cycle 能到0.51和0.66(这个数值越大性能越好)
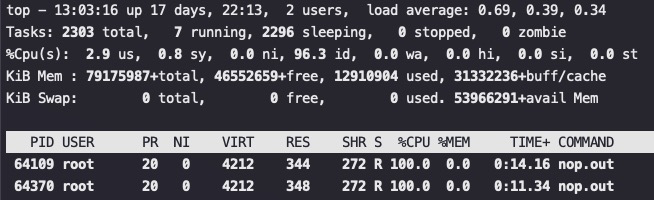
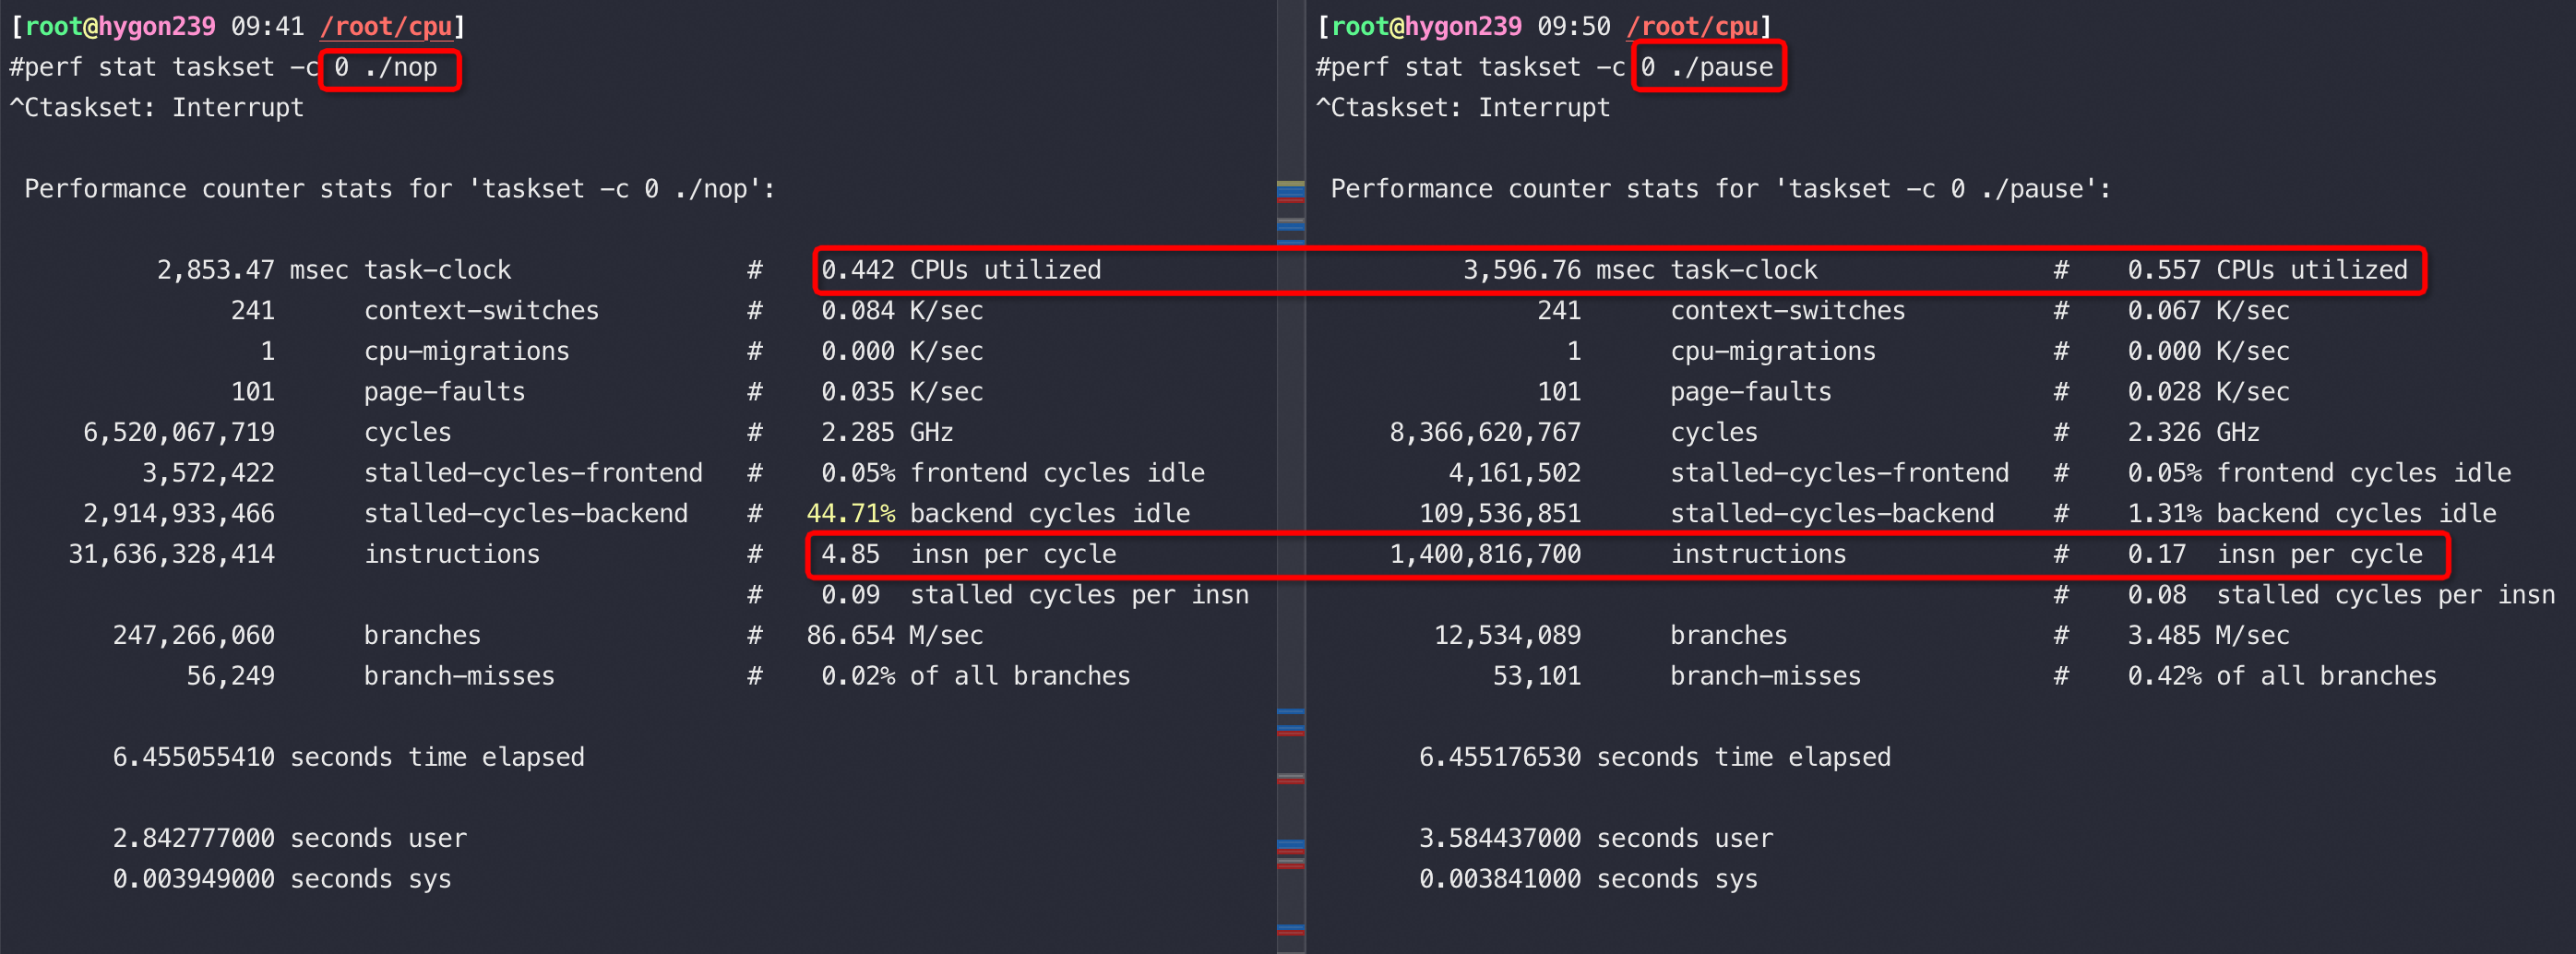
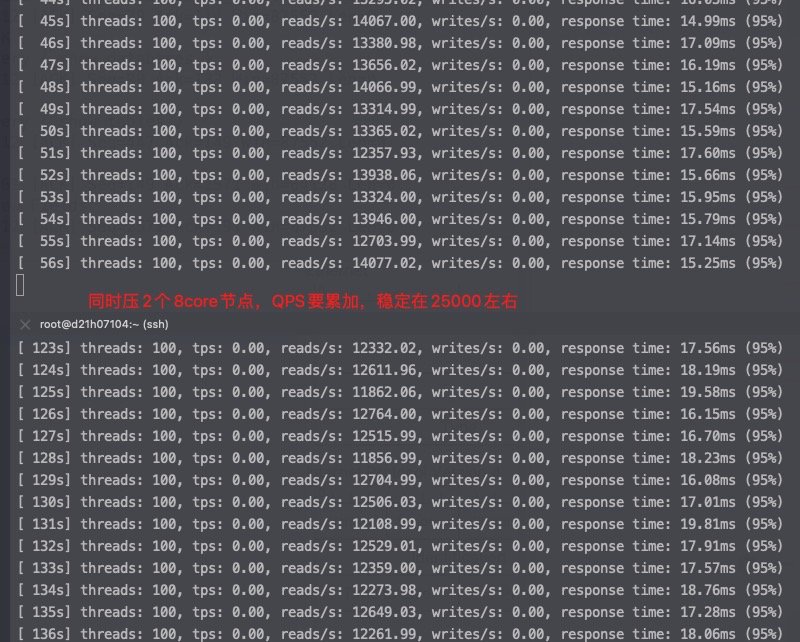
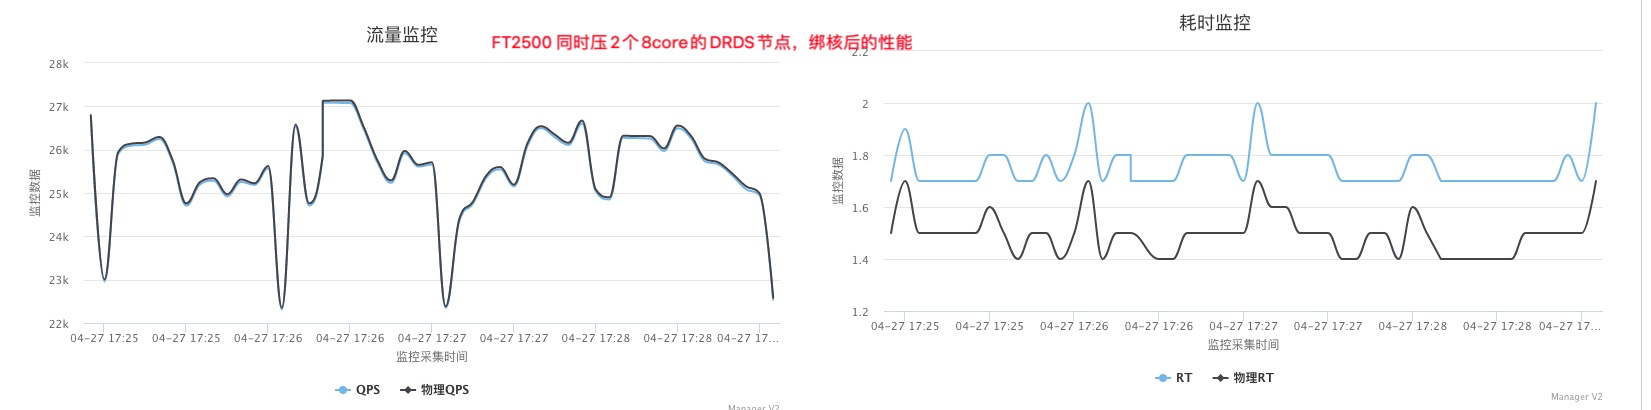
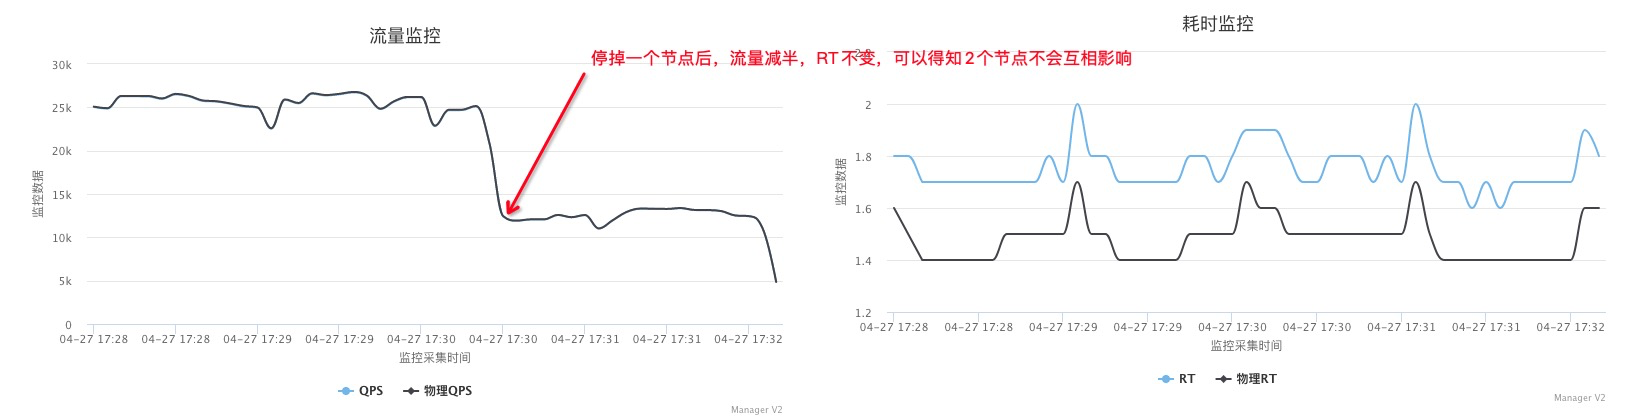
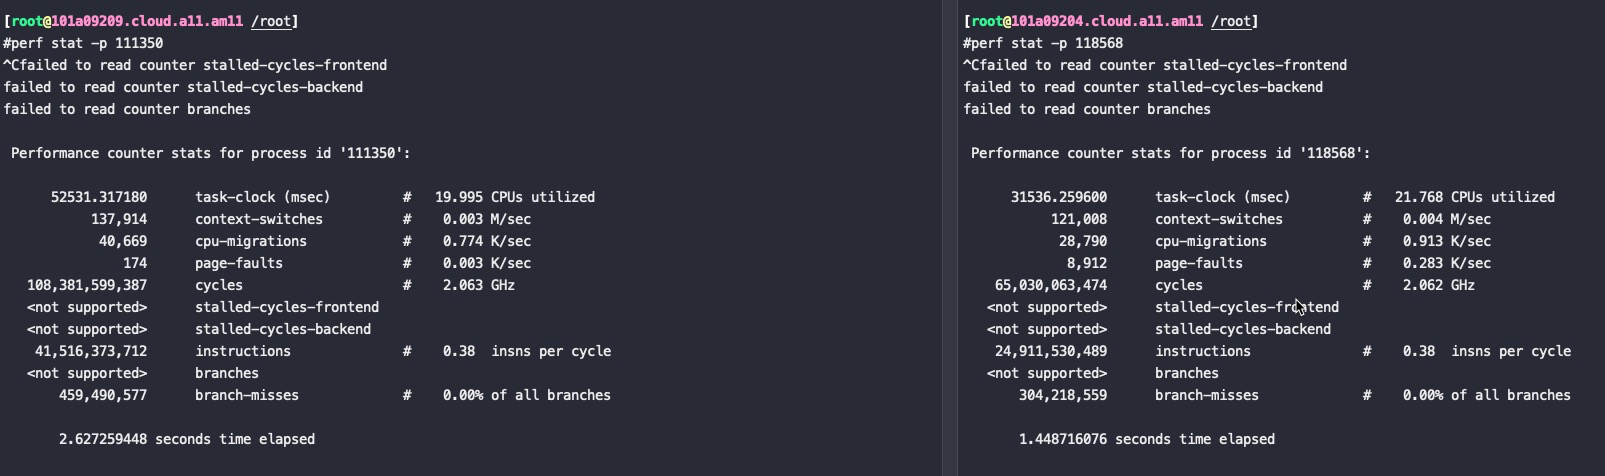
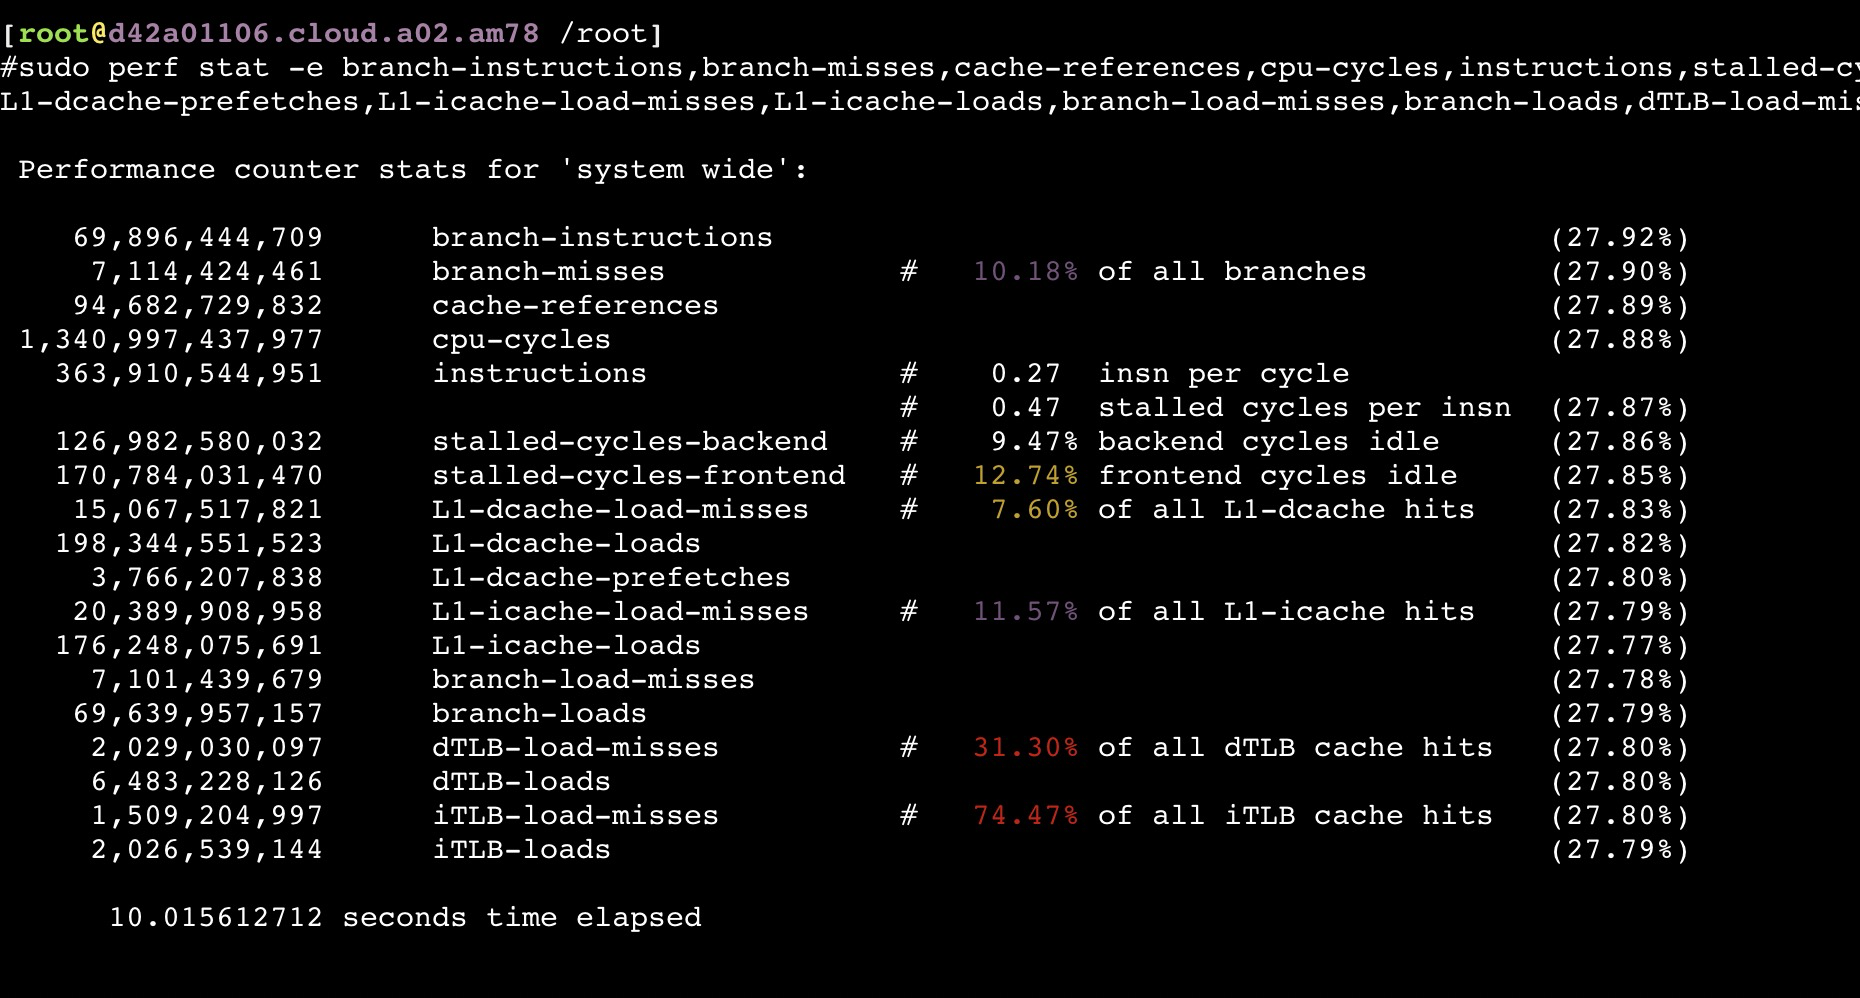
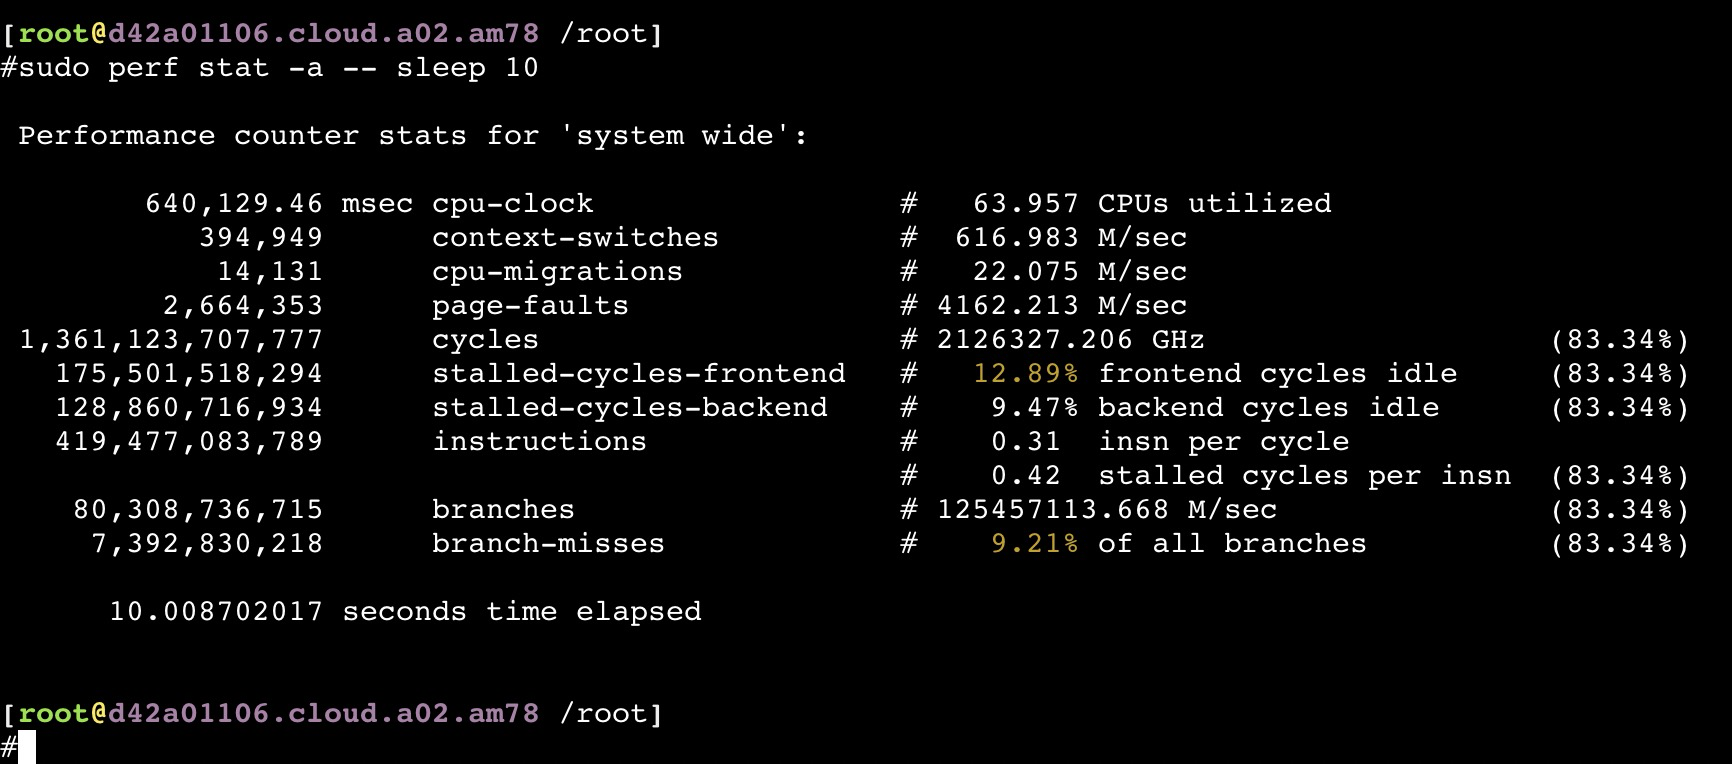
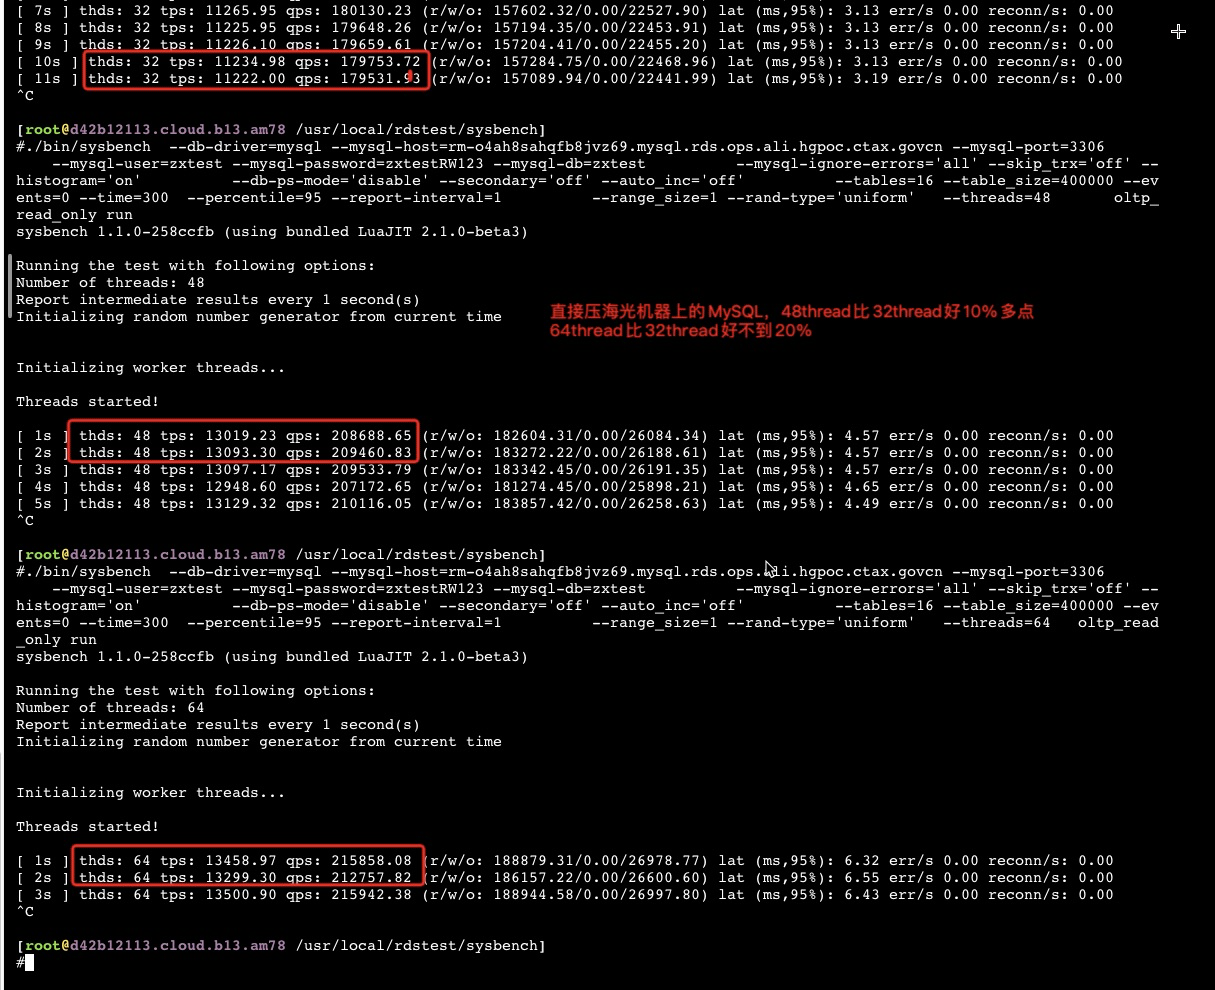
如果同时压物理机上的所有服务节点
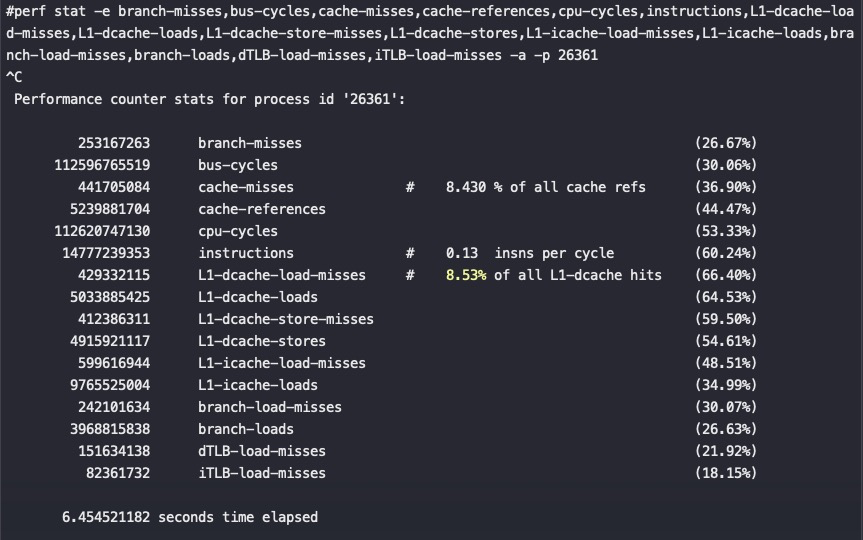
从以上截图,可以看到关键的 insn per cycle 能降到了0.27和0.31(这个数值越大性能越好),基本相当于单压的5折
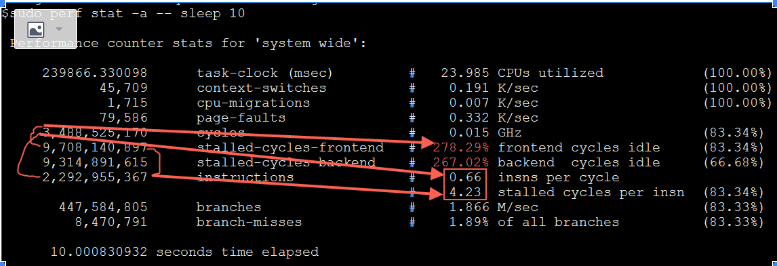
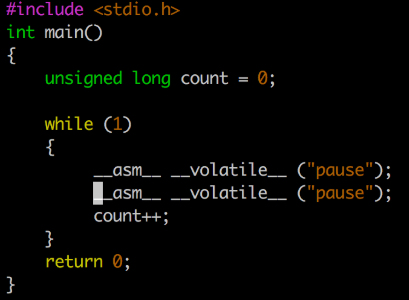
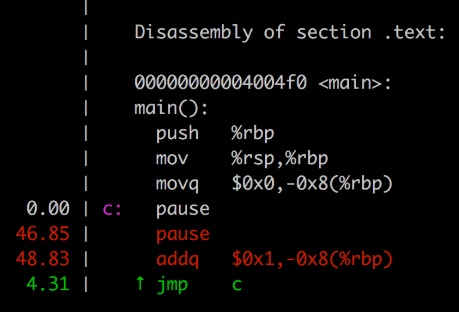
通过 perf list 找出所有Hardware event,然后对他们进行perf:
1
sudo perf stat -e branch-instructions,branch-misses,cache-references,cpu-cycles,instructions,stalled-cycles-backend,stalled-cycles-frontend,L1-dcache-load-misses,L1-dcache-loads,L1-dcache-prefetches,L1-icache-load-misses,L1-icache-loads,branch-load-misses,branch-loads,dTLB-load-misses,dTLB-loads,iTLB-load-misses,iTLB-loads -a -- `pidof java`
If you are using the option -XX:+UseSHM or -XX:+UseHugeTLBFS, then specify the number of large pages. In the following example, 3 GB of a 4 GB system are reserved for large pages (assuming a large page size of 2048kB, then 3 GB = 3 * 1024 MB = 3072 MB = 3072 * 1024 kB = 3145728 kB and 3145728 kB / 2048 kB = 1536):
#taskset -c 1,53 /usr/bin/sysbench --num-threads=2 --test=cpu --cpu-max-prime=50000 run sysbench 0.5: multi-threaded system evaluation benchmark
Running the test with following options: Number of threads: 2 Random number generator seed is 0 and will be ignored
Primer numbers limit: 50000
Threads started!
General statistics: total time: 48.5571s total number of events: 10000 total time taken by event execution: 97.0944s response time: min: 8.29ms avg: 9.71ms max: 20.88ms approx. 95 percentile: 9.71ms
Threads fairness: events (avg/stddev): 5000.0000/2.00 execution time (avg/stddev): 48.5472/0.01
#taskset -c 1 /usr/bin/sysbench --num-threads=1 --test=cpu --cpu-max-prime=50000 run sysbench 0.5: multi-threaded system evaluation benchmark
Running the test with following options: Number of threads: 1 Random number generator seed is 0 and will be ignored
Primer numbers limit: 50000
Threads started!
General statistics: total time: 83.2642s total number of events: 10000 total time taken by event execution: 83.2625s response time: min: 8.27ms avg: 8.33ms max: 10.03ms approx. 95 percentile: 8.36ms
Threads fairness: events (avg/stddev): 10000.0000/0.00 execution time (avg/stddev): 83.2625/0.00
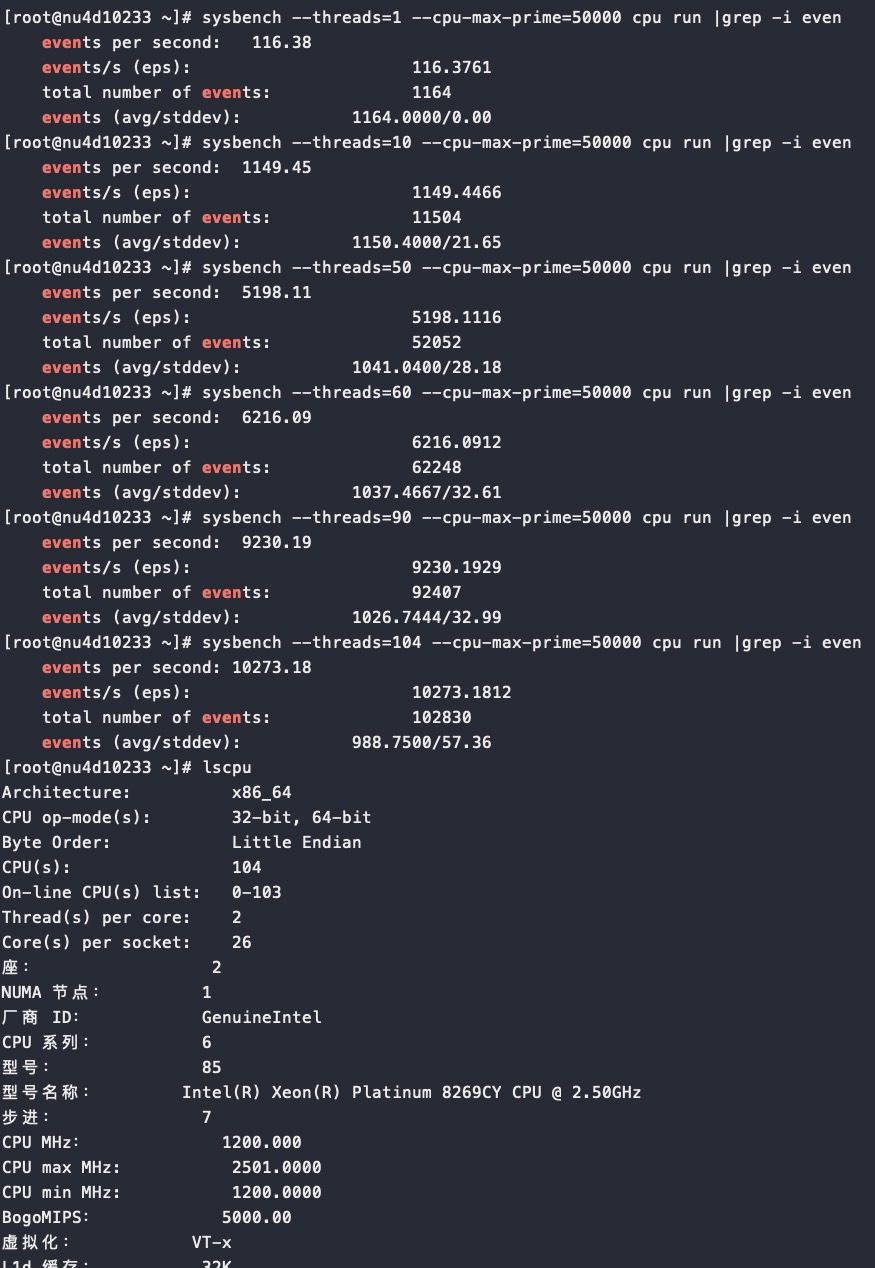
#lscpu Architecture: x86_64 CPU op-mode(s): 32-bit, 64-bit Byte Order: Little Endian CPU(s): 104 On-line CPU(s) list: 0-103 Thread(s) per core: 2 Core(s) per socket: 26 Socket(s): 2 NUMA node(s): 2 Vendor ID: GenuineIntel CPU family: 6 Model: 85 Model name: Intel(R) Xeon(R) Platinum 8269CY CPU @ 2.50GHz Stepping: 7 CPU MHz: 3200.097 CPU max MHz: 3800.0000 CPU min MHz: 1200.0000 BogoMIPS: 4998.89 Virtualization: VT-x L1d cache: 32K L1i cache: 32K L2 cache: 1024K L3 cache: 36608K NUMA node0 CPU(s): 0-25,52-77 NUMA node1 CPU(s): 26-51,78-103 Flags: fpu vme de pse tsc msr pae mce cx8 apic sep mtrr pge mca cmov pat pse36 clflush dts acpi mmx fxsr sse sse2 ss ht tm pbe syscall nx pdpe1gb rdtscp lm constant_tsc arch_perfmon pebs bts rep_good nopl xtopology nonstop_tsc aperfmperf eagerfpu pni pclmulqdq dtes64 monitor ds_cpl vmx smx est tm2 ssse3 fma cx16 xtpr pdcm pcid dca sse4_1 sse4_2 x2apic movbe popcnt tsc_deadline_timer aes xsave avx f16c rdrand lahf_lm abm 3dnowprefetch ida arat epb invpcid_single pln pts dtherm spec_ctrl ibpb_support tpr_shadow vnmi flexpriority ept vpid fsgsbase tsc_adjust bmi1 hle avx2 smep bmi2 erms invpcid rtm cqm mpx rdt avx512f avx512dq rdseed adx smap clflushopt avx512cdavx512bw avx512vl xsaveopt xsavec xgetbv1 cqm_llc cqm_occup_llc cqm_mbm_total cqm_mbm_local cat_l3 mba