十年后数据库还是不敢拥抱NUMA-续篇
十年后数据库还是不敢拥抱NUMA-续篇
背景
十年后数据库还是不敢拥抱NUMA, 这篇经典的纠正大家对NUMA 认知的文章一晃发布快3年了,这篇文章的核心结论是:
- 之所以有不同的NUMA Node 是不同的CPU Core 到不同的内存距离远近不一样所决定的,这是个物理距离
- 程序跑在不同的核上要去读写内存可以让性能差异巨大,所以我们要尽量让一个程序稳定跑在一个Node 内
- 默认打开NUMA Node 其实挺好的
写这个续篇是我收到很多解释,因为跨Node 导致性能抖动,所以集团在物理机OS 的启动参数里设置了 numa=off ,也就是不管BIOS 中如何设置,我们只要在OS 层面设置一下 numa=off 就能让程序稳定下来不再抖了!
我这几年也认为这是对的,只是让我有点不理解,既然不区分远近了,那物理上存在的远近距离(既抖动)如何能被消除掉的呢?
所以这个续篇打算通过测试来验证下这个问题
设置
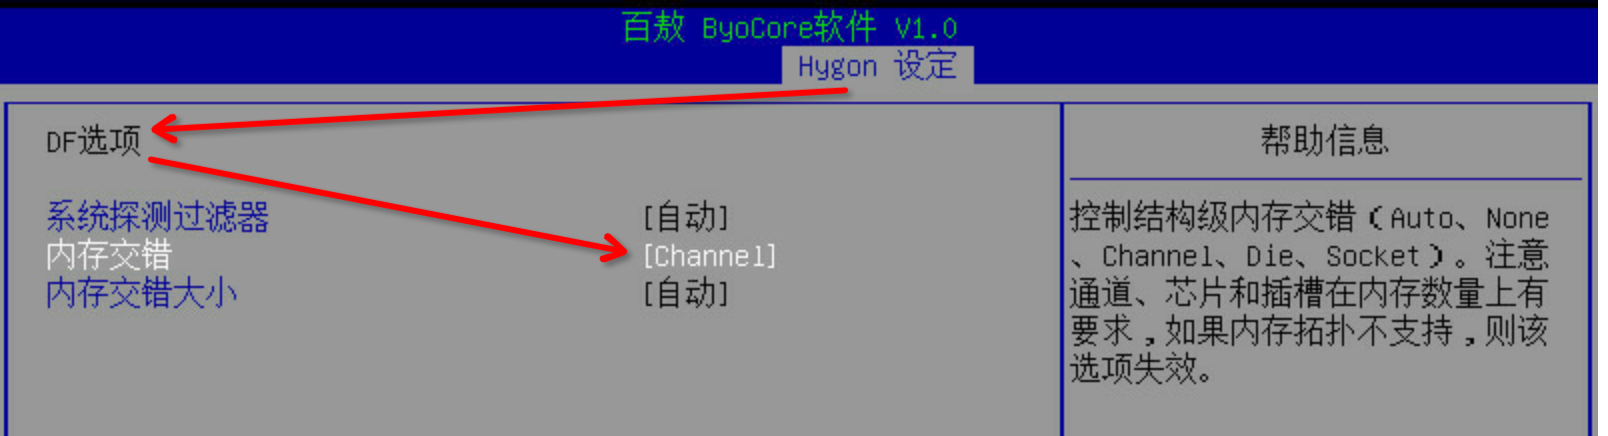
BIOS 中有 numa node 设置的开关(注意这里是内存交错/交织),不同的主板这个BIOS设置可能不一样,但是大同小异,基本都有这个参数

Linux 启动引导参数里也可以设置numa=on(默认值)/off ,linux 引导参数设置案例:
1 | #cat /proc/cmdline |
注意如上的 numa=on 也可以改为 numa=off
看完全置篇要记住一条铁律:CPU到内存的距离是物理远近决定的,你软件层面做些设置是没法优化这个距离,也就是没法优化这个时延 (这是个核心知识点,你要死死记住和理解,后面的一切实验数据都回过头来看这个核心知识点并揣摩)
实验
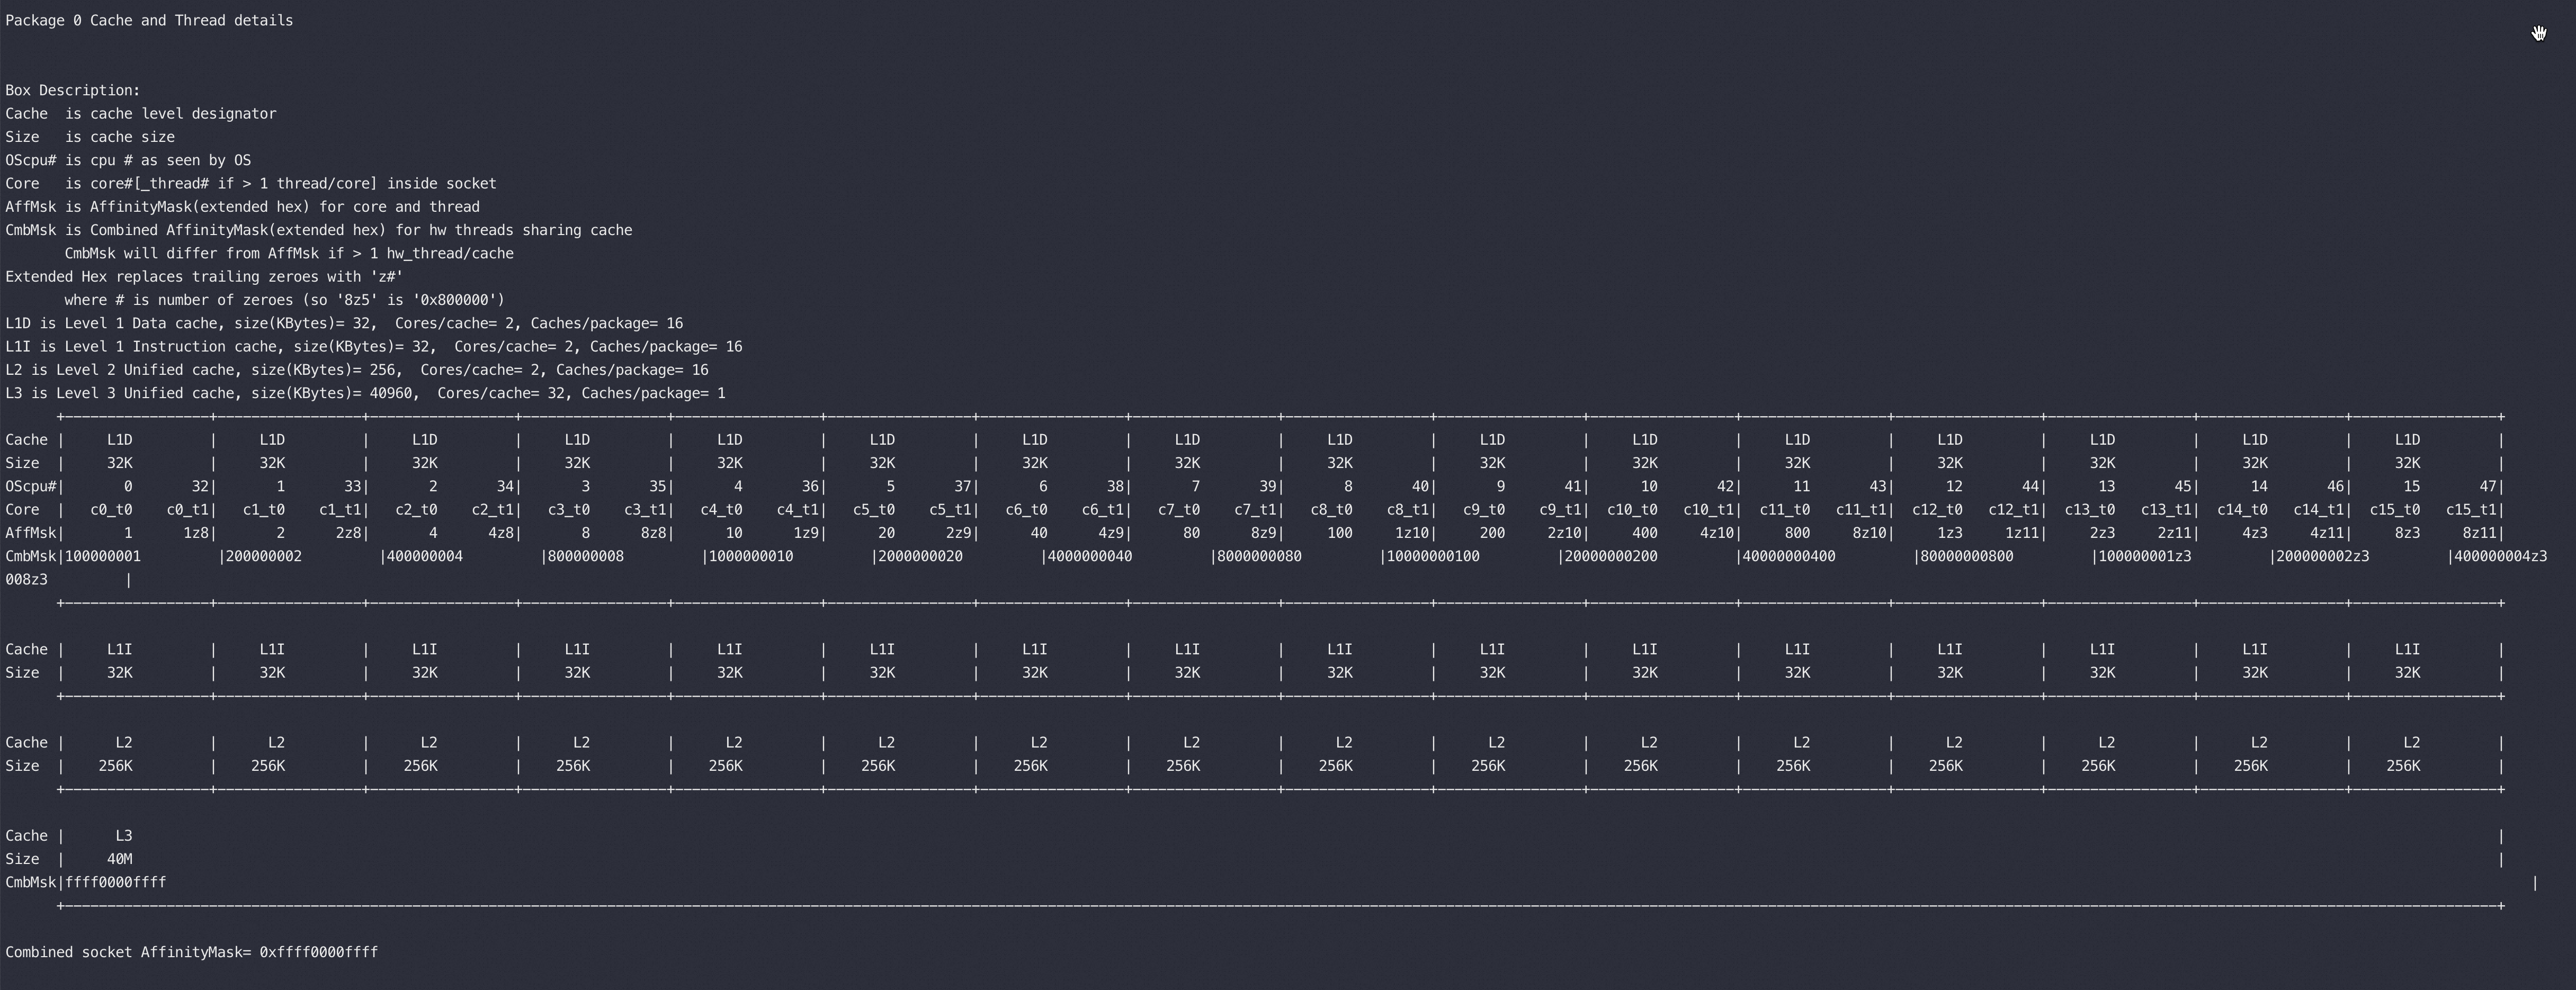
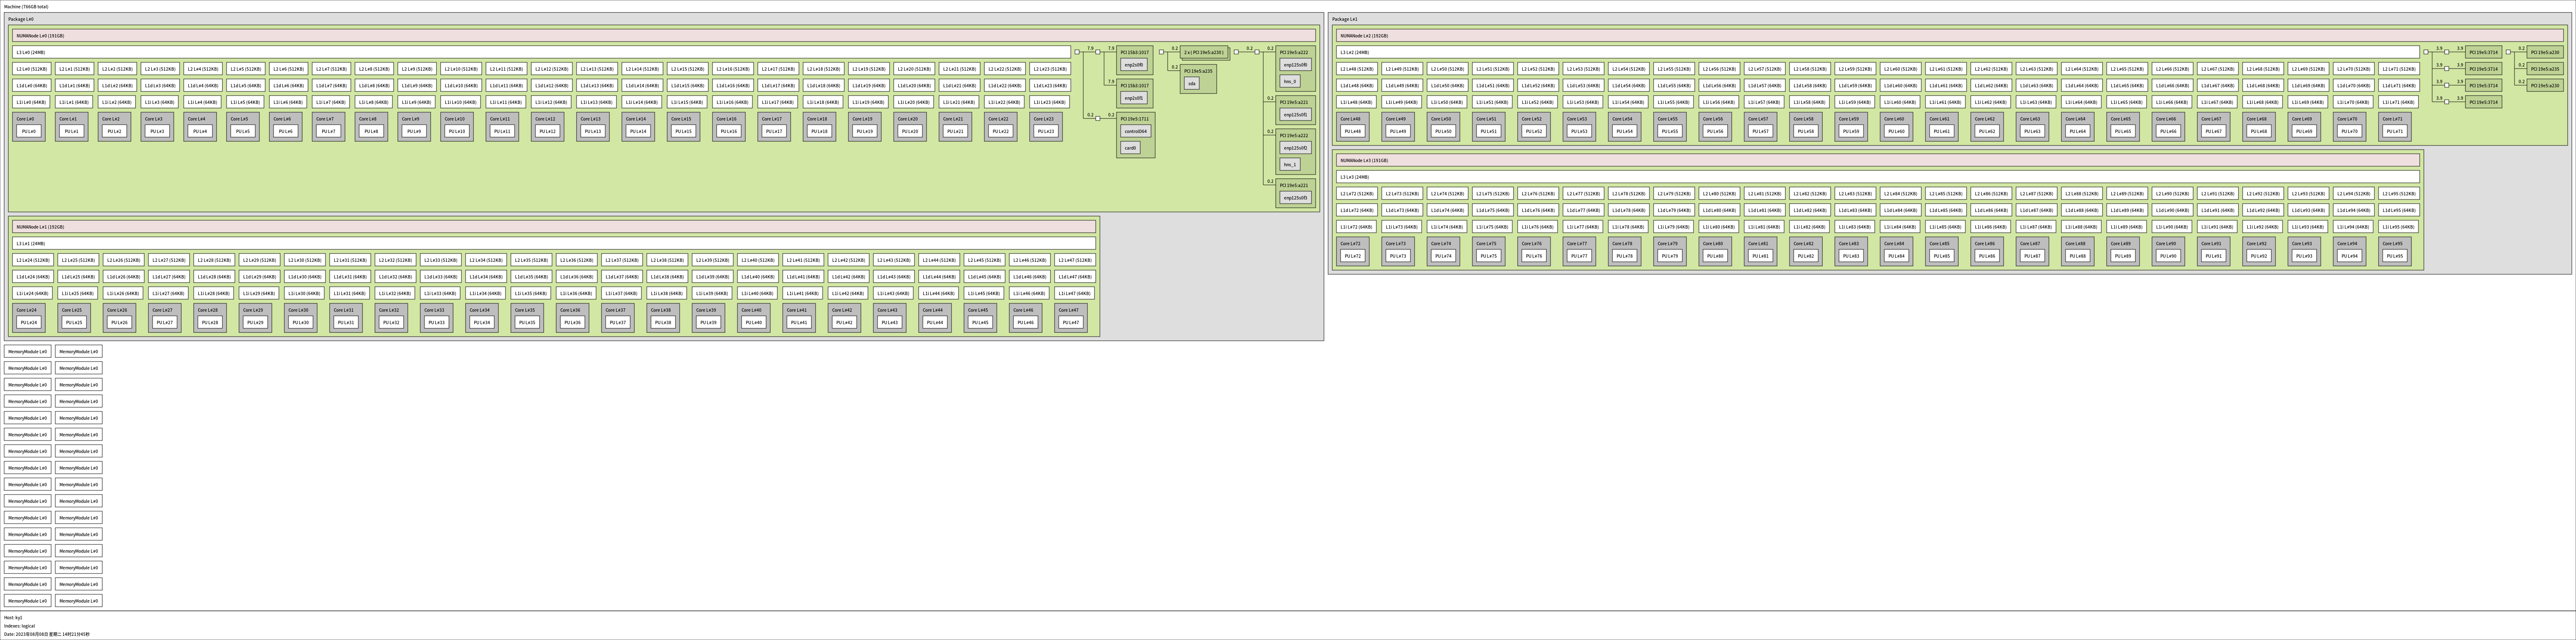
测试机器CPU,如下是BIOS numa=on、cmdline numa=off所看到的,一个node
1 | #lscpu |
测试工具是lmbench,测试命令:
1 | for i in $(seq 0 6 95); do echo core:$i; numactl -C $i -m 0 ./bin/lat_mem_rd -W 5 -N 5 -t 64M; done >lat.log 2>&1 |
上述测试命令始终将内存绑定在 node0 上,然后用不同的物理core来读写这块内存,按照前一篇 这个时延肯定有快慢之分
BIOS和引导参数各有两种设置方式,组合起来就是四种,我们分别设置并跑一下内存时延,测试结果:
| BIOS ON | BIOS OFF | |
|---|---|---|
| cmdline numa=on(默认值) | NUMA 开启,内存在Node内做交织,就近有快慢之分 | bios 关闭后numa后,OS层面完全不知道下层的结构,默认全局内存做交织,时延是个平均值 |
| cmdline numa=off | 交织关闭,效果同上 | 同上 |
测试原始数据如下(测试结果文件名 lat.log.BIOSON.cmdlineOff 表示BIOS ON,cmdline OFF ):
1 | //从下面两组测试来看,BIOS层面 on后,不管OS 层面是否on,都不会跨node 做交织,抖动存在 |
从数据可以看到在BIOS 设置ON后,无论 OS cmdline 启动参数里是否设置了 ON 还是 OFF,内存延时都是抖动且一致的(这个有点诧异,说好的消除抖动的呢?)。如果BIOS 设置OFF后内存延时是个稳定的平均值(这个比较好理解)
疑问
- 内存交错时为什么 lmbench 测试得到的时延是平均值,而不是短板效应的最慢值?
测试软件只能通过大规模数据的读写来测试获取一个平均值,所以当一大块内存读取时,虽然通过交织大块内存被切分到了快慢物理内存上,但是因为规模大慢的被平均掉了。(欢迎内核大佬指正)
- 什么是内存交织?
我的理解假如你有8块物理内存条,如果你有一个int 那么只能在其中一块上,如果你有1MB的数据那么会按cacheline 拆成多个块然后分别放到8块物理内存条上(有快有慢)这样带宽更大,最后测试得到一个平均值
如果你开启numa那么只会就近交织,比如0-3号内存条在0号core所在的node,OS 做内存交织的时候只会拆分到这0-3号内存条上,那么时延总是最小的那个,如上测试中的60多纳秒。
这个问题一直困扰了我几年,所以我最近再次测试验证了一下,主要是对 BIOS=on 且 cmdline=off 时有点困扰
Intel 的 mlc 验证
测试参数: BIOS=on 同时 cmdline off
用Intel 的 mlc 验证下,这个结果有点意思,latency稳定在 145 而不是81 和 145两个值随机出现,应该是mlc默认选到了0核,对应lmbench的这组测试数据(为什么不是100.717, 因为测试方法不一样):
1 | //如下是 |
此时对应的mlc
1 | #./mlc |
当两个参数都为 on 时的mlc 测试结果:
1 | #./mlc |
说明:mlc和 lmbench 测试结果不一样,mlc 时81和145,lmbench测试是68和100,这是两种测试方法的差异而已,但是快慢差距基本是一致的
结论
在OS 启动引导参数里设置 numa=off 完全没有必要、也不能解决抖动的问题,反而设置了 numa=off 只能是掩耳盗铃,让用户看不到 NUMA 结构